PREVALENCE OF HEARING LOSS IN ADOLESCENTS
AND YOUNG ADULTS AS A RESULT OF SOCIAL
NOISE EXPOSURE: META-ANALYSIS
Prevalência de perda auditiva em adolescentes e adultos jovens
decorrentes de exposição a ruído social: meta-análise
Ana Paula Costa Marques (1), Adalberto Luiz Miranda Filho (1), Gina Torres Rego Monteiro (1)
(1) Escola Nacional de Saúde Pública/FIOCRUZ, Rio de
Janeiro, Rio de Janeiro, Brasil. Conlict of interest: non-existent
gyms and mainly using earphones of iPods, MP3, MP4, cell phones, among others, without worrying about the time and intensity of this exposure6-8.
The WHO estimates that 1.1 billion young people, worldwide, may be at risk of hearing loss due to indiscriminate exposure to high intensity noise. In middle- and high-income countries, almost half of all adolescents and young adults (12-35 years old) are exposed to unsafe levels of sound because of the use of personal stereo devices. And 40% of them are exposed to potentially harmful sound.
In this context, evidence points that the extent and the degree of hearing damage continues to be directly related not only to the sound pressure level, frequency and duration, but also to individual7
susceptibility. The hearing loss will afect language and communication of these adolescents and young adults, harming their academic/cognitive, cultural, social and professional9-12 development.
The aim of this paper is to describe the preva
-lence of hearing loss in adolescents and young adults (from 10 to 25 years old) due to social noise exposure, by reviewing some literature and listing the assessment procedures of the self-reported and measured studies.
INTRODUCTION
One of the biggest public health problems currently is the noise pollution and its efects on health, including hearing which, for this reason, has been broadly investigated1,2. According to the
World Health Organization (WHO), over 5% of the world population – 360 million people – have disabling hearing loss (328 million adults and 32 million children). And it is estimated that most of these people live in developing or underdeveloped3 countries. One of the most common causes of hearing loss are German measles infection during pregnancy, ear infections and prolonged exposure to loud noise that stands out as a leading cause of
irreversible hearing loss4,5.
There is an increase in hearing loss in children and
adolescents related to recreational noise exposure1.
Many young people willingly expose themselves to high levels of noise intensity because of their habit of listening to music in bars, nightclubs, parties,
ABSTRACT
The exposure to noise in the teens and young adults leisure has drawn attention, given the impact of hearing loss in this population. This study had the purpose to estimate of the prevalence of hearing loss in this population resulting from exposure to social noise. Seventeen articles were identiied for analysis that met the selection criteria on which it was observed information as design, age, location, evaluation mode, and the prevalence of hearing loss. The prevalence in the self-reported studies was less than 2% while those carrying audiometric ranged from 11.5 to 15.8%. It is concluded considerable heterogeneity between the prevalence of self-reported hearing loss and the measured by audiometric tests in the studied population.
syndromes, auditory neuropathy and / or middle ear pathologies.
Collected data
The reading of selected articles was carried out by two researchers using a checklist for studies assessment and a standard form which included the collection of the following information: authors, year of publication, country and population studied, design, sample size and description, participants’ age range, hearing assessment mode, and preva
-lence of hearing loss in the age group of interest.
Study score analysis and assessment
The extracted data were compared by taking into consideration country of origin, type of study, sample size, participants’ age group, type of auditory assessment and main observed results.
For the study scores assessment, the factors that could be potential sources of error were taken into consideration, such as sample size and method for hearing loss assessment (self-report or measured by instrument).
Studies received a score, considering the following criteria established by the authors: complete audiometric evaluation, incomplete (the ones that had only air conduction) or self-report; study population (population or speciic group); age (age range or a speciic age); protocol (WHO or others); and sample size (small, medium or large). From the score of each study, a score was estab
-lished by quartiles, upper (above the third quartile), moderate (between the irst and the third) and lower (below the irst quartile).
Statistical analysis
A meta-analysis was carried out for those studies that showed the prevalence of hearing loss in certain age range. The heterogeneity of the studies was assessed by the inconsistency (I²) which depicts the percentage variation attributed to them beyond chance. The following cut-of points were considered: 25% low; 50% moderate and 75% high heterogeneity, with p-value <0.05. Due to the high variability in the data, the random efect model was
METHODS
Search strategy and selection criteria
Literature systematic review, with the descriptors DeCS (Health Sciences Descriptors - BIREME) and MeSH (Medical Subject Headings, PubMed) was used without restriction: prevalence(s) AND (hearing disorder(s) OR dysacusis OR hypoac$ OR hearing impairment OR bilateral deafness OR hearing loss, complete OR acquired deafness OR hearing loss, extreme) AND (adolescent(s) OR teen(s) OR teenager(s) OR teenager youth OR youths adolescence OR adult(s), young). Due to
the diferences of search mechanisms and uniterms recognized by each database, it was necessary to adjust the use of descriptors, for instance, including
prevalence inthe search on Web of Science. The
search of articles was carried out in electronic databases - MEDLINE via PubMed, LILACS, WEB
OF SCIENCE, SCOPUS and SCIELO.
The inclusion criteria regarded articles published between January 2000 and July 2013, with available abstract, with free or paid internet access. The search was conducted without any language restriction. Although later, only studies published in Portuguese, English and Spanish, which assessed the prevalence of hearing loss in adolescents and young adults, have been included in the phase of selection. The age classiication followed the criteria of the World Health Organization which covers the period of adolescence in the age range of 10 to 19, while youth corresponds to the age group between 15 and 24 years old. The term “young adult” is also used referring to someone who is between 20 and
25 years old13.
Eligibility for studies
A screening of the localized studies was held, following the methodological steps proposed by the
Preferred Reporting Items for Systematic Reviews and Meta-Analyses - PRISMA14, in order to select
42,651 (forty-two thousand six hundred and ifty-one) have been reported with some level of hearing loss. Almost all the articles beheld men and women, except the ones about military service tracking which reported only results of young men. Three studies showed a higher prevalence of hearing loss in men. Scores, conducted with established criteria, revealed three studies were considered high15-17,
thirteen of them moderate10,18-29 and one study was
low 30 (Table 1).
Concerning the design of the study, nine population surveys have been identiied, a survey for scholars, another one for health service users. Five papers of tracking were selected, three on the assessment for military service, one on evaluation for job admission to enter an industrial workplace and the last one on university music students
(Table 1).
LITERATURE REVIEW
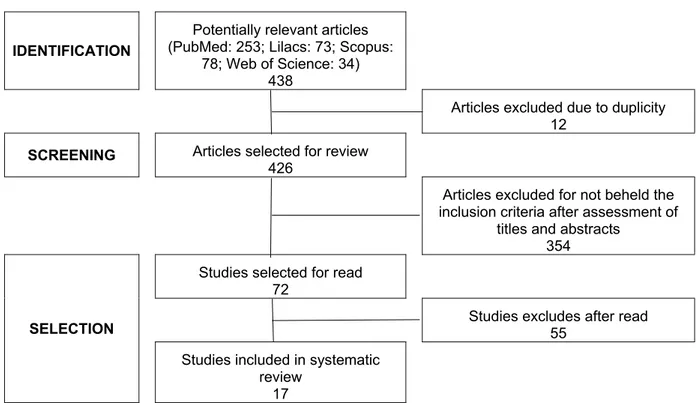
The electronic search in databases resulted in the identiication of 438 articles. Twelve (12) studies were excluded due to duplicity, remaining 426 articles. Out of these, 354 were excluded because they did not have the criteria for inclusion after assessment of titles and abstracts. Among the 72 articles selected for full reading, 17 met inclusion criteria (Figure 1).
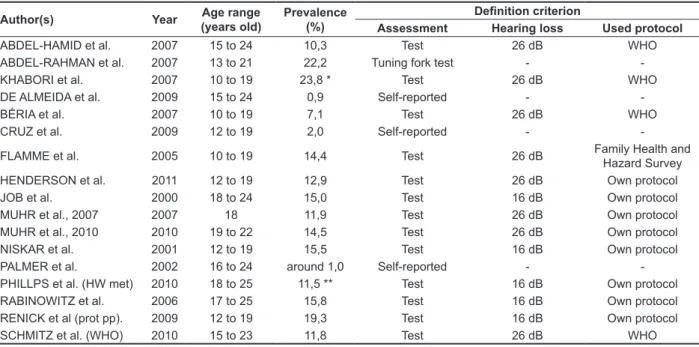
Table 1 depicts the 17 studies, organized according to the author, informing year of publi
-cation, country of origin, design, target population and sample size. Prevalence, age range of the study population and criterion to deine hearing loss are presented in Table 2. In all, the studies were conducted with a population of 367,330 (three hundred sixty-seven thousand three hundred and thirty) adolescents and young adults, whereas
IDENTIFICATION
Potentially relevant articles (PubMed: 253; Lilacs: 73; Scopus:
78; Web of Science: 34) 438
Articles excluded due to duplicity 12
SCREENING Articles selected for review
426
Articles excluded for not beheld the inclusion criteria after assessment of
titles and abstracts 354
SELECTION
Studies selected for read 72
Studies excludes after read 55
Studies included in systematic review
17
efects of noise, due to their leisure activities using technologies almost always under continuous and severe noise exposure. Currently, it is common for young people to use earphones of modern electronics, without regard to the duration and level Lack of uniformity was observed in the age
groups reported in the articles. Although all studies included young people, there was great variety among them: the minimum age ranged from 10 to 19 years old and the maximum from 15 to 24 years old (Table 1). It is not easy to estimate the contribution
Table 1 – Selected studies according to author, year of publication, country, type of study, target population and sample size
Author(s) Year Country Type of study Target Population Quality of
studies Sample size ABDEL-HAMID
et al. 2007 Egypt Household survey Population Sampling high 4000 (778 from 15 to 24 years old) ABDEL-RAHMAN
et al. 2007 Egypt School survey Secondary school students sampling low 2589 KHABORI et al. 2007 Sultanate of
Oman Population survey Population sampling high
11402 (around 3400 from 10 to 19 years old) DE ALMEIDA et al. 2009 Portugal Household survey Population sampling moderate 9110 (1272 from 15 to
24 years old)
BÉRIA et al. 2007 Brazil Household survey Population sampling moderate 2427 (493 from 10 to 19 years old)
CRUZ et al. 2009 Brazil Household survey Population sampling moderate 5250 (s/d age range) FLAMME et al. 2005 USA Population survey Rural Population (8 to 92
years old) moderate
1972 (299 from 10 to 19 years old)
HENDERSON
et al. 2011 USA
Population survey (NHANES 2005/6)
Population sampling (12 to
19 years old) moderate
1791 (12 to 19 years old)
JOB et al. 2000 French Tracking (military service, 1997)
Young men examined for military service sampling
(28 to 24 years old) moderate
1208 (18 to 24 years old)
MUHR et al., 2007 2007 Sweden
Tracking (military service - 1971 a 1995)
Young men examined for
military service moderate 301873
MUHR et al., 2010 2010 Sweden
Tracking (military service - 2002 a 2004)
Young man examined for military service sampling (median: 19 years old)
moderate 839
NISKAR et al. 2001 USA
Population survey (NHANES 1988/94)
Population sampling (6 to
19 years old) moderate 5249 (6 to 19 years old)
PALMER et al. 2002 Great Britain Health service user survey
Health service record
sampling moderate 12907 (s/d age range)
PHILLPS et al. 2010 USA
Tracking
(university student musicians)
university student musicians (18 to 25 years old)
moderate 329
RABINOWITZ
et al. 2006 USA
Tracking (admission test for industry)
Just admitted at Alcoa,
under 26 years old moderate 2526
RENICK et al. 2009 USA Population survey Farmers population
sampling moderate
212 (204 from 12 to 19 years old)
SCHMITZ et al. 2010 Nepal Population survey Rural youth population
participant responded whether they had a closed set of disabilities, including deafness. The study was conducted in six urban areas of São Paulo state, from 2001 to 2002. In the age group of 12 to19 years old, the prevalence of self-reported hearing loss was 2.0% (95% CI: 1.3 to 3.1)
The procedures for hearing loss assessment in the studies of this review can be classiied into three groups. In the irst, there are four studies (23.5%) that used the WHO Ear and Hearing Disorders Survey Protocol for the Population-Based Survey of Prevalence and Causes of Deafness and Hearing Impairment and Other Ear Diseases, which proposes
two stages of assessment, covering environmental noise measurement, application of questionnaire, otoscopy, pure-tone audiometry (over 4 years old) and impedanciometry. In the second group, there are nine surveys (52.9%) which use their own protocol for hearing loss assessment. Finally, the third group (23.6%), three studies were self-reported and evaluated with a tuning fork (Table 2).
Regarding the countries of origin for the research, six (35.3%) were in the USA, ive (29.4%) in European countries, two (11.8%) in Brazil and four (23.6%) in other parts of the world (Table 1). Studies conducted in the United States of America had a mean prevalence of 14.7% (95% CI 13.5 to 16.0; I²: 66.7%; p = 0.01). The mean prevalence of those conducted in Europe was 5% (95% CI 1.6 to 13.5) and the ones developed in other countries was 10.2% (95% CI 5.0 to 17.0), and high heterogeneity was observed in these last two study groups, with I²: 99% and p value <0.001.
It should be noted that the two studies conducted in Brazil were quite distinctive household surveys. Béria and collaborators18 carried out an audiological
evaluation in children who were over four years old in a sample of the population from Canoas, RS, in 2003. They studied frequencies of 0.5 to 8 kHz and classiied as mild hearing loss from 26 dB, detecting a prevalence of 7.1% in the age range from 10 to 19 years old. Cruz and collaborators10 estimated
hearing loss through interviews in which the
Table 2 – Selected studies according to author, year of publication, age range, prevalence and criterion for hearing loss deinition
Author(s) Year Age range
(years old)
Prevalence (%)
Deinition criterion
Assessment Hearing loss Used protocol
ABDEL-HAMID et al. 2007 15 to 24 10,3 Test 26 dB WHO
ABDEL-RAHMAN et al. 2007 13 to 21 22,2 Tuning fork test -
-KHABORI et al. 2007 10 to 19 23,8 * Test 26 dB WHO
DE ALMEIDA et al. 2009 15 to 24 0,9 Self-reported -
-BÉRIA et al. 2007 10 to 19 7,1 Test 26 dB WHO
CRUZ et al. 2009 12 to 19 2,0 Self-reported -
-FLAMME et al. 2005 10 to 19 14,4 Test 26 dB Family Health and
Hazard Survey
HENDERSON et al. 2011 12 to 19 12,9 Test 26 dB Own protocol
JOB et al. 2000 18 to 24 15,0 Test 16 dB Own protocol
MUHR et al., 2007 2007 18 11,9 Test 26 dB Own protocol
MUHR et al., 2010 2010 19 to 22 14,5 Test 26 dB Own protocol
NISKAR et al. 2001 12 to 19 15,5 Test 16 dB Own protocol
PALMER et al. 2002 16 to 24 around 1,0 Self-reported -
-PHILLPS et al. (HW met) 2010 18 to 25 11,5 ** Test 16 dB Own protocol
RABINOWITZ et al. 2006 17 to 25 15,8 Test 16 dB Own protocol
RENICK et al (prot pp). 2009 12 to 19 19,3 Test 16 dB Own protocol
SCHMITZ et al. (WHO) 2010 15 to 23 11,8 Test 26 dB WHO
hearing thresholds. Complementary observations of the inspection procedure, added to those disclosed by the tests, will surely reveal the audiological condition more accurately34,35.
Shortage of papers in the established age group (15 to 24 years old) was a limitation of this study. Nevertheless, it was possible to identify studies which, even covering wide age ranges, showed prevalence by age strata. Another matter which is worthy to note is the variability in the prevalence of hearing loss in adolescents and young adults. It can be attributed, among other aspects, to diferent hearing loss identiication models used in the studies, as well as the criteria for loss of degree classiication, and also the diversity of the age group included in them.
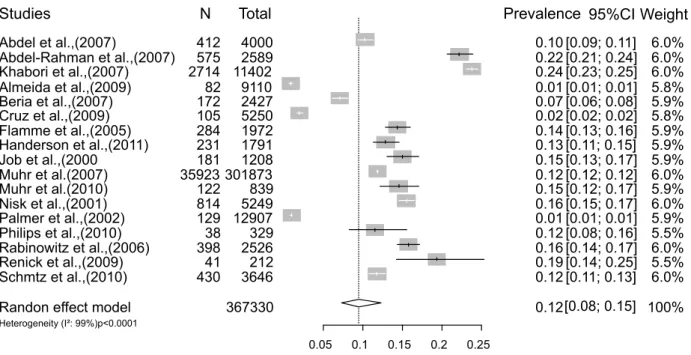
In summary, in this meta-analysis, it was possible to observe a mean prevalence (meta-prevalence) of 12.0%, (95% CI 0.8 to 15) (Figure 2). It is worth noting the strong inluence of both self-reported studies whose prevalence were 0.9% and 2.0%, while in the studies that measured hearing there was a variation from 7.1% to 23.8%.
CONCLUSION
Reading the papers, it was possible to identify a signiicant heterogeneity between the prevalence of self-reported hearing loss and the one measured by objective criteria. While in self-evaluation less than 2.0% of young people mentioned they had any deicit, studies conducting audiometry showed higher prevalence between 11.5 and 15.8%.
Currently, the use of earphones without any worry about duration or level of exposure is common. It is important to conduct studies to identify the temporary changes in the hearing threshold, in order to prevent permanent damage.
The necessity for research focusing on the population of adolescents and young adults is noteworthy, since they represent a part of the population who is susceptible to irreversible hearing loss due to high levels of indiscriminate non-occupa
-tional noise exposure intensity.
ACKNOWLEDGEMENTS
The four studies which evaluated hearing loss by the World Health Organization protocol presented a mean prevalence of 12.2% (95% CI 6.0 to 20.0) and considerable heterogeneity I²: 99.1%, p-value <0.001. Value similar to that observed in those eight ones which used their own protocols: 11.6% (95% CI 9.0 to 14.1; I²: 97.6% and p-value <0.001).
Five papers considered high frequency tonal threshold, classifying mild hearing loss from 16dB and observed prevalence near 15%24-29. Four
studies considered the mean of three frequencies (i.e. 500Hz, 1Khz and 2Khz) and established the mild hearing loss from 26dB15,16,18,24. The studies
using the cutof point for mild hearing loss from 26dB showed greater variability in the prevalence of hearing loss: 7.1 to 23.8%
Studies with self-reported assessment of hearing loss showed lower prevalence than the ones that applied some type of measurement. This lower prevalence can be explained by the fact that high frequency hearing loss is barely perceptible, since it does not bring impact or obvious signs which impair daily activities31. This procedure underestimates hearing loss and can be a source of bias in inter
-preting results.
Diferences found in the results may be explained, at least partially, by methodological aspects, especially those related to the deinition criteria for hearing loss. The study of Abdel-Hamid and collaborators15 used tuning fork test as a clinical
procedure to diagnose hearing loss, while others used pure-tone audiometry, which is a test usually indicated for the determination of hearing thresholds (Table 2). Another potential source of variability in the prevalence of hearing loss is the subjectivity of pure-tone audiometry, which may underestimate or overestimate the true prevalence, giving the possi
-bility of false positives32.
The conduction of otoscopy procedure as a careful inspection of the external auditory canal and tympanic membrane viewing is essential to control possible biases in audiometric results. Although it has no diagnostic aim, the test may provide infor
Studies
Randon effect model
Heterogeneity (I²: 99%)p<0.0001
Abdel et al.,(2007)
Abdel-Rahman et al.,(2007) Khabori et al.,(2007) Almeida et al.,(2009) Beria et al.,(2007) Cruz et al.,(2009) Flamme et al.,(2005) Handerson et al.,(2011) Job et al.,(2000
Muhr et al.(2007) Muhr et al.(2010) Nisk et al.,(2001) Palmer et al.,(2002) Philips et al.,(2010) Rabinowitz et al.,(2006) Renick et al.,(2009) Schmtz et al.,(2010)
N 412 575 2714 82 172 105 284 231 181 35923 122 814 129 38 398 41 430 Total 367330 4000 2589 11402 9110 2427 5250 1972 1791 1208 301873 839 5249 12907 329 2526 212 3646
0.05 0.1 0.15 0.2 0.25
Prevalence 0.12 0.10 0.22 0.24 0.01 0.07 0.02 0.14 0.13 0.15 0.12 0.15 0.16 0.01 0.12 0.16 0.19 0.12 95%CI [0.08; 0.15] [0.09; 0.11] [0.21; 0.24] [0.23; 0.25] [0.01; 0.01] [0.06; 0.08] [0.02; 0.02] [0.13; 0.16] [0.11; 0.15] [0.13; 0.17] [0.12; 0.12] [0.12; 0.17] [0.15; 0.17] [0.01; 0.01] [0.08; 0.16] [0.14; 0.17] [0.14; 0.25] [0.11; 0.13] Weight 100% 6.0% 6.0% 6.0% 5.8% 5.9% 5.8% 5.9% 5.9% 5.9% 6.0% 5.9% 6.0% 5.9% 5.5% 6.0% 5.5% 6.0%
Figure 2 – Prevalence of hearing loss in adolescents and young adults
REFERENCES
1. Johnson O, Andrew B, Walker D, Morgan S, Aldren A. British university students’ attitudes towards noise-induced hearing loss caused by nightclub attendance. J Laryngol Otol. 2014;128(1):29-34. 2. Nelson DI, Nelson RY, Concha-Barrientos M, Fingerhut M. The global burden of occupational noise-induced hearing loss. Am J Ind Med.
2005;48(6):446-58.
3. WHO. Deafness and hearing loss;Fact Sheet No 300, Updated March 2015. Available from: <www. who.int/entity/mediacentre/factsheets/fs300/en/ >
4. Tung C-Y, Chao K-P. Efect of recreational noise exposure on hearing impairment among teenage students. Res Dev Disabil. 2013;34(1):126-32. 5. Fligor BJ, Cox LC. Output levels of commercially available portable compact disc players and the potential risk to hearing. Ear Hear. 2004;25(6):513-27. 6. Biassoni EC, Serra MR, Richtert U, Joekes S, Yacci MR, Carignani JA et al. Recreational noise exposure and its efects on the hearing of adolescents. Part II: development of hearing disorders. Int J Audiol.
2005;44:74-85.
7. Borja ALV, Sousa BF e, Ramos MM, Araújo RPC de: O que os jovens adolescentes sabem sobre as perdas induzidas pelo excesso de ruído?. Rev Ciênc Médicas E Biológicas. 2002;1:86-98.
RESUMO
A exposição a ruídos no lazer de adolescentes e jovens adultos tem chamado atenção, dada a reper
-cussão da perda auditiva nessa população. Esse estudo propôs estimar a prevalência de perda auditiva dessa população decorrentes de exposição a ruídos sociais. Foram identiicados 17 artigos para análise que atenderam aos critérios de seleção, sobre os quais se observaram informações de: delineamento, faixa etária, localização, modo de avaliação e a prevalência de perda auditiva. Nos estudos autorreferidos, a prevalência foi inferior a 2%, enquanto aqueles que realizam audiometria foi de 11,5 e de 15,8%. Concluiu-se uma heterogeneidade entre a prevalência de perda auditiva autorre
-ferida e a mensurada por exames audiométricos na população pesquisada.
uma análise aos dados do quarto Inquérito Nacional de Saúde. Acta Médica Port. 2009;22(3):223-32. 20. Flamme GA, Mudipalli VR, Reynolds SJ, Kelly KM, Stromquist AM, Zwerling C, et al. Prevalence of hearing impairment in a rural midwestern cohort: estimates from the Keokuk county rural health study, 1994 to 1998. Ear Hear. 2005;26(3):350-60. 21. Henderson E, Testa MA, Hartnick C. Prevalence of noise-induced hearing-threshold shifts and hearing loss among US youths. Pediatrics. 2011;127:e39-e46.
22. Job A, Raynal M, Tricoire A, Signoret J, Rondet P. Hearing status of French youth aged from 18 to 24 years in 1997: a cross-sectional epidemiological study in the selection centres of the army in Vincennes and Lyon. Rev Epidemiol Sante Publique. 2000;48(3):227-37.
23. Muhr P, Rasmussen F, Rosenhall U. Prevalence of hearing loss among 18-year-old Swedish men during the period. Scand J Public Health. 2007;35(5):524-32.
24. Muhr P, Rosenhall U. Self-assessed auditory symptoms, noise exposure, and measured auditory function among healthy young Swedish men. Int J Audiol. 2010;49(4):317-25.
25. Niskar AS, Kieszak SM, Holmes AE, Esteban E, Rubin C, Brody DJ. Estimated prevalence of noise-induced hearing threshold shifts among children 6 to 19 years of age: the Third National Health and Nutrition Examination Survey,. Pediatrics. 2001;108(1):40-3.
26. Palmer KT, Griin MJ, Syddall HE, Davis A, Pannett B, Coggon D. Occupational exposure to noise and the attributable burden of hearing diiculties in Great Britain. Occup Environ Med. 2002;59(9):634-9.
27. Phillips SL, Henrich VC, Mace ST. Prevalence of noise-induced hearing loss in student musicians. Int J Audiol. 2010;49(4):309-16.
28. Rabinowitz PM, Slade MD, Galusha D, Dixon-Ernst C, Cullen MR. Trends in the prevalence of hearing loss among young adults entering an industrial workforce 1985 to 2004. Ear Hear. 2006;27(4):369-75.
29. Renick KM, Crawford JM, Wilkins JR 3rd. Hearing loss among Ohio farm youth: a comparison to a national sample. Am J Ind Med. 2009;52(3):233-9. 30. Abdel-Rahman AG, Meky FAS, Allam MF, El-Tabakh M, El-Gaafary MM. Prevalence and risk 8. Daniel E. Noise and hearing loss: a review. J Sch
Health. 2007;77(5):225-31.
9. Balen SA, Debiasi TF, Pagnossim DF, Broca VS, Roggia SM, Gondim LM:Caracterização da audição de crianças em um estudo de base populacional no município de Itajaí/SC. Arq Int Otorrinolaringol. 2009;13:372-80.
10. Cruz MS, Oliveira LR de, Carandina L, Lima MCP, Cesar CLG, Barros MB de A et al.[Prevalence of self-reported hearing loss and attributed causes: a population-based study. Cad Saude Publica. 2009;25(5):1123-31.
11. Martines C, Bernardi A. A percepção diferenciada do barulho: Estudo comparativo com jovens frequentadores e funcionários de casas noturnas da cidade de São Paulo. Rev CEFAC [periódico na internet]. 2001 [acesso em 2012 Dez 02]; 3:71-6. Disponível em: http://www.cefac.br/revista/ revista31/artigo%208.pdf [Links].
12. Musani MA, Rauf A, Ahsan M, Khan FA. Frequency and causes of hearing impairment in tertiary care center. JPMA-J Pak Med Assoc.
2011;61(2):141-4.
13. WHO. Young people’s health-a challenge for society: report of a WHO Study Group on Young People and “Health for All by the Year 2000”[meeting held in Geneva from 4 to 8 June 1984]. 1986;Technical Report Series 731.
14. Liberati A, Altman DG, Tetzlaf J, Mulrow C, Gøtzsche PC, Ioannidis JP et al. The PRISMA statement for reporting systematic reviews and meta-analyses of studies that evaluate health care interventions: explanation and elaboration. Ann Intern Med. 2009; 151(4):W-65-W-94.
15. Abdel-Hamid O, Khatib OMN, Aly A, Morad M, Kamel S. Prevalence and patterns of hearing impairment in Egypt: a national household survey. East Mediterr Health J Rev Sante Mediterr Orient Al-Majallah Al-Sihhiyah Li-Sharq Al-Mutawassit. 2007;13(5):1170-80.
16. Al Khabori M, Khandekar R. Unilateral hearing impairment in Oman: a community-based cross-sectional study. Ear Nose Throat J. 2007;86(5):274-7. 17. Schmitz J, Pillion JP, LeClerq SC, Khatry SK, Wu LS-F, Prasad R et al. Prevalence of hearing loss and ear morbidity among adolescents and young adults in rural southern Nepal. Int J Audiol. 2010;49(5):388-94.
34. Wambier GE, Sava HW, Sampaio CPP, Paula AA de. Otoscopia: exame da orelha. J Bras Med. 2012;100(1):24-30.
35. Garcia MV, Azevedo MF de, Testa JR. Accoustic immitance measures in infants with 226 and 1000 hz probes: correlation with otoacoustic emissions and otoscopy examination. Braz J Otorhinolaryngol.
2009;75(1):80-9.
adolescents. Part I: an interdisciplinary long-term study. Int J Audiol. 2005;44:65-73.
32. Gates GA, Murphy M, Rees TS, Fraher A. Screening for handicapping hearing loss in the elderly. J Fam Pract. 2003; 52: 56-62.
33. Momensohn-Santos TM, Russo ICP. Prática da audiologia clínica. Cortez; 2009.
http://dx.doi.org/10.1590/1982-021620151761115
Recebido em: 26/01/2015
Aceito em: 19/08/2015
Endereço para correspondência: Ana Paula Costa Marques
Rua Grande Otelo, 270 apt. 504 Olympic, Condomínio Garden Club Residence, parque 10 Manaus, Amazonas, Brasil
CEP: 69055-021