*e-mail: [email protected]
Received: 23 October 2013 / Accepted: 02 December 2013
Galvanic vestibular stimulator for fMRI studies
Hellen Mathei Della-Justina*, Tiago Manczak, Anderson Marcelo Winkler, Dráulio Barros de Araújo, Mauren Abreu de Souza, Edson Amaro Junior, Humberto Remigio Gamba
Abstract Introduction: Areas of the brain that are associated with the vestibular system can be activated using galvanic vestibular stimulation. These areas can be studied through a combination of galvanic vestibular stimulation with functional magnetic resonance imaging (fMRI). In order to provide an appropriate sequence of galvanic
stimulation synchronous with the MRI pulse sequence, a speciic electronic device that was built and assessed
is presented. Methods: The electronic project of the GVS is divided in analog and digital circuits. The analog circuits are mounted in an aluminum case, supplied by sealed batteries, and goes inside the MRI room near to the feet of the subject. The digital circuits are placed in the MRI control room. Those circuits communicate
through each other by an optical iber. Tests to verify the GVS-MRI compatibility were conducted. Silicone
(in-house) and Ag/AgCl (commercial) electrodes were evaluated for maximum balance and minimal pain sensations. fMRI experiments were conducted in eight human volunteers. Results: GVS-MRI compatibility experiments demonstrate that the GVS did not interfere with the MRI scanner functionality and vice versa. The circular silicone electrode was considered the most suitable to apply the galvanic vestibular stimulation. The 1 Hz stimulation sinusoid frequency produced the biggest balance and the less pain sensations when compared to 2 Hz. The GVS was capable of eliciting activation in the precentral and postcentral gyri, in the central sulcus, in the supplementary motor area, in the middle and inferior frontal gyri, in the inferior parietal lobule, in the insula, in the superior temporal gyrus, in the middle cingulate cortex, and in the cerebellum. Conclusion: This study shows the development and description of a neurovestibular stimulator that can be safely used inside the MRI scanner room without interfering on its operation and vice versa. The developed GVS could successfully activate the major areas involved with multimodal functions of the vestibular system, demonstrating its validity as a stimulator for neurovestibular research. To the best of our knowledge, this is
the irst work that shows the development and the construction of a galvanic vestibular stimulator that could
be safely used inside the MRI room.
Keywords Devices, fMRI, Vestibular apparatus, Electrical stimulation.
Introduction
Galvanic vestibular stimulation has been used to study various human vestibular function, such as whole-body control, gait, gaze, balance (Day, 1999; Fitzpatrick et al., 1999) and to locate lesions in patients with clinical vestibular conditions, such as unilateral vestibular loss, canal block, and vestibular neuritis (MacDougall et al., 2005). Also, it can be used in the evaluation of various problems related to sensorimotor dysfunction, as that experienced by astronauts upon returning from space (Moore et al., 2006, 2011) and for training simulations with future astronauts (Dilda et al., 2011).
Areas of the brain that are associated with the vestibular system can be studied through a combination of galvanic vestibular stimulation with functional magnetic resonance imaging (fMRI) (Bense et al., 2001; Bucher et al., 1998; Eickhoff et al., 2006a; Fink et al., 2003; Lobel et al., 1998; Smith et al., 2012; Stephan et al., 2005). However, the MRI scanner
room is a hostile environment for any electronic device, because the high intensity static magnetic ield, the magnetic gradients, and the radio frequency (RF) pulses can disrupt the normal functionality of any electronic equipment inside the scanner room. Also, an electronic device produces electromagnetic noises that can interfere with the proper functioning of the MRI scanner itself. Thus, a galvanic vestibular stimulator (GVS) that can be used with safely into the scanner room must be properly shielded, battery supplied, and the current stimulation periods must be precisely synchronized with the MRI pulse sequence.
evaluated the interference introduced in the images by the stimulator.
The aim of this study is to present a full GSV system designed for fMRI research. The main electronic circuits and the compatibility tests conducted to ensure the safety of the subjects and adequate functionality of the GVS inside the scanner room are presented. The results of a speciic study were also presented to establish the most suitable electrode for the vestibular stimulation within the magnet scanner, namely, a pair of electrodes that produces the strongest balance sensation with minimum pain. Finally, to validate the proposed GVS, the results of GVS-fMRI experiments conducted using human volunteers are presented. To the best of our knowledge, this is the irst study demonstrating the construction of a GVS that can be safely operated inside the MRI room.
Methods
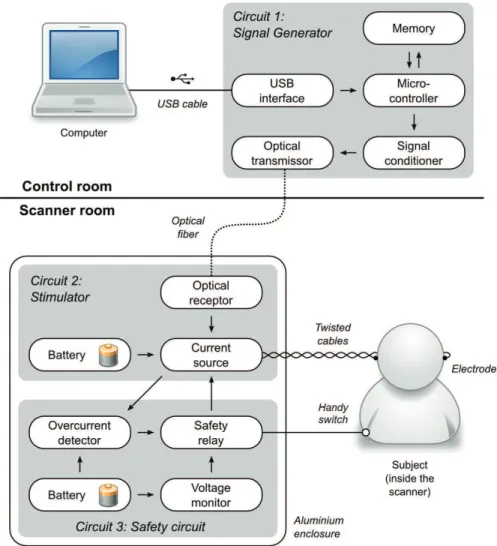
Figure 1 shows the two blocks of the proposed GVS: the Signal Generator and the Stimulator. These two blocks are interconnected through an optical iber cable. They were designed to ensure that the digital (Signal Generator) and analog (Stimulator) circuits are separately mounted and powered. Digital electronic circuits produce high-frequency noises that interfere with the MRI signals. Therefore, these circuits must be placed outside the MRI scanner room. In Figure 1, the analog circuits are located inside the scanner room and are mounted in a grounded shield box in order to avoid interferences from the MRI RF pulses and magnetic gradients, and also to minimize possible interferences that the analog circuits may cause at the MRI spin magnetization signals. The MRI Faraday cage avoids external electrical interferences in the spin
Figure 1. Block diagram of the Galvanic Vestibular Stimulator. It is composed of three separate units: the Signal Generator, the Stimulator, and the Safety circuit. The Signal Generator is controlled by a computer and placed in the MRI control room, whereas the Stimulator and
signals. Therefore, it is not allowed to have electrical cable going through the cage wall, because it will act like an aerial, picking up external noises and bringing them to inside the cage. Thus, to connect the two blocks, an optical cable was employed.
The Signal Generator, Figure 1, is connected to the universal serial bus (USB) port of the computer. Through it data are transferred and the electronic circuit is supplied. The electrical current waveforms, amplitude, frequency, working cycle, synchronization with the MRI pulse sequence are controlled by a software application that runs in the computer. The possible waveforms are square, sine, triangular, and saw-tooth. Once the signal is conigured, a ile with the waveform is transferred to the microcontroller of the Signal Generator, stored in its memory, and converted to an analog signal by the microcontroller digital-to-analog converter (DAC). This analog signal has its amplitude adjusted, converted into a light signal, and transmitted through an optical cable to the Stimulator that is placed inside the magnet room. The Signal Generator also needs an input signal to synchronize the MRI pulse sequence with the
electrical current pulses. The General Electric (GE) MRI system provides a 5 V pulse in the beginning of every acquisition volume. The Signal Generator
uses one of its microcontroller interrupt pin to count the volumes and proceed with the pre-arranged stimulation sequence.
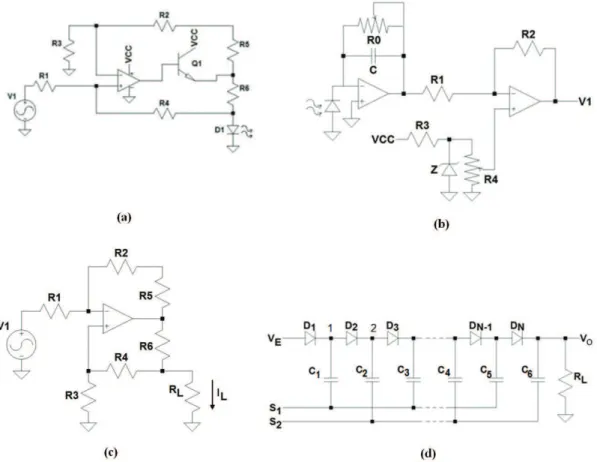
Figure 2a presents the current driver to control the IR-LED SFH400 light intensity. The light intensity must be proportional to the Signal Generator
waveform, represented by V1. To convert V1 to current, we have used a modiied version of the Howland current source (Pease, 2008), where the load is the IR-LED. The transistor Q1 was used to increase the delivered electrical current through the light emitting diode (LED). V1 is applied at the non-inverter input of the operational ampliier, since there is no symmetric power.
The electrical impedance between the cutaneous electrodes over the mastoid processes
In order to develop the Stimulator, it is necessary to estimate the electrical impedance between the
Figure 2. (a) Current and (b) optical receiver drivers for the IR-LED transmitter. (c) Current source of the Stimulator circuit. (d) Dickson voltage multiplier. VE is the battery +12 voltage. S1 and S2 are sine waves 180 degree diphase (S1 = –S2). The maximum output current
for Vs = 42V is 5 mA. The number of stages was three. Diodes are 1N4007 and C are electrolytes capacitors of 220 μF. The sine wave
Figure 3. Impedance spectroscopy. The spectral impedance between electrodes placed bilaterally in the retroauricular region was studied using a Solartron 1255 HF Frequency Response Analyzer. The measurements were performed in two healthy volunteers using commercial adhesive ECG electrodes. The skin was cleaned with alcohol 70% before adhering to the electrodes. The spectrogram shows a plateau at
approximately 14 kΩ for frequency below 5 Hz.
electrodes placed over the mastoid processes, which are located of the temporal bones. For this we have used normal electrocardiogram (ECG) electrodes and the Frequency Response Analyzer, 1255 HF, from Solartron Analytical. The plot in Figure 3 indicates that for frequencies below 5 Hz, this impedance is around 14 kΩ. The frequencies used to stimulate the vestibular system are below 5 Hz (Latt et al., 2003; MacDougall et al., 2006).
Galvanic current source
The Stimulator (Figure 1) generates a zero mean constant electric current adjustable up to 5 mA. The electrical current is generated by a Howland current source (Pease, 2008). The current intensity is controlled by the optical signal intensity sent via the optical iber by the Signal Generator that is placed in the MRI control room. The Howland current source is adopted in many biomedical applications (Pouliquen et al., 2008; Sooksood et al., 2010; Tucker et al., 2013; Zhao, 2011). The main advantages of this current source are the need for only one operational ampliier, the possibility to provide alternate currents (AC) to the load, its high output impedance, and the load reference is grounded (Pouliquen et al., 2008). The disadvantage of this coniguration is that the resistors must be well matched to provide the highest impedance output (Tucker et al., 2013). However, this disadvantage is minimized using precision resistors. Figure 2c shows the electrical circuit of the Howland current source. Considering R1 = R3, R2 = R4 and R5 = R6, the load current is determined by Equation 1.
1 2 1 6
= −
L
V R I
R R (1)
In applications such as the GVS, where R6 <<
RL (= 14 kΩ), the load voltage is the same as the
operational ampliier maximum output voltage swing.
In Figure 2c, V1 is the output voltage of the light to voltage receiver circuit shown in Figure 2b. The photo diode SFH229FA receives light from the optical iber and controls the current at the input of a current to voltage convertor. The second operational ampliier is used to adjust V1 offset.
In general, the current applied to stimulate the vestibular system in fMRI experiments is around 3 mA (Bucher et al., 1998; Eickhoff et al., 2006a; Fink et al., 2003). In our experiments, the subjects reported a balance sensation with currents between 0.5 and 2.5 mA.
Thus, for a 14 kΩ impedance and a peak current of 3 mA, a power source of at least ±42 V, is necessary. To build a current source that can feed a constant current to a load of 14 kΩ we used the high output voltage operational ampliier OPA445 from Texas Instruments.
The Stimulator is supplied by two rechargeable 12V, 1.3Ah lead-acid batteries. Two Dickson voltage multiplier (Pylarinos, 2003) were used to multiply the ±12 V, and to power the OPA445 with ±42 V. Figure 2d shows the electrical circuit of the Dickson multiplier.
The output voltage VS =VE +N(2VS -VD), where VD is the direct polarization of the diodes, VE is the 12 voltage from the battery and VS = VE. If two stages are considered, the output VS = 58 V. However, inside the MRI room no digital circuit is allowed. Thus, considering the same principle, instead of using square wave in the S1 and S2 inputs of the multipliers’ input we used sine waves of 1 kHz. This option reduces the eficiency, since an extra stage was required to compensate it.
Safety circuits
electrical current exceeds a certain threshold value. Figure 4a shows the Safety circuit in detail. The voltage-drop over the shunt resistor RS, connected in series with the patient (RL), is ampliied by the differential ampliier. The output signal is then compared with a threshold of ±2.5 V, which corresponds to a maximum current of ±5 mA through RS. If one of these thresholds is exceeded, the output voltage of the comparator changes from +5 to –5 V switching on the safety relay. The contact NO1 is moved to C1, placing a short circuit in the electric current through the patient, avoiding any hazard to the subject. An LED indicates when the security system was triggered and needs to be manually reset. To reset the security system, the reset button must be pressed.
The stimulator and safety circuits are built with only analog circuits and are enclosed into a 10-mm-thick aluminum box. The analog circuits are placed in the scanner room, without compromising the operation of both the MRI and the GVS itself. The Safety circuit
is powered by two 9 V batteries.
The subject can also turn off the stimulation by releasing his hand from the Handy Switch (Figure 1). The Handy Switch is a plastic box that contains a push-button that is pressed through a nylon hemispherical cap that its comfortable in the hand of the subject.
This is very important because the subject has to stay for the whole fMRI experiment pressing the button, which may take up to 45 minutes. The Handy Switch is kept pressed by the weight of the hand which, during the fMRI experiments, is placed over the subject’s abdomen of the subject. This procedure does not interfere with the tasks that the subject must perform or keep in mind during the fMRI experiment protocol, as the volunteers do not need to pay attention to the action of pressing the button. In general, an fMRI study must engage subjects in a set of experimental tasks. These tasks aim to manipulate a particular cognitive, emotional, or social process while the corresponding brain activations are recorded by the fMRI scanner. Thus, any additional task, even a mechanical movement in combination with the begging of the stimulation, could interfere with the inal results. If, for any reason, pain or dizzy sensations are perceived, the relex of pulling the hand releases the push-button. Once the push-button is released, the wires that connect the patient to the stimulator are short circuited, avoiding that the electrical current reaches the subject.
Because no digital circuit is allowed within the MRI scanner, an LED bar graph with 10 LEDs was used to visualize the electrical current amplitude that is applied to the subject during the fMRI experiment.
The LEDs are switcheded on proportionally to the voltage drop in the shunt resistor, RS in Figure 4a. The currents induced in the wires by the MRI RF pulses and magnetic gradients are attenuated by the use of low-pass LC ilters shown in Figure 4b. Two of these ilters are placed along the wires that connect the Handy Switch to the electrodes. The cutoff frequency of the LC ilters is in the order of 50 Hz, well below the Larmor frequency, even for systems with magnetic ields as low as 0.5 T, which is about 21 MHz. To minimize the induced currents from the RF pulses and magnetic gradients, the wires that connect the Handy Switch to the electrodes are twisted from the abdomen until the neck, where they are separated to reach the electrodes that are placed on each side of the head. Grounded shielded cable is used to connect the stimulator and the Handy Switch. The autonomy of the GVS with 12 V-1.3 Ah batteries is about 8 hours.
Software interface
The parameters of the galvanic current are controlled by the user based on a software interface running in the notebook where the Signal Generator is connected. The waveform shape, namely, sine, square, triangular, sawtooth, and no signal; its duration “on” or “off” (deined in seconds from 1 to 60 s, or in MRI volumes, from 1 to 250), its amplitude (0.1 to 3 mA, in increments of 0.1 mA), and its frequency (0.1 to 10 Hz, in increments of 0.1 Hz) can all be conigured through the software interface.
GVS experiments on the MRI system
In order to verify the compatibility between the GVS and the MRI equipment several tests were conducted. A spherical phantom, with a diameter of 18 cm, Model 2152220, manufactured by General Electric (GE Healthcare, Waukesha, WI, USA) was used for such tests. Two silicone electrodes were ixed to the phantom surface in diametrically opposite directions, as it would be for an actual subject (placing them at the temporal bones) (Figure 5a). The phantom was positioned in a Philips Intera AchievaTM 3.0 T scanner (Philips Healthcare, Andover, MA, USA). Because the surface of this phantom is made with no conductive material, the electrodes were short-circuited with a carbon wire of 1 mm diameter. Test conditions were: (1) without the presence of the GVS in the scanner room, for a baseline control reference; (2) with the GVS inside the magnet room but switched off; (3) with the GVS switched on with the current low set to zero; (4) with the GVS switched on and a 5 Hz sinusoidal current low with 5 mA peak, automatically synchronized with the fMRI sequence. The synchronization was done using the reference fMRI 5V pulse sent by the MRI hardware at the beginning of every volume acquisition.
The stimulator was placed at the end of the scanner table (subject’s feet), Figure 5b, in the same position occupied during the experiments with the subjects. The acquisition parameters were: echo-planar imaging sequence (EPI), axial gradient echo, TR/TE = 2000/30 ms, lip angle = 90°, ield-of-view = 288 × 288 mm,
matrix = 80 × 80 voxels, slice thickness = 3 mm, 41 slices, SENSE 2.0. Three sessions, having one month of interval between them, were performed to assess the GVS repeatability. Assessment was performed both visually and quantitatively. Quantitative analysis used the to-noise ratio (SNR) and the signal-to-luctuation-noise ratio (SFNR) computed using the methods described by Friedman and Glover (2006).
Electrodes for the vestibular stimulation
The electrodes used to stimulate the vestibular system must be MRI compatible. Metal electrodes, even those that are not magnetic, cannot be used because they cause artifact in the MR images. The electrodes cannot be too small due to the transcutaneous electrical current density. Even though the pain thresholds do not scale directly with current intensity (Prausnitz, 1996) for higher electrical current values, the higher is the pain sensation. The electrodes cannot be too large, otherwise, they produce artifacts in the MRI images. The ideal size is to cover the mastoid process, located around the ear lobe.
Silicone rubber electrodes and Ag/AgCl (commercial) electrodes were tested to determine which one would elicit the strongest balance sensation with minimal pain sensation (heating or pinprick at the electrodes position). The Ag/AgCl electrode was the 3M Red DotTM model 2269T with carbon pins. The
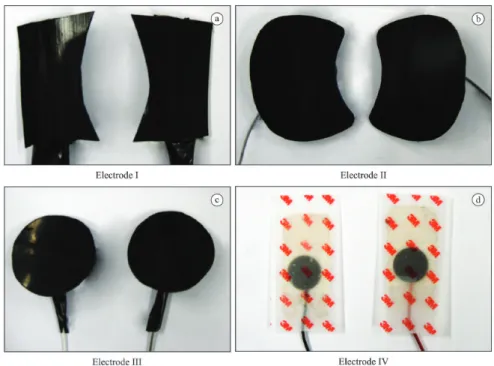
silicone rubber electrodes were made with conductive silicone-carbon ilm with a resistance of 300Ω per cm2. These silicone electrodes were cut in three different sizes and shapes, as shown in Figure 6. All evaluated electrodes were connected with carbon cables, which are transparent for the MRI magnetic ield.
Five male adult healthy volunteers, who do not have any history of vestibular or auditory disorders (age range: 22-30 years old) participated in this study. Participants signed an informed consent approved by the local Ethics Committee. Subjects were lying supine, and the electrodes were tested in a random sequence. The stimulation consisted of applying a sine wave current, with 1 and 2 Hz. The effects of galvanic stimulation can be quite variable, depending on the exact position of the electrodes, the body position (upright or supine), and the skin resistance. Therefore, we asked to the subjects to control the amplitude current. They were asked to increase the current intensity until the balance or the pain sensation was far too uncomfortable. At the end of each experiment, subjects were asked to provide a scale value for balance and pain sensation (zero for complete absence and 10 for maximum imaginable sensation). To quantify pain measurements, the subjects answered the McGill pain questionnaire for each experiment (Pimenta and Teixeira, 1996). Also, subjects answered three questions: (1) which electrode was considered more painful and which one was considered less painful;
Figure 6. The four different electrodes used to evaluate balance and pain sensations. The size and shape of the silicone electrodes varied.
(2) which electrode produced the strongest and the weakest balance sensation; and (3) which electrode was considered to be more uncomfortable. All these tests were performed outside the MRI environment.
Statistical effect size analyses (Conboy, 2003) were performed to indicate the most suitable electrode. A weighted mean analysis was performed based on Cohen’s d results. Five criteria were considered: (1) the current amplitude value in the beginning of balance (BB); (2) the current amplitude value in the beginning of pain (BP); (3) the current amplitude value for the maximum amplitude (MA); (4) the scale value for balance sensation (BS); and (5) the scale value for pain sensation (PS). BS and PS were multiplied by 5, BB and BP by 2, and MA by 1.
fMRI experiments
Participants: Eight nonsymptomatic healthy adult subjects (6 men and 2 women, ages ranging between 22 and 34 years old) with unknown neurological or psychiatric diseases took part in this study. Subjects were informed about the experiment and signed a written consent. Experiments were conducted with the approval of the local Ethics Committee. Scanning protocols: The images were acquired in a GE Signa HDxTM 1.5 T scanner (GE Healthcare, Waukesha, WI, USA). An EPI-BOLD (Blood Oxygen Level Dependent) sequence was used to produce 196 volumes, consisting of 31 axial slices (slice thickness: 4 mm, TR/TE: 2500/50 ms, lip angle: 90°, ield-of-view: 192 mm, imaging matrix: 64 × 64). Also, a set of high-resolution images, T1 weighted, was collected using a 3D gradient echo sequence (TR/TE: 9.0/3.0 ms, lip angle: 20°, imaging matrix: 256 × 256, ield-of-view: 240 mm, slice thickness: 1 mm3, 176 slices). Stimulus and experimental design: Circular silicone electrodes (Figure 6c) were placed over the mastoid processes of each subject. The local area was cleaned with alcohol 70% and a conductive gel solution was used in the electrodes. A cotton strip was irmly ixed around the head, holding the electrodes over the mastoid processes. The subjects lined supine in the scanner table. The Handy Switch
was kept on the abdomen with the right hand over it during the entire experiment. The synchronization between the GVS and the MRI system was set in the manual mode. The GVS applied a sinusoidal waveform electrical current of 1 Hz. The current amplitude was adjusted manually according to the volunteer’s pain and balance sensation (average value was 1.7 mA (RMS)). The protocol consisted of 19 blocks, starting and inishing with a resting period. The rest conditions (REST), without galvanic stimulation, were 30 s and the periods of stimulation (GVS) were 20 s. Subjects
were instructed to maintain their eyes closed during all the experiment. Image analysis: fMRI data were analyzed using the SPM8 software (http://www.il. ion.ucl.ac.uk/spm; Friston et al., 1995). The irst four
functional volumes were discarded to make sure that a steady-state signal was reached. All volumes were then aligned to the irst one of each scanning session, to correct for subject motion, and spatially normalized into the MNI (Montreal Neurological Institute) standard space. A spatial ilter of 8 mm was also applied to decrease noise. The general linear model was used for statistical evaluation. Activated clusters were obtained by thresholding the statistical maps at
p < 0.05 (with Family Wise Error (FWE) correction). Brain-activated regions were labeled using the SPM Anatomy Toolbox v1.8 (http://www2.fz-juelich.de/ inm/index.php?index=194; see Eickhoff et al., 2005, 2006b, 2007).
Results
Galvanic vestibular stimulator
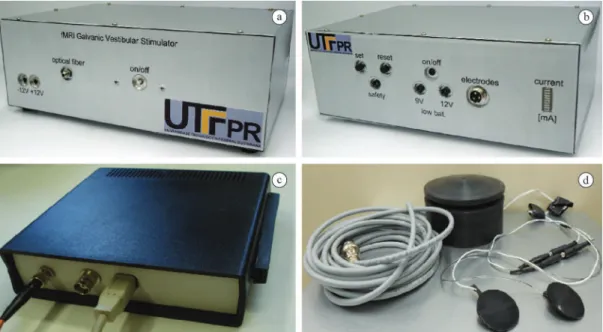
Figure 7a and b shows the front and the back panels of the GVS. The Signal Generator, the Handy Switch
and the circular silicone electrodes with the cables used to connect the GVS to the subject are shown in Figure 7c and d. All the stimulation parameters, such as: the current amplitude (0.1 to 5 mA), the signal frequency (0.1 to 10 Hz), the waveform shape (sine, square, triangular, sawtooth and no signal), are set using the notebook. The fMRI pulse sequences can be either automatically or manually synchronized with the electrical current pulses of the GVS.
GVS compatibility with the MRI system
Table 1 presents the results of GVS-MRI compatibility experiments. These results demonstrate that in all experiments where the GVS was placed in the MRI scanner room there was a slight SNR decrease (9.10% in average) and there was no great variability in SFNR (3.63% in average) when compared to baseline condition. Visual inspection of the images did not indicate noticeable image artifacts associated with the presence of the GVS in the scanner room. The second experiment session indicated that there was no effective signal decline despite regular moves and disconnect-reconnect cables during the tests performed outside the MRI system.
Electrodes evaluation
(PC = 30%) and BS (PC = –14%) criteria, respectively. BP showed a small increase (PC = 14%), MA a small decrease (PC = –6%) and PS a negligible change (PC = 1%). In Figure 8b the results of weighted mean, indicating the electrode III as the most eficient for 1 Hz stimulation (score = 0.40), are presented.
The McGill questionnaire results, used to qualify the electrodes, indicated that 60% of subjects found electrode III as the most comfortable (i.e., 40% said it produced the biggest balance sensation and 60% reported less pain sensation) and 40% of subjects described a stronger pain sensation and weaker balance sensation when using electrode I. The McGill Pain Questionnaire demonstrates that 67% of the subjects chose 10 descriptors of 20 subgroups, in which the sensorial and affective subgroups were the most frequently chosen. The scores obtained for the Pain Index (M = 10.17 ± 2.98) and the Number of Descriptors (M = 17.08 ± 6.04) had a moderate pain classiication.
fMRI data
The group analysis for the contrast GVS – REST showed signiicant activation over the precentral and postcentral gyri, in the central sulcus, in the supplementary motor area, in the middle and inferior frontal gyri, in the inferior parietal lobule, in the angular and the supramarginal gyri, in the insula, in the superior temporal gyrus, in the middle cingulate
cortex, in the cerebellum, in the putamen and in the thalamus (Figure 9).
Discussion
In this paper a galvanic vestibular stimulator specially developed for fMRI experiments is presented. The GVS-MRI compatibility tests showed small differences in SNR and SFNR signals. However, these results were on the same order as the differences between baseline conditions. The SFNRs were less than the
Figure 7. The Galvanic Vestibular Stimulator system. (a) The front panel with the inputs for the batteries charger (–12 V and +12 V), the
optical iber connection and the on/off switch. (b) The back panel with the Safety circuit status, the batteries status, the electrodes connector and the LED bar that indicates the current applied to the subject. (c) The Signal Generator unit. (d) The cable used to connect the stimulator to subjects, the Handy Switch that is placed in subject’s right hand and the circular silicone electrodes.
Table 1. Results of phantom image quality metrics for GVS-MRI compatibility experiments in three test sessions.
Test
Session Condition SNR SFNR
1
Baseline 249.80 231.10
Inside Off 252.30 220.85
Inside On-Without current 249.17 219.70 Inside On-With current 227.07 222.70
2
Baseline 240.90 228.40
Inside Off 233.50 224.90
Inside On-Without current 227.20 219.30 Inside On-With current 236.90 222.60
3
Baseline 260.30 224.70
Inside Off 214.10 226.70
spatial variation over the region-of-interest (ROI), indicating a normal variability. These results show that the GVS does not have a noticeable impact on image quality. Also, the GVS functionality was not affected by the MRI RF pulses and magnetic gradients due to the 10 mm thickness aluminum shielded box and the shield cables used inside the scanner room. Also, the low-pass ilters blocked the electrical current induced by the MRI system. The GVS did not interfere with the MRI scanner, demonstrating its full compatibility with the fMRI experiments. The
GVS synchronization’s trigger was able to follow the fMRI stimulation protocol.
The comparison between 1 and 2 Hz galvanic stimulation frequencies indicates that the current amplitude in begging of balance and begging of pain criteria increased for 2 Hz. However, despite subjects tolerating higher current amplitude for 2 Hz, the stronger balance sensation and the least pain sensation were reported during 1 Hz (Figure 8a). Thus, when considering the weighted mean analysis, the 1 Hz stimulation frequency was more eficient for
Figure 8. Results of the effect size analysis for 1 and 2 Hz stimulation frequencies in relation to the global mean. (a) The biggest and the smallest percentual changes occurred during BB and BS criteria, respectively. (b) The weighted mean indicates the circular silicone electrode (3) as the most relevant for 1 Hz stimulation frequency. BB – Beginning of Balance; BP – Beginning of Pain; MA – Maximum Amplitude; BS – Balance Sensation scale; PS – Pain Sensation scale.
electrode III (Figure 8b). Moreover, 60% of subjects indicated electrode III as the most comfortable. For all these evidences, the 1 Hz stimulation frequency and electrode III were chosen to perform the fMRI experiments.
The McGill Pain Questionnaire suggests a moderate pain sensation for the galvanic vestibular stimulation. Nevertheless, for fMRI experiments, the pain sensation can be avoided by reducing the current intensity to a level that there is only the balance sensation. This adjustment was done by the subjects themselves before the beginning of each fMRI experiments.
The fMRI results showed activity in sensitive and motor areas, as the post and precentral gyrus, that could be related to vestibular projections to area 3a described in animals (Lobel et al., 1998). Another region that showed activity was the inferior parietal lobule; this area belongs to the inner vestibular circuit described by Guldin and Grüsser (1998). The area known as the parietoinsular vestibular cortex (PIVC) is considered a multisensory region, the neurons in this area respond not only to vestibular but also to various kinds of visual and somatosensory stimulations (Bucher et al., 1998). These preliminary results showed signiicant activation over the major areas involved with multimodal functions of the vestibular system (Bense et al., 2001) and are in agreement with previous galvanic vestibular stimulation studies with fMRI (Eickhoff et al., 2006a; Fink et al., 2003; Smith et al., 2012; Stephan et al., 2005). Also, the results showed here corroborate with a meta-analysis study that evaluate the statistical analysis of the localization of the human vestibular cortex in neuroimaging studies using caloric vestibular stimulation, galvanic vestibular stimulation and auditory stimulus (Lopez et al., 2012). Previous studies employed a galvanic stimulator in fMRI experiments (Bucher et al., 1998; Bense et al., 2001; Eickhoff et al., 2006a; Fink et al., 2003; Lobel et al., 1998; Smith et al., 2012; Stephan et al., 2005). However, none of them described the speciic electronics circuits that make it compatible with the MRI system. Therefore, the main contribution of this paper is the description of a galvanic stimulator that can be safely used inside the MRI scanner room.
The GVS developed could successfully activate the major areas involved with multimodal functions of the vestibular system, demonstrating its validity as a stimulator for neurovestibular research. To the best of our knowledge, this is the irst publication that describes and demonstrates the development and the construction of a galvanic vestibular stimulator that can be safely used inside the MRI room.
Acknowledgments
We thank Paulo Henrique de Oliveira and Albrecht Zwick for their help in the development and construction of the irst version of the GVS. Our sincerely thank to Ricardo R. Ferreira for allowing the access to the MRI equipment for fMRI data collection in the Centro Diagnóstico Água Verde, Curitiba, PR, Brazil. We also thank Arthur Felipe Borgonovi for technical support during GVS-MRI compatibility tests. This work was supported by CAPES – Coordenação de Aperfeiçoamente de Pessoal de Nível Superior – and CNPq – Conselho Nacional de Desenvolvimento Cientíico e Tecnológico, Brazil.
References
Bense S, Stephan T, Yousry TA, Brandt T, Dieterich M. Multisensory cortical signal increases and decreases during vestibular galvanic stimulation (fMRI). Journal of Neurophysiology. 2001; 85(2):886-99. PMid:11160520.
Bucher SF, Dieterich M, Wiesmann M, Weiss A, Zink R, Yousry TA, Brandt T. Cerebral functional magnetic resonance imaging of vestibular, auditory, and nociceptive areas during galvanic stimulation. Annals of Neurology. 1998; 44:120-5. PMid:9667599. http://dx.doi.org/10.1002/ana.410440118
Conboy JE. Algumas medidas típicas univariadas da magnitude do efeito. Análise Psicológica. 2003; 2:145-58.
Day BL. Galvanic vestibular stimulation: new uses for an old tool. Journal of Physiology. 1999; 517(3):631. PMid:10358104 PMCid:PMC2269367. http://dx.doi. org/10.1111/j.1469-7793.1999.0631s.x
Dilda V, MacDougall HG, Moore ST. Tolerance to extended galvanic vestibular stimulation: optimal exposure for astronaut training. Aviation, Space, and Environmental Medicine. 2011; 82(8):770-4. http://dx.doi.org/10.3357/ ASEM.3051.2011
Eickhoff SB, Stephan K, Mohlberg H, Grefkes C, Fink G, Amunts K, Zilles K. A new SPM toolbox for combining probabilistic cytoarchitectonic maps and functional imaging data. Neuroimage. 2005; 25(4):1325-35. PMid:15850749. http://dx.doi.org/10.1016/j.neuroimage.2004.12.034
Eickhoff SB, Weiss PH, Amunts K, Fink GR, Zilles K. Identifying human parieto-insular vestibular cortex using fMRI and cytoarchitectonic mapping. Human Brain Mapping. 2006a; 27(7):611-21. PMid:16281284. http:// dx.doi.org/10.1002/hbm.20205
Eickhoff SB, Heim S, Zilles K, Amunts K. Testing
anatomically speciied hypotheses in functional imaging
using cytoarchitectonic maps. Neuroimage. 2006b; 32:570-82. PMid:16781166. http://dx.doi.org/10.1016/j. neuroimage.2006.04.204
2007; 36:511-21. PMid:17499520. http://dx.doi.org/10.1016/j. neuroimage.2007.03.060
Fink GR, Marshall JC, Weiss PH, Stephan T, Grefkes C, Shah NJ, Zilles K, Dieterich M. Performing allocentric visuospatial judgments with induced distortion of the egocentric reference frame: an fMRI study with clinical implications. Neuroimage. 2003; 20(3):1505-17. PMid:14642463. http://dx.doi. org/10.1016/j.neuroimage.2003.07.006
Fitzpatrick RC, Wardman DL, Taylor JL. Effects of galvanic vestibular stimulation during human walking. Journal of Physiology. 1999; 517(3):931-9. PMid:10358131 PMCid:PMC2269389. http://dx.doi.org/10.1111/j.1469-7793.1999.0931s.x
Friedman L, Glover GH. Report on a multicenter fMRI quality assurance protocol. Journal of Magnetic Resonance Imaging. 2006; 23(6):827-39. PMid:16649196. http://dx.doi. org/10.1002/jmri.20583
Friston KJ, Holmes AP, Worsley KJ, Poline JP, Frith CD, Frackowiak RSJ. Statistical parametric maps in functional imaging: a general linear approach. Human Brain Mapping. 1995; 2:189-210. http://dx.doi.org/10.1002/hbm.460020402
Guldin WO, Grüsser OJ. Is there a vestibular cortex? Trends in Neurosciences. 1998; 21:254-9. http://dx.doi.org/10.1016/ S0166-2236(97)01211-3
Latt L, Sparto PJ, Furman JM, Redfern MS. The steady-state postural response to continuous sinusoidal galvanic vestibular stimulation. Gait & Posture. 2003; 18(2):64-72. http://dx.doi.org/10.1016/S0966-6362(02)00195-9
Lobel E, Kleine JF, Le Bihan D, Leroy-Willig A, Berthoz A. Functional MRI of galvanic vestibular stimulation. Journal of Neurophysiology. 1998; 80:2699-709. PMid:9819274.
Lopez C, Blanke O, Mast FW. The human vestibular cortex revealed by coordinate-based activation likelihood estimation meta-analysis. Neuroscience. 2012; 212:159-79. PMid:22516007. http://dx.doi.org/10.1016/j. neuroscience.2012.03.028
MacDougall HG, Brizuela E, Burgess M, Curthoys IS, Halmagyi GM. Patient and normal three-dimensional eye-movement responses to maintained (DC) surface galvanic vestibular stimulation. Otology & Neurotology. 2005; 26(3):500-11. http://dx.doi.org/10.1097/01. mao.0000169766.08421.ef
MacDougall HG, Moore ST, Curthoys IS, Black FO. Modeling postural instability with galvanic vestibular stimulation. Experimental Brain Research. 2006; 172(2):208-20. PMid:16432695. http://dx.doi.org/10.1007/s00221-005-0329-y
Moore ST, MacDougall HG, Peters BT, Bloomberg JJ, Curthoys IS, Cohen HS. Modeling locomotor dysfunction
following spacelight with galvanic vestibular stimulation.
Experimental Brain Research. 2006; 174:647-59. PMid:16763834. http://dx.doi.org/10.1007/s00221-006-0528-1
Moore ST, Dilda V, MacDougall HG. Galvanic vestibular stimulation as an analogue of spatial disorientation
after spacelight. Aviation, Space, and Environmental
Medicine. 2011; 82(5):535-42. http://dx.doi.org/10.3357/ ASEM.2942.2011
Pease RA. A comprehensive study of the Howland current pump. Texas Instruments [internet]. 2008 Jan. Available from: http://www.ti.com/analog/docs/litabsmultipleilelist. tsp?literatureNumber=snoa474&docCategoryId=1&famil yId=2129.
Pimenta CAM, Teixeira MJ. Questionário de dor McGill: proporsta de adaptação para a língua portugesa. Revista da Escola de Enfermagem USP. 1996; 30:473-83. PMid:9016160.
Pouliquen P, Vogelstein J, Etienne-Cummings R. Practical considerations for the use of a Howland current source for neuro-stimulation. In: IEEE Biomedical Circuits and Systems Conference: Proceedings of the IEEE Biomedical Circuits and Systems Conference; 2008 Nov 20-22; Baltimore. New York: IEEE; 2008. http://dx.doi.org/10.1109/ BIOCAS.2008.4696867
Prausnitz MR.The effects of electric current applied to skin: a review for transdermal drug delivery. Advanced Drug Delivery Reviews. 1996; 18:395-425. http://dx.doi. org/10.1016/0169-409X(95)00081-H
Pylarinos L. Charge pumps: an overview. In: ISCAS ‘03: Proceedings of the IEEE International Symposium on Circuits and Systems; 2003 May 25-28; Bangkok. IEEE; 2003. http://dx.doi.org/10.1.1.128.4085
Smith AT, Wall MB, Thilo KV. Vestibular inputs to human motion-sensitive visual cortex. Cerebral Cortex. 2012; 22:1068-77. PMid:21743097. http://dx.doi.org/10.1093/ cercor/bhr179
Sooksood K, Stieglitz T, Ortmanns M. An active approach for charge balancing in functional electrical stimulation. IEEE Transactions on Biomedical Circuits and Systems. 2010; 4(3):162-70. PMid:23853340. http://dx.doi.org/10.1109/ TBCAS.2010.2040277
Stephan T, Deutschlander A, Nolte A, Schneider E, Wiesmann M, Brandt T, Dieterich M. Functional MRI of galvanic vestibular stimulation with alternating currents at different frequencies. Neuroimage. 2005; 26(3):721-32. PMid:15955481. http://dx.doi.org/10.1016/j. neuroimage.2005.02.049
Tucker AS, Fox RM, Sadleir RJ. Biocompatible, high precision, wideband, improved howland current source with Lead-lag compensation. IEEE Transactions on Biomedical Circuits and Systems. 2013; 7(1):63-70. PMid:23853280. http://dx.doi.org/10.1109/TBCAS.2012.2199114
Authors
Hellen Mathei Della-Justina*, Tiago Manczak, Mauren Abreu de Souza, Humberto Remigio Gamba
Graduate School of Electrical Engineering & Computer Science, Federal University of Technology - Paraná – UTFPR, Av. Sete de setembro, 3165, CEP 80230-901, Curitiba, PR, Brazil.
Anderson Marcelo Winkler
Department of Psychiatry, Yale University School of Medicine, New Haven, CT, USA
The Oxford Centre for Functional MRI of the Brain – FMRIB, John Radcliffe Hospital, University of Oxford, Oxford, UK.
Dráulio Barros de Araújo
Brain Institute, Federal University of Rio Grande do Norte – UFRN, Natal, RN, Brazil.
Edson Amaro Junior