*e-mail: [email protected], [email protected]
Fatigue Analysis of Aluminum Drill Pipes
João Carlos Ribeiro Plácidoa*,Paulo Emílio Valadão de Mirandab,Theodoro Antoun Nettoc,
Ilson Paranhos Pasqualinoc*, Guilherme Farias Miscowb, Bianca de Carvalho Pinheiroc
a
PETROBRAS/CENPES/PDP/TEP, Cidade Universitária, Quadra 7,
21949-900 Rio de Janeiro - RJ, Brazil
b
COPPE/UFRJ, Metallurgical Engineering Dept.,
Centro de Tecnologia,
Cidade Universitária,
PO Box 68505,
21949-900 Rio de Janeiro - RJ, Brazil
c
COPPE/UFRJ, Ocean Engineering Dept.,
Centro de Tecnologia,
Cidade Universitária,
PO Box 68508, 21949-900
Rio de Janeiro - RJ, Brazil
Received: July 19, 2004; Revised: October 20, 2005
An experimental program was performed to investigate the fundamental fatigue mechanisms of aluminum drill pipes. Initially, the fatigue properties were determined through small-scale tests performed in an optic-mechanical fatigue apparatus. Additionally, full-scale fatigue tests were carried out with three aluminum drill pipe specimens under combined loading of cyclic bending and constant axial tension. Finally, a finite element model was developed to simulate the stress field along the aluminum drill pipe during the fatigue tests and to estimate the stress concentration factors inside the tool joints. By this way, it was possible to estimate the stress values in regions not monitored during the fatigue tests.
Keywords: fatigue, aluminum drill pipes, stress concentration factors
1. Introduction
A critical factor while drilling extended reach wells is the weight of the drill string used in the high inclination angle section of the well. One solution is the use of drill pipes made of alternative ma-terials lighter than the conventional steel drill pipes. Some options are titanium and aluminum. Titanium is avoided due to its high cost. Recently, Russia has been manufacturing drill pipes using aluminum alloys of the system Al-Cu-Mg, similar to alloys 2024, used in air-planes. These pipes present a reasonable commercial cost.
Initially, it is important to understand the drill pipe fatigue mechanism. This damage occurs under cyclic loading conditions due to, for instance, rotation in curved sections of the well. Fatigue is caused by crack nucleation and propagation and is considered the main reason of failures in drill string. Usually, failure mechanisms are developed in the transition region of the tool joint (named upset). Several mechanical and metallurgical factors affect the fatigue life of drill pipes. The former are mainly geometric discontinuities such as upset region, corrosion pits and slip marks. The latter are related to the size and distribution of crystalline grains, phases and second phase particles (inclusions).
Extended reach wells are problematic once the weight of the drill string may overpass the design limits due to increasing of the axial loads while picking up or decreasing while slacking off. The solution is the use of alternative drill pipe materials with lower density but good mechanical resistance. Two options are titanium and aluminum alloys. Due to the high cost of the first one, it was decided to test only drill pipes made of aluminum alloy.
The aim of the study is to analyze the fatigue behavior of alumi-num drill pipes under combined loading of bending and tension and the fatigue properties of its aluminum alloy. The experimental work comprised small-scale tests performed in an optic-mechanical fatigue apparatus in order to determine the material S-N diagram. Uniaxial tensile tests were also carried out to obtain the aluminum mechani-cal properties. The fatigue performance of the aluminum drill pipes was obtained through full-scale fatigue tests of three specimens. In
a numerical study, a finite element model was developed to obtain the stress concentration factors in the drill pipes.
2. Experimental Procedures
2.1. Small-scale experiments
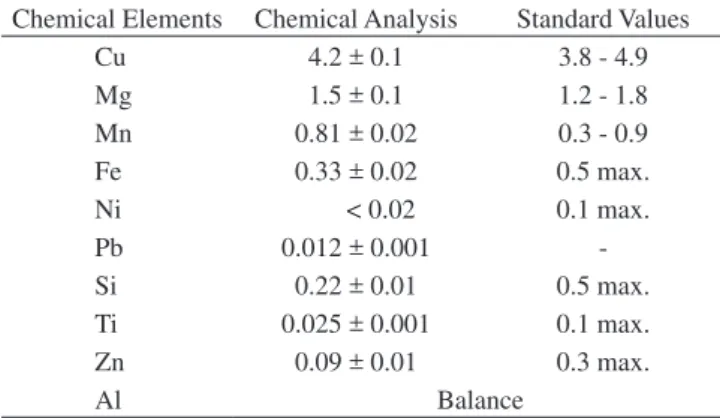
The material studied was the D16T aluminum alloy, from the Russian standard GOST 4784, which is similar to the 2024 – T4 ASTM designation. It’s an Al-Cu-Mg system naturally aged alloy, with chemical composition presented in Table 1. Its mechanical properties are summarized in Table 2.
Based on the mechanical properties, fatigue tests were pro-grammed and performed in order to obtain the S–N diagram for the material. The tests were conducted using an optic-mechanical system specially developed for this purpose1, with stress ratio R = -1 (fully reversed stress). The number of cycles was determined from the beginning of test until fracture or after 107 cycles (run-out). When two consecutive samples did not fail over 107 cycles, the fatigue limit was determined. The sample (Figure 1) preparation was the usual grinding and polishing procedure until a mirrored surface, with no etching, was obtained.
In order to characterize the materials ability to absorb plastic deformation when subjected to fatigue efforts, samples were analyzed under differential interference contrast during fatigue tests.
Samples had their fracture surface observed using scanning electron microscope (SEM) to identify fatigue crack initiation sites, crack propagation regions and the domains of final fracture by over-loading domains.
2.2. Full-scale experiments
trans-verse load frame assembly equipped with a hydraulic actuator, one hydraulic actuator for tensioning and two end support assemblies provided with axial and radial bearings. The rig is also equipped with one driving mechanism to rotate the specimen (electrical mo-tor, timing belt, and pulleys), assorted instrumentation (load cells, LVDT’s, pressure transducers etc), and a digital data acquisition and closed-loop control system.
The mechanism principle is similar to the well-known small-scale rotating bending test3. The drill pipe specimen is assembled such that the tool joint is located in its central region and positioned in the fatigue rig to simulate a simply supported beam. A transverse load is applied over the tool joint, at a point coincident with the pipe mid-section. This load produces a bending moment, with a maximum value at the loading point and a linear decays towards the supported ends. As the pipe rotates, metal fibers are submitted to cyclic stress, thus causing metal fatigue. Mean stress is simulated with the aid of a hydraulic actuator, which apply axial tension on one end, while the other is axially constrained.
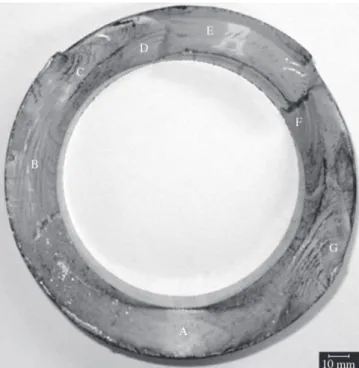
Three specimens (named DPA01, DPA02, and DPA03) were fabricated from three aluminum drill pipes with threaded ends that are connected to each other by a steel tool joint. The nominal dimensions of the drill pipe specimens are schematically shown in Figure 24. The pipes have an internal diameter of 104.9 mm and thickness vary-ing linearly from 21 mm (adjacent to the tool joint) to 13 mm (at a distance of approximately 1200 mm from the tool joint). The pieces were threaded to each other to form a specimen of total length equal to 5.2 m following the manufacturer specifications (maximum torque of 22000 N.m, applied manually). Figure 3 shows the tool joint region of one of the specimens.
Prior to each experiment, the dimensions of the test specimens were measured at different sections. The diameters (D) were measured
20
90
12.5
25 a = 40
25 6 6 18 30 7
Figure 1. Fatigue sample dimensions in millimeters. Thickness: 3.5 mm. Table 1. D16T alloy chemical composition in weight percent.
Chemical Elements Chemical Analysis Standard Values
Cu 4.2 ± 0.1 3.8 - 4.9
Mg 1.5 ± 0.1 1.2 - 1.8
Mn 0.81 ± 0.02 0.3 - 0.9
Fe 0.33 ± 0.02 0.5 max.
Ni < 0.02 0.1 max.
Pb 0.012 ± 0.001
-Si 0.22 ± 0.01 0.5 max.
Ti 0.025 ± 0.001 0.1 max.
Zn 0.09 ± 0.01 0.3 max.
Al Balance
Table 2. Mechanical properties of D16T alloy.
Mechanical Property Experimental Value
Reference Value
Yield Strength (MPa) 447 330 min.
325 min. Ultimate Tensile Strength (MPa) 564 450 min. 460 min. Elongation for l0 = 36 mm (%) 10.5 ± 0.4 11% min.
12% min.
Reduction of Area (%) 5.5
-Brinell Hardness 144 120
M
od
eled
Reg
ion
~ 1200 [4’]*
3-133 (NC50
API 7)
ГОС
Т
P 50864-96
D = 95* [3.74”] 130.8 [5.150”]* A=147 [5.787”]* C=172 [6.772”]* B=104.8* G=13 [0.51”] 3 TT 138 x 5. 08 x 1:32 ГОС Т 5286-75 2
~ 1200 [~4’]*
k = 305 [12.01]
1 3-133 (NC-50 API 7) ГОС Т P 50864-96 H=21 [0.83”] M=186 [7.32”] TT 138 x 5.08 x 1:32 ГОС Т 5286-75
L = 9
2 1 0 [30 -10.5 ]
+ 150 - 300 + 6 - 12
147 [5.787”]*
Figure 2. Sketch showing drill pipe nominal dimensions.
were measured, totaling forty thickness measurements at each cross section. The measured sections are shown in Figure 4. The sections on the pin side of the steel connector are called M1 to M20 while the others on the box side are called F1 to F19. The dimensional scattering with respect to the nominal values was found to be very small (usually less than 6% and 0.5% for external diameters and thicknesses, respectively).
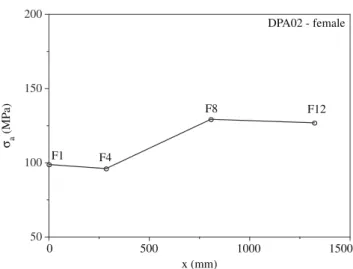
After assembled in the apparatus and before the fatigue test, four longitudinal strain gages are mounted at different sections of both sides (namely M1, M4, M8, M12, F1, F4, F8, and F12) (Figure 4). The selected loads for the desired stress range and mean stress are then applied to the specimen, which is subsequently rotated as in the actual fatigue test, but to a limited number of cycles. The strains are recorded and the data is later processed in order to obtain the actual stresses acting on the specimen. If necessary, then, the loads initially applied are corrected to match the desired test load parameters. A typical set of data from this preliminary load test is shown in Figures 5 and 6 (specimen DPA02). Because the bending moment and the inertia vary along the length of the specimens, different stress amplitudes are recorded among the sections. We opted to consistently prescribe the stresses at section M1, while recording the resulting stresses at
25.4 130130 2495.4
130130 25.4
F1F2 F3 F4 F18 F19 M4M3M2M1
M19 M20
2365.4
Figure 4. Measuring sections and strain gages mounting scheme.
Table 3. Full-scale test nominal loadings.
sm (MPa) sa (MPa) sa c
(MPa)
DPA01 25.0 125.0 132.0
DPA02 25.0 100.0 106.0
DPA03 25.0 70.0 74.0
Figure 3. Tool joint region of DPA02 specimen.
Figure 6. Typical set of data from a preliminary load test for DPA02 (box section).
a
(MP
a)
0 500 1000 1500
DPA02 - female
x (mm)
F1 F4
F8 F12
200
150
100
50
Figure 5. Typical set of data from a preliminary load test for DPA02 (pin section).
x (mm)
a
(MP
a)
0 500 1000 1500
DPA02 - male
M12 M8
M4 M1 200
150
100
50
the other cross sections.
For the first specimen tested (DPA01), were prescribed stress amplitude (sa) of 125 MPa and mean stress (sm) of 25 MPa. These values were selected in view of the results from the small-scale tests. The subsequent tests were designed based on the results from the previous full-scale tests, as it will be described in the next section. The prescribed values for each specimen are given in Table 3. In the last column the stress amplitudes are corrected to account for the effect of the mean stress using the Soderberg (Equation 1) with a yield stress (so) equal to 447 MPa.
All of the tests were carried out until detection of a through crack by internally pressurizing the specimen up to a pressure of 30 psi. Since a sudden loss of pressure would indicate presence of material cracking, the pressure was constantly monitored by an electronic pressure transducer linked to the data acquisition and control system. In the first sign of decrease in pressure, the experiment was automati-cally shutdown for further inspection of the leak.
Although the hydraulic system was designed to keep the trans-verse and axial forces constant along the test, small fluctuations (maximum of 5%) due to pipe sweep were observed during the ex-periments. To account for this effect, the stresses reported in the next section were calculated based on the preliminary load tests, but using the force-weighted averages obtained in each fatigue test.
1
a a
c
o m
v v
v v
= d - n (1)
2.3. Test results
The monitoring of a fatigue test analyzed by differential interfer-ence contrast (Figure 8) shows that the material’s ability to absorb surface plastic deformation is low. The crack propagation direction is poorly defined, with intense secondary cracking. The lack of surface slip bands was also noted.
The SEM analyses for the fractured surfaces by fatigue are pre-sented in Figures 9 and 10. It is observed that the fractured surface changes dramatically upon decreasing the applied stress. An extensive overloading area is shown in Figure 9, where can be verified: the specimen superior border (A), lateral border (B), overloading areas (C and D), overloading area (E) parallel to C, the trace (F) of virtual encounter of the planes C and D, and the interrupted overloading crack front (G). A smaller overloading area is observed in Figure 10, where can be verified: crack initiation site (A), crack propagation site (B) and four overloading areas C, D, E and F, being C and E parallel between them, just as D and F.
Figure 11 shows a visual inspection of fractured surface of pipe DPA01. Several crack initiation sites, propagation regions and over-loading areas were identified. The probable main crack propagated over area A. The B, C and D points are probable secondary crack initiation sites with propagation regions represented by E, F and G with final
fracture due to overloading identified by H, I and J, respectively. In L and M there are crushing evidences of the fractured surface, being probably the last two points of contact before surfaces separation. There were probably two predominant cracks, one in the higher portion and other in the lower portion. Once they reach a critical size the fracture suddenly took place by overloading in J and crushing in L and M.
Figure 12 shows a visual inspection of fractured surface of pipe DPA03. Crack initiation site with consequent propagation is
Micron Micron
500
500
A
B
C D
F G E
Figure 9. Fractured surface of a specimen tested at 274 MPa. Original mag-nification: 31X.
Micron Micron
500
500
A
B
C D
E
F
Figure 10. Fractured surface of a specimen tested at 213 MPa. Original magnification: 33X.
Figure 8. Fatigue surface analysis by differential interference contrast. Diffuse crack propagation is observed, with an intense secondary cracking. Original magnification: 50X.
103 104 105 106 107
0
50 100 150 200 250 300 350 400
a
(MP
a)
Number of Cycles
S - N diagram for D16T alloy small scale results full scale results
Figure 11. Visual inspection of drill pipe DPA01.
Figure 12. Visual inspection of drill pipe DPA03.
Figure 13. Lateral view of the model.
Figure 14. Threaded surface of the aluminum drill pipe.
identified in A. Other crack initiation site with beach marks due to overloading cycles can be identified in B. C and D represent other two crack initiation sites that meet each other. An overloading area is represented in E, with crack initiated in D and F. Point G is another crack initiation site with beach marks indicating propagation path with overloading marks.
3. Numerical Analysis
3.1. Numerical model
The framework ABAQUS, release 6.3.55, was employed to develop a nonlinear three-dimensional finite element model that simulates the load level reached in the experimental tests. The model incorporates large rotations and simulates the contact loading over the threaded surfaces at ends and the applied bending and tension loads. The model comprises one portion of the aluminum drill pipe inside the steel connector plus some sufficient length necessary to suppress the edge effects. The pin side of the steel connector is also modeled. The Figure 2 shows the modeled region.
The numerical analysis provides the stress distribution along the drill pipe. Once the stress distribution have been obtained, it was possible to determine the stress concentration factors on the threaded surface inside the tool joint. From the stress concentration factors, it can be estimated the stress levels in regions not monitored prior to the fatigue tests.
The model was simplified through symmetry conditions, reducing its geometry to half cross section of the aluminum drill pipe and the steel connector. Figure 13 shows a lateral view of the model and Figure 14 shows the detail of the threaded surface of the aluminum drill pipe.
3.2. Finite element mesh
The finite element mesh was generated using three-dimensional 8-noded solid elements C3D8 with three degree of freedoms per node (translations in the directions 1, 2 and 3). The plane 1-2 was assumed as symmetry plane, simplifying the model mesh to half of the geometry.
The model mesh was composed of 18608 elements, being more refined around the connection region and presenting a coarser mesh at crescent distances from the connector to reduce the CPU time of the analysis. Figure 15 shows the model mesh, while Figure 16 shows a detail of the mesh in the connection region.
3.3 Model properties and loading
were defined with an elasticity modulus of 70000 and 210000 MPa, respectively, and a Poisson coefficient of 0.3.
The model simulates the contact loading over the threaded sur-faces by defining contact sursur-faces between the aluminum drill pipe and the steel connector. The loading consists of a transversal load applied on the edge of the steel connector and an axial load applied on the other edge, which is opposite to the region of the thread. The transversal forces simulate the different stress amplitudes reached by the cyclic bending loadings of the fatigue tests, while the nominal axial force of 22 tones simulates the mean stress.
3.4. Numerical results
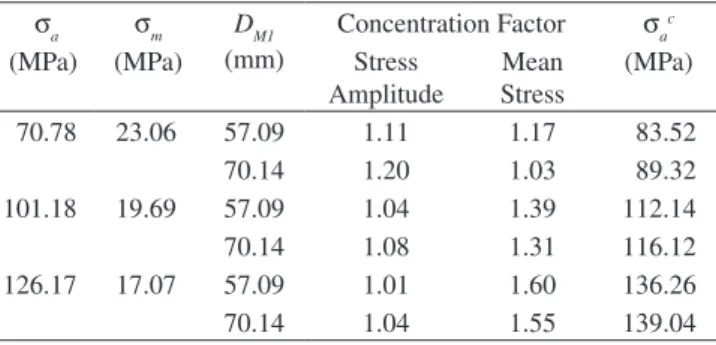
Table 4 shows the numerical results of longitudinal stresses ob-tained at the point M1. The applied transversal loading was calibrated to result in stress amplitudes (sa) close to the nominal values of 70, 100 and 125 MPa. The mean stresses (sm) decreased in relation to the nominal value of 25 MPa with the increase of the transversal loads. It happened because the applied axial force is the same for the three amplitudes of side load.
The highest stress concentration factors were observed on the treaded surface at distances DM1 from the point M1. Table 4 shows these concentration factors for the stress amplitudes and the mean stresses. Applying these concentration factors to sa and sm and using Equation 1, it was possible to estimate the corrected stress amplitudes at the critical points inside the connector. The correction of the stress amplitudes varied from 26% for the lowest transversal load to 10% for the highest one.
Table 4. Results of the numerical analyses.
sa sm DM1 Concentration Factor sa c
(MPa) (MPa) (mm) Stress Amplitude
Mean Stress
(MPa)
70.78 23.06 57.09 1.11 1.17 83.52
70.14 1.20 1.03 89.32
101.18 19.69 57.09 1.04 1.39 112.14
70.14 1.08 1.31 116.12
126.17 17.07 57.09 1.01 1.60 136.26
70.14 1.04 1.55 139.04
Figure 15. Finite element mesh.
2
1 3
Figure 16. Detail of the mesh in the region of connection.
4. Discussion
The fatigue properties are in accordance with those expected by the tensile mechanical properties. There is no asymptotic fatigue limit, which is reasonable for an aluminum alloy. An interesting point is that the S–N diagram presents a well-defined change in its behavior. For higher stresses, the fatigue life is drastically reduced with the increase of the loading. For lower stresses these effect is reduced. There is a point in the diagram, at a stress range of 180 MPa, which is defined here as the transition behavior stress.
An analysis of the mechanical properties can be done from the fa-tigue surface analysis by differential interference contrast. Secondary cracking, observed in Figure 8, shows that the materials present lack of ability to absorb plastic deformation. Instead of nucleating surface slip bands, intrusions and extrusions, cracking takes place, dissipat-ing energy when new surfaces were created. The multiple crackdissipat-ing also takes place, but proceeded by accumulative slipping6. The crack diffuse path is another indication of the high mechanical resistance of the material. For ductile, low strength alloys, a fatigue crack path assumes perpendicular directions when it has reached the unstable crack propagation size (stage II crack growth). As it was shown in Figure 8, the crack deviates from its path because it encounters a pos-sible metallurgical defect such as an inclusion, like an oxide, which arrests its propagation, forcing the crack to follow another direction. This behavior can be benefic for fatigue, since cracking arrest and deflection decreases the fatigue crack growth rate7.
The type of the fracture surfaces is as a function of the applied stress range. For higher stress values (Figure 9), the fractured surface has mainly overloading areas; with apparently little crack propagation regions. With the reduction of the stresses (Figure 10), the fracture surface results in larger propagation regions, with limited overloading areas. For stress values below 180 MPa, crack propagation regions are dominant, with small overloading areas.
Visual inspection of DPA03 makes it clear that after initiating the main crack in point A, with the reduction of the cross section due to crack propagation, the beach marks at points B and G become more spaced. The resistant cross section is also reduced in regions C, D and F. It seems that the radial marks at points C and G are a result of overloading cycles just prior to fracture, since these marks are widely spaced, and points C and G are almost in opposite sides.
The corrected stress amplitudes obtained from the numerical analyses (Table 4) did not result in a significance change as compared to those of Table 3. The difference between the small and full-scale tests in the S-N diagram of Figure 7 is explained by the nature of the fatigue tests accomplished. The small-scale fatigue tests employed thin samples under an approximate plane stress state. This situation is not reproduced to the full-scale test, where the stress state in the crack initiation sites is three-dimensional.
5. Conclusion
A material with high mechanical resistance combined with low ductility decreases its ability to absorb surface plastic deformation during fatigue.
Major overloading crack in fracture surfaces for higher stresses proves that the increase of the stress range (over 180 MPa) reduces dramatically the fatigue life of the material.
The fatigue fracture in the specimens DPA02 and DPA03 took place in the threaded end, because this region proved to concentrate stress in relation to the rest of the pipe. The numerical model showed a moderate concentration of stresses in the treaded end, which explains the preferred failure initiation mechanism fatigue in this region.
The difference between the fatigue lives of the small-scale and full-scale specimens is explained by the nature of the fatigue tests accomplished. The small-scale fatigue tests employed thin samples under an approximate plane stress state, while the stress state in the crack initiation sites is three-dimensional in the full-scale test.
Acknowledgments
The authors would like to thank the financial support of PETRO-BRAS and FINEP.
References
1. Miscow GF, Miranda PEV. Utilização de contraste por interferência
difer-encial na identificação de bandas de deslizamento produzidas por fadiga. Proceedings of the CONAMET/SAM - SIMPOSIO MATÉRIA; 2002 Nov 12-15; Santiago, Chile. Santiago: Universidad de Chile; 2002.
2. Miscow GF, Miranda PEV, Netto TA, Plácido JCR. Techniques to char-acterize fatigue behaviour of full size drill pipes and small scale samples. International Journal of Fatigue. 2004; 26(6):575-584.
3. Barsom JM, Rolfe ST. Fracture and fatigue control in structures: Applica-tions of fracture mechanics. 2nd ed. New Jersey: Prentice-Hall; 1987.
4. Aluminum drill pipes ADPPB131x13 and ADPPB150x25 for oil & gaz wells drilling, Operational manual. Moscow: AQUATIC Company; 2002.
5. ABAQUS User’s manuals. Pawtucket: Hibbitt, Karlsson, Sorensen, Inc; 2003.
6. Zhang XP, Li WF. Investigation of initiation and growth behavior of short fatigue cracks emanating from a single edge notch specimen using in-situ SEM. Materials Science and Engineering A. 2001; 318(1-2):129:136.