*e-mail: [email protected]
Fatigue Crack Growth Resistance and Crack Closure Behavior
in two Aluminum Alloys for Aeronautical Applications
Elenice Maria Rodriguesa, Adalberto Matiasa, Leonardo Barbosa Godefroida*,
Fernando Luiz Bastianb, Kassim S. Al-Rubaiec
a
REDEMAT, UFOP, Ouro Preto - MG, Brazil
bCOPPE/UFRJ, Rio de Janeiro - RJ, Brazil
cEMBRAER, São José dos Campos - SP, Brazil
Received: November 10, 2004; Revised: April 26, 2005
Aluminum-lithium alloys are candidate materials for many aerospace applications because of their high speciic strength and elastic modulus. These alloys have several unique characteristics such as excellent fatigue crack growth resistance when compared with that of the conventional 2000 and 7000 series alloys. In this study, fatigue crack propagation behavior has been examined in a commercial thin plate of Al-Li-Cu-Mg alloy (8090), with speciic emphasis at the fatigue threshold. The results are compared with those of the traditional Al-Cu-Mg alloy (2024). Fatigue crack closure is used to explain the different behavior of the compared alloys.
Keywords:fatigue, crack closure, aluminum alloys, aeronautical applications
1. Introduction
Since its discovery by Elber1, fatigue crack closure has been an
in-tensely studied parameter associated with fatigue crack growth behav-ior. Crack closure is important because it tends to alter the relationship between the applied stress intensity factor range (∆K = Kmax – Kmin) and that actually experienced by the crack tip (∆Keff = Kmax – Kcl). Under constant amplitude loading, crack closure tends to decrease the applied stress intensity, resulting in a corresponding reduction in crack growth rate. Elber attributed the phenomenon of closure to the mechanism of plasticity-induced crack closure. Suresh and Ritchie2-4
introduced the additional mechanisms of oxide-induced and surface roughness-induced crack closure, and Suresh5,6 presented the effect
of crack delection on local stress intensities and crack closure. The level of crack closure is affected by many parameters, like material microstructure, specimen geometry, crack tip geometry, crack size, loading conditions (Kmax, R ratio, overloads), and test conditions (ambient and temperature). An example of this depend-ence is presented in Figure 1, which shows schematic variations of crack closure for different closure mechanisms7.
During the past decades, Al-Li heat-treatable alloys have been widely investigated8-10 because of their superior speciic strength and
modulus compared with those of the conventional aluminum alloys. In addition, excellent fatigue resistance is observed in many micro-structures. Such characteristics make these alloys good candidates for future airframe structures.
The purpose of this research was to compare the fatigue crack growth behavior of the quaternary Al-Li-Cu-Mg (8090) alloy with that of the traditional Al-Cu-Mg (2024) alloy. Fatigue crack growth methodology was considered, with speciic emphasis at the fatigue threshold. Crack closure was used to explain the different behavior of the two alloys.
2. Materials and Methodology
Two kinds of aluminum alloys, namely, 2024 and 8090 were studied. Both alloys were provided in the form of rolled plates that had been solution-treated and naturally aged.
Tensile tests were made on longitudinal specimens, according to ASTM B557M-0111, on a 100 kN universal test machine.
Fatigue crack growth tests were done, according to ASTM E647-0112,
under a constant amplitude sinusoidal wave loading and at stress ratio R of 0.3. For this purpose a 100 kN MTS servo-hydraulic testing machine, interfaced to a computer for machine control and data acquisition, was used.
C(T) specimens (4 mm thick, 50 mm wide) in L-T orientation were tested. All tests were conducted at a frequency of 30 Hz, room temperature ranging from 20 °C to 25 °C, relative humidity from 60% to 70%, and in air environment. Crack length and crack closure were measured by the crack mouth opening displacement method (compliance method).
Fracture surfaces were analysed using a JEOL scanning electron microscope. Fatigue crack path morphologies were examined on metallographic sections by means of LEICA optical microscope. Transmission electron microscope (TEM) was used to study the characteristic of precipitates.
3. Results and Discussion
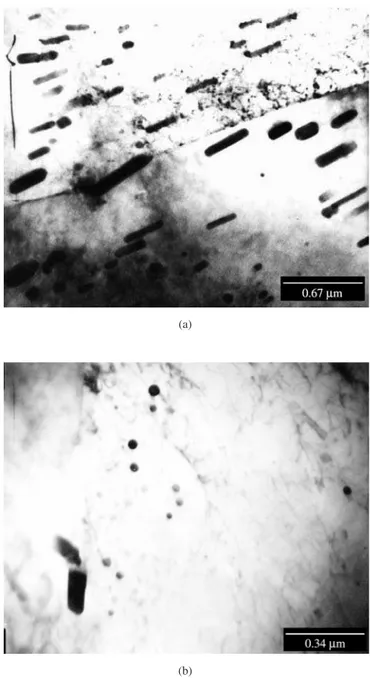
Figure 2a and 2b shows the microstructures of 2024 and 8090 aluminium alloys studied. Both alloys demonstrate an unrecrystal-lized pancake-shaped grain structure along the rolling direction. This is a normal microstructure of heat- treatable alloys, which is responsible for the best tensile mechanical properties and fracture toughness13-16. Figure 3a and 3b shows TEM images of the two
microstructures. Although the microstructure magniication of Al 8090 alloy (Figure 3b) is twice than that of 2024 (Figure 3a), the precipitates in 8090 are still smaller than those in 2024. The type, size, form, volume fraction, distribution, and coherency of these precipitates signiicantly affect both strength and fracture toughness of the material.
At R = 0.3, fatigue crack growth rate, da/dN, as a function of stress intensity factor range, ∆K, for the two Al alloys (2024 and 8090) is presented in Figure 4. Although the elongation value of 8090 is 54% of that of 2024 (Table 1), the propagation rate of the former is lower than that of the latter, in both threshold and Paris regions.
Values of the stress intensity factor at closure, Kcl, were obtained. Figure 5 demonstrates the Kcl/Kmax ratio as a function of ∆K. For 2024 aluminium alloy, it is seen that the Kcl/Kmax ratio (closure effect) linearly decreases with ∆K. On the other hand, for 8090 alloy, a nearly constant relationship between closure effect and ∆K is found. It is also important to see that 8090 alloy presents higher closure values than those of 2024.
Metallographic sections were taken perpendicular to the fracture to indicate crack path proile. Figure 6a and 6b presents the crack path in Al 8090. Irrespective of the ∆K value, the crack propagates transgranulary. At near-threshold region (Figure 6a), the proile shows an evidence of more crack roughness than that at higher growth
Kmax
Pcl
Combination
Plasticity
Oxide
Roughness Ti alloys
Fe alloys
Figure 1. Inluence of Kmax on crack closure load for three forms of crack
closure; plasticity-induced crack closure, roughness-induced crack closure,
and oxide-induced crack closure as well as their combined inluence7.
(a)
(b)
Figure 2. Optical micrographs, a) Al 2024 (100X); and b) Al 8090 (500X).
Keller’s etching17.
(a)
(b)
rates (Figure 6b). The proile also shows crack bifurcation; this is an interesting result. All these characteristics observed in 8090 are less pronounced in 2024 alloy.
Figure 7a and 7b shows a close-up view of the fractured surfaces of the specimens. It is seen that the Al 2024 alloy has a lat and brilliant surface (Figure 7a), while the surface of the Al 8090 is tortuous and grey (Figure 7b), indicating the possibility of oxidation.
Table 1. Tensile properties of 2024 and 8090 aluminum alloys. Three speci-mens.
Alloy E (GPa) σys (MPa) σuts (MPa) εt (%, 30 mm)
Al 2024 67 ± 2 373 ± 17 489 ± 2.5 25.0 ± 3.8 Al 8090 80 ± 2 216 ± 3.5 343 ± 2.1 13.5 ± 0.1
σys: 0.2% Yield tensile strength
σuts: Ultimate tensile strength
εt: Total strain
Fractographic analysis of fatigue crack growth at near-threshold for the Al 8090 alloy shows a predominant transgranular fracture mode, with the “hill-and-valley” type appearance and shear facets, with an associated zig-zag path (Figure 8a). Such fracture demon-strates high roughness and high crack delection angles, characteristic of extensive crack closure induced by asperity wedging (see also Figure 6 and Figure 7b). At higher growth rates, fracture surfaces remain transgranular, but with evidence of striations (Figure 8b).
For Al 2024 alloy, fracture surfaces are more planar, without shear facets at near-threshold region, and with many striations in all extension of the test, as seen in Figure 9.
Many researches21-33 indicate the following factors that can explain
the better performance of Al-Li alloys in comparison with other Al alloys, near the threshold ∆Kth region of crack growth:
a) planarity and reversibility of slip; b) differences in Young modulus; c) oxide-induced crack closure; d) roughness-induced crack closure; and e) crack delection.
The Al alloys studied in this work have the same underaged microstructure, with the traditional planar and reversible motion of dislocations. This factor doesn’t contribute to the different behavior of the alloys.
10
$K (MPa*m1/2)
da/dN (mm/c
ycle)
Al-8090
Al-2024
R = 0.3
f = 30 Hz
Figure 4. Variation of fatigue crack growth rate with stress-intensity-factor range.
6 5
4 3
2 1.0
0.9
0.8
0.7
0.6
0.5
0.4
0.3
Kcl
/K
max
$K (MPa*m1/2) Al-8090
Al-2024
$Kth
Figure 5. Variation of crack closure with stress-intensity-factor range.
(a)
(b)
Table 1 showed that the Al 8090 has a Young modulus 19% superior to the Al 2024 alloy. This is a possible contribution to the different behavior, because crack opening displacement (a parameter related to the driving force for crack growth) is inversely proportional to the Young modulus.
The level of crack closure near the threshold ∆Kth is nearly 50% different for the two Al alloys. This is the most important parameter responsible for the difference in the fatigue behavior. In this case, oxide-induced crack closure (Figure 7), roughness-induced crack closure (Figures 6 and 8) and crack delection (Figure 6) are together the causes of 50% higher value of ∆Kth of Al 8090 alloy.
At higher crack growth rates, crack closure mechanism changes to plasticity-induced crack closure. Since Al 8090 alloy has lower yield stress (Table 1) than Al 2024 alloy, then the level of crack closure developed is higher for Al 8090 alloy.
4. Conclusions
• The fatigue crack growth resistance of the Al 8090 alloy is higher than that of the Al 2024 alloy, mainly in the near-threshold region;
• The threshold stress intensity factor range, ∆Kth, in Al 8090 is 50% higher than that in Al 2024 alloy; and
(a)
(b)
Figure 9. SEM fractography of Al 2024 alloy of a) low ∆K region; and b) high
∆K region. 250X. Arrow indicates the direction of crack propagation.
Figure 7. Fracture surfaces, a) Al 2024; and b) Al 8090.
(a)
(b)
Figure 8. SEM fractography of Al 8090 alloy of a) low ∆K region; and b) high
∆K region. 250X. Arrow indicates the direction of crack propagation.
(a)
• Crack closure can be used to explain the different behavior of the alloys studied. Oxide-induced crack closure, roughness-induced crack closure, and crack delection are responsible for the behavior in the near-threshold region. On the other hand, plasticity-induced crack closure is active for higher crack growth rates. The level of crack closure is 50% superior for the Al 8090 alloy.
Acknowledgments
This research was supported by FAPEMIG – Fundação de Amparo à Pesquisa do Estado de Minas Gerais.
References
1. Elber W. Fatigue crack closure under cyclic tension. Engng Fract Mech.
1970; 2:37-45.
2. Suresh S, Ritchie RO. A geometric model for fatigue crack closure induced
by fracture surface morphology. Metall Trans. 1982; 13A: 1627-1631.
3. Suresh S, Ritchie RO. Propagation of short fatigue cracks. Intl Metals
Rev. 1984; 29:445-476.
4. Suresh S, Ritchie RO. Near-threshold fatigue crack propagation: a
perspective on the role of crack closure. In: Davidson DL, Suresh S,DL, Suresh S, Suresh S,S,
editors. Fatigue Crack Growth Threshold Concepts. AIME (American
Institute of Mining, Metallurgical and Petroleum Engineers); 1984 Oct 3-5; Philadelphia, USA. 1984. p. 227-261.
5. Suresh S. Crack delection: implications for the growth of long and short
fatigue cracks. Metall Trans. 1983; 14A:2375-2385.
6. Suresh S. Fatigue crack delection and fracture surface contact:
micro-mechanical models. Metall Trans. 1985; 16A:249-260.
7. Allison JE. The measurement of crack closure during fatigue crack
growth. In: Read DT, Reed RP, editors.DT, Reed RP, editors., Reed RP, editors.RP, editors., editors. ASTM-STP 945. ASTM (American
Society for Testing and Materials); 1988 Jun 25-27; Boulder, USA. 1988. p. 913-933.
8. Rao KTV, Ritchie RO. Fatigue of aluminum-lithium alloys. Intl Mater
Rev. 1992; 37:153-185.
9. Godefroid LB, Bastian FL. Propagação de trincas por fadiga em ligas de
alumínio-lítio. In: Bradaschia C, Pagnano CA, Santos PR, Padilha AF,CA, Santos PR, Padilha AF,, Santos PR, Padilha AF,PR, Padilha AF, Padilha AF,AF,
editors. Materiais Avançados. ABM (Associação Brasileira de Metalurgia
e Materiais);1989 Nov 20-23; São José dos Campos - SP, Brasil. 1989. p. 193-214.
10. Godefroid LB, Bernardes AT, Bastian FL. Resistência ao crescimento de trinca de fadiga de duas ligas de alumínio de emprego aeronáutico. In:
Lisboa J, editor. V Seminário de Tecnologia da Indústria do Alumínio.
ABAL (Associação Brasileira do Alumínio); 1995 May 29-31; São Paulo - SP, Brasil. 1995. p. 691-704.
11. Standard Methods of Tension Testing Wrought and Cast Aluminum and
Magnesium Alloy Products. ASTM B557M-01. In: 2001 Annual Book
of ASTM Standards. Philadelphia, USA.
12. Standard Test Method for Measurement of Fatigue Crack Growth Rates.
ASTM E647-01. In: 2001 Annual Book of ASTM Standards. Philadelphia, Philadelphia,
USA.
13. Harris SJ, Noble B, Dinsdale K. The mechanical behavior of aluminum
alloys containing lithium. In: Taunt RJ, Gregson PJ, Cooke T, WarrenRJ, Gregson PJ, Cooke T, Warren, Gregson PJ, Cooke T, WarrenPJ, Cooke T, Warren, Cooke T, WarrenT, Warren Warren
P, editors. The Metallurgy of Light Alloys. The Institution of
Metallur-gists;1983 Mar 24-26; Loughborough, UK. 1983. p. 48-56.
14. Staley JT. Microstructure and toughness of high-strength aluminum
al-loys. In: Warke WR, Weiss V, Hahn G, editors.WR, Weiss V, Hahn G, editors., Weiss V, Hahn G, editors.V, Hahn G, editors. Hahn G, editors.G, editors., editors. ASTM-STP 605. ASTM
(American Society for Testing and Materials); 1976 Jun 22-27; Montreal, Canadá. 1976. p. 71-103.
15. Thompson DS. Metallurgical factors affecting high-strength aluminum
alloys production. Metall Trans. 1975; 6A:671-683.
16. Rao KTV, Ritchie RO. Mechanical properties of Al-Li alloys. Mater Sci
Technol. 1989; 5:882-895.
17. Van der Voort GF. Metallography. New York, USA: McGraw-Hill Book
Co; 1984. p. 195.
18. Hahn GT, Rosenield AR. Metallurgical factors affecting fracture
tough-ness of aluminum alloys. Metall Trans. 1975; 6A:653-670.
19. Garrett GG, Knott JF. The inluence of compositional and microstructural variations on the mechanism of static fracture in aluminum alloys. In:
Promisel N, Weiss V, editors.V, editors., editors. Proc. of the 2nd International Conference
on Mechanical Behavior of Materials. ASM (American Society for Metals & Materials); 1976 Aug 16-20; Boston, USA. 1976. p. 488-514.
20. Kaufman JG, Santner JJ. Application of Fracture Mechanics for Selection
of Metallic Structural Materials. ASM (American Society for Metals &
Materials); Metals Park, USA. 1982. p. 169-212.
21. Jata KV, Starke EA. Fatigue crack growth and fracture toughness behavior
of an Al-Li-Cu alloy. Metall Trans. 1986; 17A:1011-1026.
22. Srivatsan TS, Coyne EJ. Mechanisms governing cyclic fracture in a
Al-Cu-Li alloy. Mater Sci Technol. 1987; 3:130-138.
23. Peel CJ, Evans B, McDarmaid DS. Development of aluminum-lithium
alloys in the UK. Metals & Materials. 1987; 8:449-455.
24. Vasudevan AK, Suresh S. Inluence of corrosion deposits on near-thresh-old fatigue crack growth behavior in 2XXX and 7XXX serie aluminum
alloys. Metall Trans. 1982; 13A:2271-2280.
25. Vasudevan AK, Bretz PE, Miller AC, Suresh S. Fatigue crack growth
behavior of aluminum alloy 2020. Mater Sci Engng. 1984; 64:113-122.
26. Rao KTV, Yu W, Ritchie RO, Fatigue crack propagation in
aluminum-lithium alloy 2090. Metall Trans. 1988; 19A:549-561.
27. Srivatsan TS, Coyne EJ. Micromechanisms governing fatigue
behav-ior of lithium containing aluminum alloys. Mater Sci Technol. 1989;
5:548-555.
28. Pao PS, Cooley LA, Imam MA, Yoder GR. Fatigue crack growth in 2090
Al-Li alloy. Scripta Metall. 1989; 23:1455-1460.
29. Rao KTV, Ritchie RO. Mechanical properties of Al-Li alloys. Mater Sci
Technol. 1989; 5:896-907.
30. Blankenship CP, Starke EA. The fatigue crack growth behavior of
the Al-Cu-Li alloy weldalite 049. Fat Fract Engng Mater Struct.
1991;14:103-114.
31. Park KJ, Park CG, Kim NJ, Lee CS. Microstructure inluence on the
intrinsic fatigue properties of Al-Li 8090 alloy. Mater Sci Engng. 1995;
A190:99-108.
32. Lee CS, Park CG, and Chang YW. Precise determination of fatigue crack
closure in Al alloys. Mater Sci Engng. 1996; A216:131-138.
33. Yung HY, Antolovich SD. Fatigue crack closure as a function of crack