Abstract
The uniform deformation theory (UDT) is a relatively new con-cept in structural seismic design optimization. However, the re-sults of optimization based on this theory have not yet been com-pared with other optimization techniques such as metaheuristics, and the optimality of the designs has been proved only by com-paring the results with the conventional designs. This paper pre-sents a new algorithm based on the UDT to performance-based design optimization (PBDO) of steel moment frames. In order to verify robustness of this method, the achieved results of PBDO for two baseline steel moment frames are compared with three me-taheuristics consisting of genetic algorithm (GA), ant colony op-timization (ACO), and particle swarm opop-timization (PSO). The results indicate that the optimization based on UDT provides a much higher convergence rate to the optimum design compared with metaheuristics.
Keywords
structural optimization, uniform deformation theory, performance-based design, metaheuristics.
Performance-based design optimization using uniform
deformation theory: a comparison study
1 INTRODUCTION
Optimization is among the most interesting and attention engaging topics for engineers in various fields. In other words, we can apply the optimization techniques to solve several engineering prob-lems. Some of these utilizations are mentioned in Yang (2010) as instances. Choosing and assigning specific sections to structural elements, in addition to satisfying the design criteria and minimizing the weight of the structure, is an aim which can be achieved by applying the optimization tech-niques. In general, techniques applied in structural optimization can be categorized into classical and heuristic search methods. Classical optimization methods include mathematical programming and optimality criteria (Kaveh and Talatahari, 2010). There are numerous applications of these optimization techniques in the literature, but heuristic methods have been among interest in recent decades because of their advantages in comparison with other two methods.
R. Karami Mohammadi a A. Ghasemof b
aAssociate Professor, Civil Engineering
Department, K. N. Toosi University of Technology, Tehran, Iran
b MSc student, Civil Engineering
De-partment, K.N. Toosi University of Technology, Tehran, Iran
http://dx.doi.org/10.1590/1679-78251207
Latin American Journal of Solids and Structures 12 (2015) 18-36
Optimization using the uniform deformation theory (UDT) is another approach which has been proposed and applied to optimum design of the structures in recent years. This method is based upon the original work of Karami Mohammadi (2001) and quite different from other mentioned methods in the field of optimization. It’s formed based on the concept of structural performance and uniform distribution of deformation demands in the structure subjected to the seismic excitation. The aim of this methodology is to assign specific sections to members such that all of the members can reach their allowable deformation capacity during the earthquake. It has been shown that in this status, the weight of the structure is minimum, and therefore, the design of the structure is optimized (Karami Mohammadi et al., 2004). According to the basis of this approach, UDT can be assumed as a method of Performance-Based Design Optimization (PBDO).
In recent years, researchers have used this approach for the optimization of different structures such as work of Rahemi et al. (2007), Moghaddam et al. (2009), Hajirasouliha et al. (2011) and Karami Mohammadi and Sharghi (2014). However, the optimality of the designs has been proved only by comparing them with the conventional force-based designs. The results of this method have not yet been compared with the results of other optimization techniques.
This paper presents an algorithm to PBDO of steel moment frames using the concept of the UDT. The algorithm consists of two phases. In the first phase, to enhance the rate of convergence, the search space of design variables is assumed to be continuous. In this phase, only the defor-mation-controlled elements may vary. In the second phase, to reach a practical design, discrete cross sections in the neighborhood of the results gained in the previous phase are selected for each ele-ment. Acceptance criteria for both deformation and forced-controlled elements are controlled to be satisfied. In order to confirm the suitability of the proposed method, the results of the PBDO of the two steel moment frames are compared with the results of three well-known metaheuristics includ-ing Genetic Algorithm (GA), Ant Colony Optimization (ACO) and Particle Swarm Optimization (PSO). Comparison study represents high speed of the proposed algorithm of UDT to achieve the optimal solution in compared with metaheuristics.
2 PERFORMANCE-BASED DESIGN OPTIMIZATION
Performance-based design (PBD) procedure is relatively a new concept for seismic design of struc-tures which has been introduced in early 1990s as an alternative to the current strength-based de-sign methods (FEMA, 2006). The growing acceptability of the performance-based dede-sign approach is reflected by investigations related to seismic rehabilitation of existing buildings which have been published by Federal Emergency Management Agency (FEMA), the Structural Engineers Associa-tion of California (SEAOC), the Applied Technology Council (ATC), California Universities for Research in Earthquake Engineering (CUREE) and SAC (a joint venture of SEAOC, ATC and CUREE). Principles and concepts governing these guidelines for seismic rehabilitation could also be used to construct new buildings in the form of performance-based design (Gong, 2003).
Latin American Journal of Solids and Structures 12 (2015) 18-36
damages and losses in a specific hazard level. In PBD codes such as ASCE 41-06 (2007), perfor-mance levels for a building consists operational (OP), immediate occupancy (IO), life safety (LS) and collapse prevention (CP). Additionally the considered hazard levels are defined based on the probability of exceedance in a specific period (often 50 years). Conventional assumption is that OP, IO, LS and CP performance level correspond with 50%/50 year, 20%/50 year, 10%/50 year and 2%/50 years, respectively.
In order to evaluate the seismic demands at different performance levels, according to ASCE 41-06 (2007), linear procedures (Linear Static Procedure and Linear Dynamic Procedure, LSP and LDP) and the nonlinear procedures (Nonlinear Static Procedure and Nonlinear Dynamic Procedure, NSP and NDP) by considering defined limitations for each of them can be used. In this research, pushover analysis (or NSP) is considered to determine the nonlinear response of the structures. Pushover analysis because of simplicities in comparison with NDP is widely used to predict nonline-ar response of the structures. In this method the structure shall be subjected to monotonically in-creasing lateral loads representing inertia forces in an earthquake until a target displacement is ex-ceeded. The target displacement is intended to represent the maximum displacement likely to be experienced during the design earthquake. Based on ASCE 41-06 (2007) the target displacement ( t) is defined as:
2 0 1 2 2
4
e
t a
T
C C C S g (1)
where C0 relates spectral displacement to the building roof displacement,C1 relates expected
max-imum inelastic displacements to displacements calculated for linear elastic response,C2 represents
the effect of hysteresis shape on the maximum displacement response,Te is effective fundamental
period of the building,Sa is the response spectrum acceleration corresponding to the Te and g is
gravity acceleration.
Simultaneously with introduction of PBD and develop of related guidelines in the 1990s, the sub-ject of optimization in PBD framework, performance-based design optimization (PBDO), was also considered by researchers. In general a structural optimization problem can be formulated as fol-lows:
1 2
1
X , ,..., , x
minimize W =
0 , j 1,2,...,
ng i i
nm
i i i i
j
Find x x x D
to X x L
subject to g X nc (2)
where X is a set of design variables (e.g. cross-sectional area of structural element groups);ng is
the number of design variables;Di represents a set of allowable values for the design variable i;
W X is the weight of the structure; i,xi and Li represent the weight per unit volume,
Latin American Journal of Solids and Structures 12 (2015) 18-36
In order to determine gj X which indicates performance criteria in a problem of PBDO, the demand capacity ratio (DCR) of structural element groups should be calculated. According to code specifications, the DCR of element group i can be expressed as
max max
max max
, / 0.5
1,2,..., , i i i i all all i i i i i all all P for beams columns with
P
DCR i ng
P M for column P M max 0.5 i i all P s with P (3)
where maxi is maximum rotation of the plastic hinge in element group
i, and alli is the allowable
rotation of element group i corresponding to a specific performance level which can be determined
from ASCE 41-06 (2007). Pmaxi and
max
i
M are the maximum axial load and bending moment for
element group i, respectively; Palli and Malli are the allowable axial load and bending moment for
element group i which shall be calculated in accordance with AISC 360-10 (2010). Hence,
con-straint for each structural element group is evaluated as follows:
- 1 1,2,...,
i i
g X DCR i ng (4)
Also rotation is replaced here by curvature, based on the assumption that DCR of rotation and curvature are almost the same.
3 METAHEURISTIC ALGORITHMS
The metaheuristics are the optimization techniques developed in the last two decades (Kaveh and Shojaee, 2007). These techniques are usually random and iterative procedures and are involved with discrete variable designs, although these methods have also been used for the optimization problems with continuous variables. The fundamental of these algorithms is normally dependent on their similarity to natural and social processes. Some of these methods include Genetic Algorithms (GAs), Particle Swarm Optimization (PSO), Ant Colony Optimization (ACO), Simulated Anneal-ing (SA), Harmony Search (HS), Charged System Search (CSS), Imperialist Competitive Algorithm (ICA) and Big Bang-Big Crunch (BB-BC).
In this paper, GA, PSO and ACO which are among the most popular algorithms in the field of optimization and numerous successful applications of them have been reported in the literature are used to PBDO of the structures. Basic concepts of these algorithms are briefly described below.
3.1 Genetic Algorithm
Latin American Journal of Solids and Structures 12 (2015) 18-36
makes a population as initial designs randomly; then the combination of individuals (designs) occurs to create a population for next generation. In this procedure in which natural evolution of living organisms is mimicked, the combination of individuals happens based on a selection procedure. Each individual is first evaluated and a fitness value corresponding to the objective function is allo-cated to it. Next, individuals with high fitnesses are selected for reproduction. An individual with high fitness has several chances for pairing in reproduction phase. Hence, a probability is allocated to each individual in the population based on its fitness to be selected as a parent. Next generation are developed from selecting pairs of parent and the application of explorative operators such as mutation and crossover. Crossover is a process in which selected parent string is divided into parts and some of these parts are exchanged with corresponding parts of another parent string. Mutation process enables the children to have characteristics that don't exist in both parent strings. Without this operator, some regions of search space may never be discovered.
Therefore by using three basic operators of GA including selection, crossover and mutation, next generation of population which has better fit individuals in comparison with previous generation will be created. The main philosophy of a GA is that at every time after start of the process, by combining the more fit individuals, the average fitness of the population should be increased and the algorithm is converged to an optimal point. More details of this method can be seen in work of Campet al. (1998) and Erbatur et al. (2000).
So far the standard GA (SGA) and its improved versions widely adopted by different researchers in various engineering optimization problems, some of these applications can be found in the studies conducted by Farhat et al (2009), Kociecki and Adeli (2013).
3.2 Ant Colony Optimization
Ant Colony Optimization (ACO) was first proposed by Colorni et al. (1991) and Dorigo et al. (1991) as a multi-agent approach to solve different combinatorial optimization problems like the travelling salesman problem (TSP). ACO is inspired by the behavior of real ants which are able to seek the shortest path between their colony and source of food through a complex set of pheromone trails. In ACO procedure, the shortest path corresponds to the optimum solution for the optimiza-tion problem which is discovered by colony of artificial ants. Each artificial ant assigning allowable discrete values to design variables represents a solution for the optimization problem. For each var-iable, the number of virtual paths which can be selected by each ant in the colony is equal to the number of discrete values considered for that variable.
The basic steps of ACO can be explained as follows. At the first iteration an initial value of the pheromone is allocated to each of the paths. This value may be considered as
0
min
1
W (5)
where 0 is the initial pheromone on all paths, and Wmin is the weight of frame resulting from as-signing the smallest available cross-sectional area to each element group.
Latin American Journal of Solids and Structures 12 (2015) 18-36
point of its travel. Each ant assigns a section to its corresponding element group using the selection probabilities of the paths which is determined as follows:
1
0
i
ij ij
i N
k ij
il il
l
t v
if j N
P t t v
otherwise
(6)
where k
ij
P t is the selection probability of jth path for ith design variable by kth ant at time t,
ij t is the remaining pheromone trail intensity on the path (i, j), vij is the visibility parameter
associated with the path (i, j), Ni is the number of available sections in the design database of ith element group, and are constant parameters which are used to control the relative importance of pheromone trail and visibility, respectively. Visibility parameter in Eq. (6) is calculated as
1
ij ij
v
A (7)
where Aij is the jth cross-sectional area for element group ith.
After selecting a path by an ant, pheromone intensity on this path is relatively reduced using local pheromone update equation as follows:
ij t ij t (8)
where is the local update parameter between 0 and 1 representing the persistence of pheromone. Consequently the selection probabilities of the paths using updated values of the pheromone will be calculated again and the next ant will do its selection. When all ants did their first choices, they proceed for their next element group (i+1), and whenever an ant's element group is greater than the number of element group (here greater than ng), it will proceed to element group 1. This
pro-cess will continue until all ants in the colony assign a section to all structural element groups. Then the pheromone intensity is updated in order to increase the pheromone value associated with good or promising paths. The updating is achieved using global pheromone update equation as follows:
1
ij t ng ij t ij (9)
where is a constant between 0 and 1 representing the persistence of pheromone trails and
1 is the evaporation rate between time t and t ng (the amount of time required to
com-plete a cycle); ij is the enhanced pheromone amount by the elitist ant which is calculated using following equation:
1
ij
W (10)
Latin American Journal of Solids and Structures 12 (2015) 18-36
At this point, an iteration of ACO is complete, and a new iteration may be initiated. More de-tails of the method are explained in work of Camp et al. (2005) and Kaveh and Talatahari (2010). The successful application of this algorithm has been already proved by many researchers in the field of structural optimization. Some applications of the ACO are mentioned in studies conducted
by Hasançebi and Çarbaş (2011) and Aydoğdu and Saka (2012).
3.3 Particle Swarm Optimization
The Particle Swarm Optimization (PSO) algorithm was first proposed by Kennedy and Eberhart (1995). It’s motivated from the social behavior of bird flocking or fish schooling. PSO algorithm includes a population of individuals which move in search space and each individual possess a spe-cific speed, which operates as an operator to obtain a new set of individuals. Individuals, who are called particles, adjust their movements based on their own experience and the experience gained by the population (Kaveh and Talatahari, 2007).
Each particle of swarm represents one solution to the optimization problem and its position up-dated based on the best position obtained by the particle itself and also by the best position of the swarm in each repetition. Numerically, the position x of a particle i at iteration k 1 is updated as Eq. (11)
1 1
i i i
k k k
x x v t (11)
where i 1 k
v is the corresponding updated velocity vector and t is the value of time step (usually assumed to be one).
The velocity vector for each particle in each step is expressed as follows:
1 1 1 2 2
g i i i k k k k i i k k p x p x
v v c r c r
t t
(12)
where i k
v is the velocity vector at iteration k, i k
p and g
k
p are the best position for the particle iand
the global best position in the swarm up to iteration k, respectively, r1 and r2 are two random numbers in the interval [0,1]. The remaining terms are the configuration parameters which possess an important role in PSO convergence behavior. So that the coefficients c1(cognitive parameter) and c2 (social parameter) represent degree of confidence in the best solution found by each individ-ual particle and by the swarm as a whole, respectively. The final term , is the inertia weight which is employed to control the exploration abilities of the swarm and in general scales the current velocity value affecting the updated velocity vector. It is proved that to guarantee the convergence of PSO, these coefficients should satisfy the following conditions:
1 2 1 2 0 4 1 1 2 C C C C (13)
Latin American Journal of Solids and Structures 12 (2015) 18-36 max min
1
max
k k
k (14)
In the above equation max and min are initial and final values of inertia weight and kmax is the maximum number of iterations. More details of the method are presented in work of Perez and Behdinan (2007).
In field of structural optimization many successful applications of PSO have been published by various authors. Some of these applications can be found in work of Luh and Lin (2011), Kaveh and Zolghadr (2014).
4 OPTIMIZATION BASED ON UNIFORM DIFORMATION THEORY (UDT)
Studies and investigations done by different researches in several fields such as the effect of dynamic nature of seismic forces in the response of the structures, lateral load distribution patterns and their influence on the deformation demands, and the optimum distribution patterns of shear strength and stiffness in structures led to introduce a new concept called uniform deformation theory.
Initial algorithm of this method first proposed by Karami Mohammadi (2001) as an iterative proce-dure to determine the optimum strength distribution pattern for a shear building model subjected to a given earthquake. Based on this algorithm, then Moghaddam and Hajirasouliha (2004) pro-posed an approach called uniform deformation algorithm and used it for optimum seismic design of a shear and truss-like structure. In studies carried out by these researchers, the ductility of the sto-ry and the ductility of the members are assumed as the demand parameters to control the perfor-mance of the shear and truss-like structure, respectively.
Based on this theory, inefficient material is gradually shifted from the strong to weak areas leads to a uniform deformation (ductility) state at the end of repetitive process. It has been shown that in this status the seismic performance of the structure is optimized. Although the base of this theory and proposed algorithm is to attain a uniform state of deformation in the whole structure and stud-ies on this theory and its application in the field of structural optimization has been rests on the same base, but the allowable limit of deformation values defined in (PBD) codes such as ASCE 41-06 (2007) is not constant for all of structural members. On the other hand, in these codes, some actions of structural members may be controlled by deformation and some controlled by force (see Eq. (3)). For example the flexural actions of beams shall be considered deformation-controlled while the flexural loading of columns depending on the amount of the axial load may be controlled by force or deformation. Therefore, by considering the acceptance criteria of PBD codes, it is not pos-sible to reach a uniform deformation state in the whole structure and then using the expression of uniform deformation algorithm loses its meaning somewhat.
de-Latin American Journal of Solids and Structures 12 (2015) 18-36
termined accordingly by linear interpolation. Additionally in this phase of search, only the defor-mation-controlled elements may vary, thus DCR of force-controlled members is assumed to be one. First phase of the search is done as follows:
1. For the initial design, the cross-sectional area of all members is supposed their maximum availa-ble. Therefore the assumed weight of the structure is the maximum in the initial step.
2. The structure is analyzed and the DCRs are calculated for each structural member group from Eq. (3).
3. The coefficient of variation (COV) of groups’ DCRs is determined using following equation:
1
1
ng
i ave
i
ave
DCR DCR
ng COV
DCR
(15)
where DCRave is the average of DCR.
4. If the termination criteria are satisfied the optimization process will be stopped in the first phase. Otherwise the process continues. The termination criteria can be expressed as follows.
COV reduced to the desired value (e.g. less than about 10%), while DCRave is greater than the predefined value (e.g. greater than about 70%) or the variation of weight is small enough (e.g. less than about 0.1%).
5. In this step section assigned to each element group is modified as
1 1 1
i k i k i i
Z Z c DCR (16)
where Zi k and
1
i k
Z are the plastic section modulus of element group i at iteration k and
1
k , respectively, ci is convergence coefficient which will be calculated for each member group using Eq. (17).
1
i i
c DCR (17)
In the above equation is a constant between 0 and 1 which is taken 0.3 in this research.
By using the new property of plastic section modulus, other cross-sectional properties can be calculated.
6. Steps 2 to 5 are repeated until termination criteria is satisfied.
Latin American Journal of Solids and Structures 12 (2015) 18-36 5 NUMERICAL EXAMPLES
In this section two baseline steel moment frames, four-bay three-story and five-bay nine-story, using described methods are optimized. These frames are adopted from model buildings investigated in the SAC steel project (FEMA, 2000) located in the Seattle area and their general specifications, including geometry, loading and material properties selected accordingly. The nine-story model is slightly modified for this study. The buildings are assumed to be located on a soil type C. The modulus of elasticity and yield stress of steel material are 200 GPa and 345 MPa, respectively, and the strain hardening slope is equal to 3% of the elastic modulus.
I
PB sections are chosen for col-umns, while IPE sections and eight sections of plate girders (PG1-PG8) with the predefined proper-ties are considered for beams. Weight per unit length of plate girder sections is presented in the following Table 1.Section N am e PG1 PG2 PG3 PG4 PG5 PG6 PG7 PG8
G (kN /m ) 1.37 1.54 1.71 1.88 2.05 2.22 2.39 2.56
Table 1: Weight per unit length of Plate Girders.
According to the code recommendation, lateral load pattern is assumed based on the first mode shape of the frame (ASCE, 2007). Also the following gravity load is considered for combination with the seismic loads:
=1.1
G D L
Q Q Q (18)
where QD and QL are dead and live loads, respectively.
In order to calculate the target displacement and perform the pushover analysis, design accelera-tion spectrum is considered in accordance with ASCE 7-10 (2010) and can be expressed as follows:
0 0
0
1
1 2
0.4 0.6 if 0<T<T
if T T T if T T T
if T T
DS
DS S
a D
S L
D L
L
T S
T S
S S
T S T
T
(19)
Latin American Journal of Solids and Structures 12 (2015) 18-36 1
0
T =
T =0.2 D S
DS
S S S
T (20)
In this study design is performed based on the life safety (LS) performance level and hazard level corresponding to 10%/50 year, thus the design spectral response acceleration parameters are as-sumed to be 2/3 values of these parameters in the maximum considered earthquake (MCE), and can be determined as follows:
1 1
2 3 2 3
DS MS
D M
S S
S S (21)
where SMSand SM1 are the MCE spectral response acceleration parameters at short periods and period of 1 second, respectively. These parameters are defined as
1 1
MS a S
M v
S F S
S F S (22)
In the above equation SS and S1 are the mapped MCE spectral response acceleration parameters at short periods and period of 1 second, respectively. Based on the presented maps in ASCE 7-10 (2010), these parameters for the Seattle area may be determined as 1.360 g and 0.527 g, respective-ly. Additionally Fa and Fv are the site coefficients which can be determined based on the soil type and values of SS and S1 as 1 and 1.3, respectively.
For both presented examples, the parameters of the metaheuristics are taken based on the rang-es of thrang-ese valurang-es and also by considering the problem conditions to achieve the brang-est rrang-esults. In this way, the GA, ACO and PSO parameters are adopted based on works of Kaveh et al. (2010), Kaveh and Talatahari (2010) and Kaveh and Talatahari (2008), respectively. These values are presented in Table 2.
Moreover in all three methods in order to handle the design constraints, an exterior penalty func-tion is used. In this case, the aim of the optimizafunc-tion is redefined by using a penalty funcfunc-tion as
penalized penalty
W X W X f X (23)
where Wpenalized X is the structural penalized weight (objective function) and fpenalty X is the penalty function which can be expressed as follows:
2
1
1
1 , max 0,
nc
penalty j
j
f X v v g X (24)
In the above equation v specifies the total violations of design constraints. Also the constants 1
Latin American Journal of Solids and Structures 12 (2015) 18-36
and Talatahari, 2010). In this paper 1 and 2 are taken as 1 and 2, respectively for all three methods.
M etaheuristic algorithm Values of parameter set
GA crossover fraction =0.8, mutation fraction=0.2
ACO =1, =0.4, =0.25, =0.2
PSO c1=c2=0.8, min=0.4 , max=0.9
Table 2: The parameter data set for metaheuristics.
Due to random nature of metaheuristic algorithms, the optimization problem is solved inde-pendently five times with each method. Five runs of each algorithm seem to be adequate in order to reach the acceptable design and also close to the best design which probably is achieved in an infinite number of runs (Hasançebi et al., 2010). In contrast with metaheuristics, proposed algo-rithm based on the uniform deformation theory is a deterministic method and then the problem is solved once using this method.
5.1 Four-bay three-story steel frame
The geometry and grouping details of the four-bay three-story frame are shown in Figure 1. The 27 members of the frame are classified into five groups, as indicated in the figure. The dead load of QD
=21 kN/m is applied to the first and second story beams, while the dead load of QD =18.2 kN/m is
applied to the roof beams. Also the live load of QL= 4.4 kN/m is considered to all stories beams.
The seismic weights for the structure are considered as 4689 kN for the first and second stories, and 5073 kN for the roof story. For all three metaheuristics, the population size and the total number of generations are considered as 20 and 50, respectively.
Figure 1: A three-story steel moment fram.
Latin American Journal of Solids and Structures 12 (2015) 18-36
method is lighter than the worst results found by all methods. A comparison between the average results of five runs for each of the metaheuristic algorithm indicates that the obtained result using UDT is 12.13% and 1.21% lighter than the average results of GA and ACO, respectively, and it is also 1.11% heavier than the average results of PSO.The convergence history of the proposed meth-od is compared with the metaheuristic algorithms in Figures 2 and 3 for the best and average runs, respectively. As can be seen, the convergence rate in the proposed method is much higher than the metaheuristic algorithms. The proposed method needed 52 analyses for convergence which is lower than 552, 508 and 268 analyses required by ACO, PSO and GA on average, respectively.
Elem ent Group GA A CO PSO
Present W ork (Based on
U D T)
1 HE500B HE900B HE500B HE220B
2 HE650B HE220B HE360B HE650B
3 IPE500 IPE400 IPE600 IPE600
4 IPE600 PG3 IPE600 PG1
5 IPE400 IPE360 IPE360 IPE400
Best weight (kN) 222.61 199.66 201.72 212.98
Average weight (kN) 242.39 215.58 210.01 -
Worst weight (kN) 263.80 231.11 218.55 -
Average no. of
anal-yses 268 552 508 52
Table 3: The performance-based optimum designs for the four-bay three-story frame.
Latin American Journal of Solids and Structures 12 (2015) 18-36
Figure 3: The average convergence history for the three-story steel moment frame.
Figure 4 shows the DCR of element groups in the optimum designs for all methods. It is apparent from the figure that all of the DCRs are lower than one.
Figure 4: DCR of element groups for the three-story steel moment frame.
5.1 Five-bay nine-story steel frame
Figure 5 shows the geometry and grouping details of the five-bay nine-story frame. The frame is composed of 99 members have been classified into nine groups, as illustrated in Figure 5. The dead load of QD =21 kN/m is applied to beams in the first to the eighth stories, while the dead load of
QD =18.2 kN/m is applied to the roof beams. Also the live load of QL=4.4 kN/m is considered to
Latin American Journal of Solids and Structures 12 (2015) 18-36
Figure 5: A nine-story steel moment fram.
Table 4 lists the designs developed by the metaheuristic algorithms in the best run of them, and also by the present work. Proposed design based on the UDT results frame weight of 814.24 kN, which is 17.11%, 7.01% and 0.57% lighter than best design of GA, PSO and ACO, respectively. Propose algorithm reaches to its best design in 37 analyses which is much lower than 2480, 1660 and 1600 analyses required by ACO, PSO and GA on average, respectively. The best and the aver-age convergence history of the metaheuristics are compared with proposed algorithm in Figures 6 and 7, respectively. As can be seen, the optimization based on the UDT has high convergence rate compared to the metaheuristics.
Elem ent Group GA A CO PSO Present W ork
(Based on U D T)
1 HE800B HE600B HE650B HE600B
2 HE450B HE450B HE450B HE400B
3 HE900B HE360B HE360B HE340B
4 HE400B HE280B HE280B HE280B
5 IPE600 PG1 PG1 PG1
6 PG2 IPE600 PG1 PG1
7 IPE550 IPE600 IPE600 IPE600
8 IPE600 IPE500 IPE600 IPE500
9 IPE330 IPE330 IPE450 IPE330
Best weight (kN) 971.53 809.73 875.95 814.24
Average weight (kN) 1072.30 888.07 876.20 -
Worst weight (kN) 1207.08 999.06 876.36 -
Average no. of analyses 1600 2480 1660 37
Latin American Journal of Solids and Structures 12 (2015) 18-36 Figure 6: The best convergence history for the nine-story steel moment frame.
Figure 7: The average convergence history for the nine-story steel moment frame.
Latin American Journal of Solids and Structures 12 (2015) 18-36
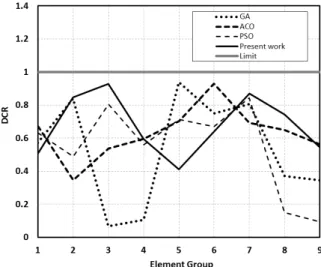
Figure 8: DCR of element groups for the nine-story steel moment frame.
6 CONCLUSIONS
This paper studied the PBDO of a three and nine-story steel moment frame using three metaheuris-tic algorithms including GA, ACO and PSO. Furthermore the results are compared with a proposed method which is based on the UDT. Based on the criteria of PBD codes, presented deformation capacity for different members of the structure is not equal and consequently forming a uniform state of deformation in the whole structure is not possible. For that reason in the proposed method, the COV of DCR approached to zero instead of COV for deformation of the structural element groups, i.e. almost uniform state of damage is formed in the structure. Results demonstrate that the proposed algorithm has high speed to reach acceptable solution in comparison with results of three metaheuristics. Efficiency of the optimization based on UDT is more obvious in design of nine-story frame, where with the growth of the problem size, the required number of population (or number of analyses) in the metaheuristics to reach the optimum design is increased. In addition, unlike the UDT method, metaheuristic algorithms are non-deterministic which are required to solve problem several times and this also increase the number of analyses needed by the metaheuristics to reach the optimum design.
References
Yang, X.S, (2010). Engineering optimization: an introduction with metaheuristic applications, John Wiley & Sons. Kaveh, A., and Talatahari, S., (2010). An improved ant colony optimization for the design of planar steel frames. Engineering Structures 32: 864-873.
Karami Mohammadi, R. (2001). Effects of shear strength distribution on the reduction of seismic damage of struc-tures, Ph.D. Thesis (in Persian), Dept. of Civil Engineering, Sharif University of Technology, Tehran, Iran.
Latin American Journal of Solids and Structures 12 (2015) 18-36 Rahemi, M.A., Moghaddam, H., and Hajirasouliha, I., (2007). Optimum performance-based design of steel moment resistant frames for seismic excitations. In 5th International Conference on Seismology & Earthquake Engineering, Tehran, Iran.
Moghaddam, H., (2009). On the optimum performance-based design of structures. In Proceedings of a U.S.-Iran Seismic Workshop, Irvine, California, PEER report 2009/02.
Hajirasouliha, I., Pilakoutas, K., Moghaddam, H., (2011). Topology optimization for the seismic design of truss-like structures. Computers and Structures 89: 702-711.
Karami Mohammadi, R., Sharghi, A.H., (2014). On the optimum performance-based design of eccentrically braced frames. Steel and Composite Structures 16: 357-374.
FEMA (2006). Next-Generation Performance-Based Seismic Design Guidelines: Program Plan for New and Existing Buildings (FEMA 450), Federal Emergency Management Agency, Washington, D.C.
Gong, Y. (2003). Performance-based design of steel building frameworks under seismic loading, Ph.D. Thesis, Dept. of Civil Engineering, University of Waterloo, Waterloo, Ontario, Canada.
ASCE (2007). Seismic Rehabilitation of Existing Buildings (ASCE/SEI 41-06), American Society of Civil Engineers, Reston, Virginia.
AISC (2010). Specification for Structural Steel Buildings (ANSI/AISC 360-10), American Institute of Steel Construc-tion, Chicago, Illinois.
Kaveh, A., and Shojaee, S., (2007). Optimal design of skeletal structures using ant colony optimization. International Journal for Numerical Methods in Engineering 70: 563-581.
Holland J.H. (1975). Adaptation in Natural and Artificial Systems, University of Michigan Press, Ann Arbor. Camp, C.V., Pezeshk, S., and Cao, G., (1998). Optimized design of two-dimensional structures using a genetic algo-rithm. Journal of Structural Engineering 124: 551-559.
Erbatur, F., Hasançebi, O., Tütüncü, İ., Kılıç, H., (2000). Optimal design of planar and space structures with genetic
algorithms. Computers and Structures 75: 209-224.
Farhat, F., Nakamura, S., and Takahashi, K., (2009). Application of genetic algorithm to optimization of buckling restrained braces for seismic upgrading of existing structures. Computers and Structures 87: 110-119.
Kociecki, M., Adeli, H., (2013). Two-phase genetic algorithm for size optimization of free-form steel space-frame roof structures. Journal of Constructional Steel Research 90: 283-296.
Colorni, A., Dorigo, M., and Maniezzo, V., (1991). Distributed optimization by ant colonies. In Proceeding of the first European Conference on Artificial Life (ECAL-91), Paris, France.
Dorigo, M., Maniezzo, V., and Colorni, A., (1991). The ant system: an autocatalytic optimizing process. Politecnico di Milano, Italy, Technical Report TR91-016.
Camp, C.V., Bichon, B.J., and Stovall, S.P., (2005). Design of steel frames using ant colony optimization. Journal of Structural Engineering 131: 369-379.
Hasançebi, O., and Çarbaş, S., (2011). Ant colony search method in practical structural optimization. International
Journal of Optimization in Civil Engineering 1: 91-105.
Aydoğdu, I., Saka, M.P., (2012). Ant colony optimization of irregular steel frames including elemental warping effect.
Advances in Engineering Software 44: 150-169.
Kennedy, J., Eberhart, R., (1995). Particle swarm optimization. In Proceedings of the IEEE International Conference on Neural Networks, Piscataway, NJ, USA 4: 1942-1948.
Kaveh, A., and Talatahari, S., (2007). A discrete particle swarm ant colony optimization for design of steel frames. Asian Journal of Civil Engineering 9: 563-575.
Latin American Journal of Solids and Structures 12 (2015) 18-36
Luh, G.C., Lin, C.Y., (2011). Optimal design of truss-structures using particle swarm optimization. Computers and Structures 89: 2221-2232.
Kaveh, A., Zolghadr, A., (2014). Democratic PSO for truss layout and size optimization with frequency constraints. Computers and Structures 130: 10-21.
Moghaddam, H., Hajirasouliha, I., (2004). A new approach for optimum design of structures under dynamic excita-tion. Asian Journal of Civil Engineering 5: 69-84.
FEMA (2000). State of the Art Report on Systems Performance of Steel Moment Frames Subject to Earthquake Ground Shaking (FEMA 355C), Prepared by the SAC Joint Venture for the Federal Emergency Management Agen-cy, Washington, D.C.
ASCE (2010). Minimum Design Loads for Buildings and Other Structures (ASCE/SEI 7-10), American Society of Civil Engineers, Reston, Virginia.
Kaveh, A., Farahmand Azar, B., Hadidi, A., Rezazadeh Sorochi, F., Talatahari, S., (2010). Performance-based seis-mic design of steel frames using ant colony optimization. Journal of Constructional Steel Research 66: 566-574. Kaveh, A., and Talatahari, S., (2008). A hybrid particle swarm and ant colony optimization for design of truss struc-tures. Asian Journal of Civil Engineering 9: 329-348.