Adaptive procedure for camber control of forward
cantilever structures
Procedimento adaptativo para controle de contra
lechas durante a fase construtiva de estruturas em
balanços sucessivos
a Departamento de Engenharia Civil, Universidade Federal de Pernambuco, Recife, PE, Brasil.
Received: 31 Aug 2015 • Accepted: 14 Mar 2016 • Available Online: 31 May 2016
Abstract
Resumo
In forward cantilever structures, segments are built from previous ones, therefore construction loads must be carried by the partly completed struc-ture. As the cantilever is moved forward deformations increase and corrections must be made during the construction phase. In camber control, corrective displacements are applied to compensate for deformations. The proposed procedure assimilates topographical survey data collected at each construction stage to update the structural model by minimizing the diferences between real and computed displacements. Concrete mate-rial properties are used as design variables in an optimization process that drives them to values that better represent the matemate-rial actually used in construction. This is an iterative process where new data are assimilated at each new structural deformed coniguration. New camber values are computed and applied to segments that will be cast in the future in order to reach the desired inal design proile. The use of the procedure leads to residual displacements of no greater than 5% of the total deformation without camber.
Keywords: forward cantilever, camber control, optimization.
Na execução do Método dos Balanços Sucessivos, os segmentos são construídos a partir do anterior e os carregamentos de construção são suportados pelos segmentos anteriores. O balanço evolui e as deformações ocorridas aumentam, necessitando aplicar medidas corretivas ainda durante a fase construtiva. O uso de contra lechas introduz deslocamentos corretivos de modo a compensar essas deformações. O método proposto assimila os dados obtidos na leitura em cada etapa executada, e minimiza a diferença entre as deformações reais e previstas. Um programa de simulação utiliza propriedades do concreto como variáveis de otimização e desta forma, o material pode representar melhor aquele utilizado na construção. Esse processo é iterativo e novos dados são assimilados ao problema prevendo uma nova coniguração deformada. Assim, novos valores de contra lechas são determinados e aplicados aos segmentos que ainda não foram executados, a im de atingir a coni-guração de projeto. A aplicação do procedimento permite obter deformações residuais que não ultrapassam 5% da deformação total da estrutura sem contra lechas.
Palavras-chave: balanço sucessivo, contra lecha, otimização.
M. F. L. O. SANTOS a
1. Introduction
The analysis of a project should not be restricted only to the work-ing life of the structure. In some cases, loadwork-ings that occur durwork-ing the construction period greatly inluence both stability and the inal coniguration. Some construction techniques may require more elaborate design procedures requiring additional veriications. This is the case of structures built using the forward cantilever method. In this construction method, the structure is built in successive seg-ments. Each new segment is cast from the previous ones, which must therefore withstand the corresponding construction loads. When the cantilever increases, deformations increase substantial-ly making corrective measures necessary during the construction phase. The use of camber is a procedure whereby correction dis-placements are applied to compensate for the structure deforma-tions in order to preserve the design proile.
In order to calculate camber values it is necessary to compute deformations at each construction phase as well as total dis-placements, since they are required for computing the necessary camber as described in Paim [15], Podolny and Muller [16] and Mathivat [11]. Deformation can be predicted by structural analysis of appropriate models and software. Time-dependent deforma-tions must be taken into account since construction is carried out at diferent stages.
Deformations are monitored at each construction stage. Surveyed data are compared to predicted displacements. Values difer be-cause the concrete properties actually used in construction are dependent on material proportioning, type of aggregate rock and a number of other factors that alter its composition.
Usually residual mismatch from the design proile occurs even when the design camber is applied. Stucchi [4] recommends cor-rections in camber values in the segments yet to be constructed. Oyamada [14] proposes a geometric correction in order that when new segments are cast they conform to the original design proile. Corrections may also be determined by integrating computer simula-tion and construcsimula-tion data monitoring. Lai and Wang [10] use data from deformation control to estimate real construction curves using linear regression analysis and thus adjusting camber values during execution. Jung [9] uses measured displacements and material mod-els together with neural networks to tune time-dependent behavior of the actual concrete applied on site. The material model thus obtained is used to predict long-term displacements of the structure.
This work develops a procedure for camber control during the con-struction phase of forward cantilever structures that ensures proper inal proile coniguration to meet design requirements. Survey data collected at each construction stage are assimilated to the model us-ing nonlinear least square, which minimizes the diferences between real and predicted deformations. Design variables in the optimization process control both short and long-term deformations. The iterative procedure used to minimize displacement mismatch is automatically coupled to the structural analysis program. Taking into account the displacement computational model used by the structural software, the chosen design variables are the characteristic concrete strength at 28 days, fck, which directly inluences the modulus of elasticity, and the relative humidity, RH, which inluences the time-dependent creep and shrinkage deformations.
Through the proposed procedure, it is possible to better represent the properties of the material actually used in the structure. As sur-vey readings are collected at each construction stage the iterative process allows for assimilation of new data gradually approach-ing the characteristics of the material actually employed. By usapproach-ing these updated material properties it is possible to better predict displacements and thus more efectively control the inal desired coniguration.
2. Behavior of bridges constructed
by the forward cantilever method
To better understand the construction using the forward cantilever method, this technique is applied to the construction of bridges. Thus, it is possible to more easily grasp design procedures, the construction process and the consequences of mistakes made in some of those phases.
2.1 The construction technique
Cantilever construction consists of building a bridge deck in a succession of segments, where each segment placed carries the weight of the next segment and, on occasion, the weight of the formwork or of the construction plant [11].
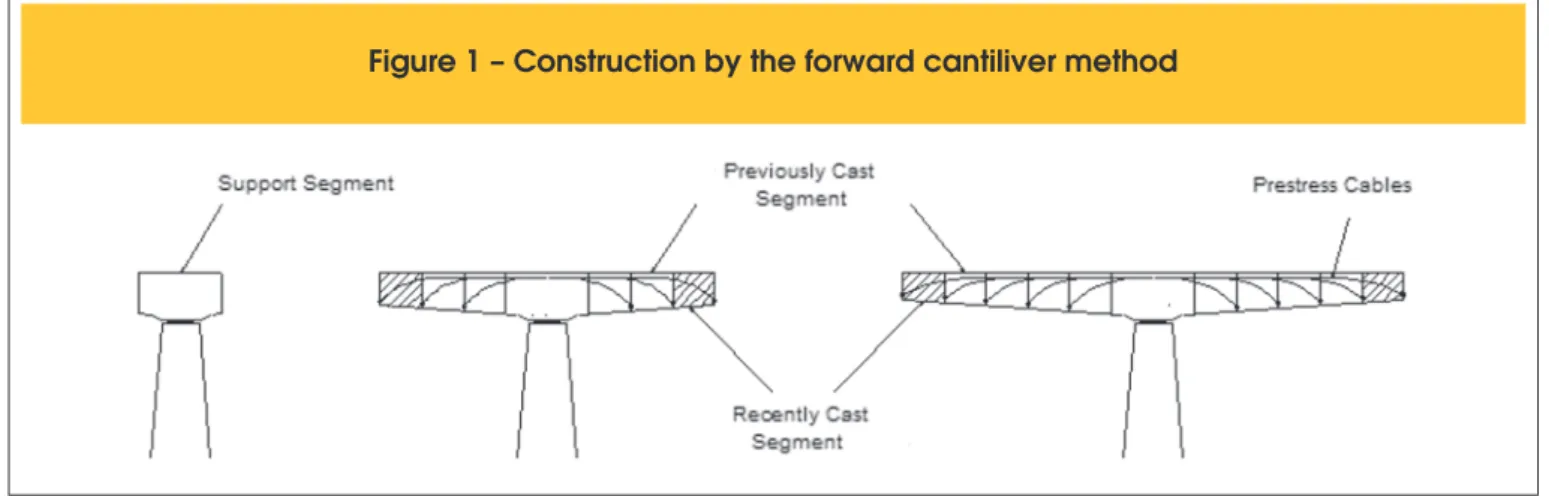
This structure may be described as beam or frame bridge, which during construction uses a cantilever coniguration. The weight on both cantilevers must equilibrate in order to make the structure feasible during construction (Figure 1).
Field monitoring of deformations is carried out during all construc-tion stages. Displacements due to casting of each segment are closely followed in order to avoid excessive deformations. Com-putation of displacements must consider prestressing, dead and construction loads, and creep and shrinkage.
Estimating immediate displacements, due to application of loads, as well as progressive deformations as a result of time efects helps control excessive displacements. Deformations, in order to reach the desired design proile, are compensated by using cam-ber control, which is the application of intentional vertical displace-ments to the structure during the assembly of the formwork in the opposite direction of displacements due to loads.
2.2 Camber
Deformations of forward cantilever construction may achieve sig-niicant values and the application of camber is necessary to reach the desired design proile. The value of the camber is equal to total displacements due to dead loads [12].
The critical problem of in situ casting is the control of these defor-mations that should be considered when calculating displacements. Some displacements are not directly considered in this computation but must not be neglected as additional displacements due to form-work deformations.
Application of camber is controlled through ield measurement during construction by using special spreadsheets. The monitor-ing is performed on all segments along the bridge deck either at daybreak or the end of the day in order to minimize thermal ef-fects. These data allow necessary corrections to be made when level diferences occur during construction in order to prevent casting problems.
2.3 CEB/FIP Code
Computation of deformations uses basic strength of material concepts as well as the CEB-FIP code [6] that is implemented in several structural programs, making it possible to consider time-dependent efects.
Computation of deformations according to CEB-FIP code
Total deformation may be computed by Equation (1) correspond-ing to the sum of immediate deformation that occurs on applica-tion of loads and time-dependent deformaapplica-tions due to creep and shrinkage.
(1)
( )
=
( )
0+
( )
+
( )
+
( )
C
t
Cit
CCt
CSt
CTt
e
e
e
e
e
Where εC(t) = total strain; εCi(t0) = initial strain at loading; εCC(t) =
creep strain at time; εCS(t) = shrinkage strain; εCT(t) = thermal strain.
The irst two deformations are load-dependent while the remaining terms do not depend on loading.
2.4 Material properties
In order to compute deformation it is imperative to establish
ma-terial properties that closely resemble those of the real structure. At the design stage, those parameters must be estimated based on CEB-FIP code equations derived from mathematical models of experimental research.
Modulus of elasticity
The modulus of elasticity is directly inluenced by material strength and, therefore, factors that modify strength also afect it. Although not directly proportional, the modulus of elasticity increases with strength. Tangent modulus of elasticity, ECi, after 28 days, can be computed according to Equation (2):
(2)
(
)
13 0é + ù
= ê ú
ë û
D
ck
Ci C
cmo
f f
E E
f
Where EC0 = 2,15x10⁴MPa; f
ck = characteristic strength in MPa;
Δf = 8MPa; fcmo = 10MPa.
An increase of strength over time afects the modulus of elasticity. The change of modulus with time may be computed by:
(3)
( )
=
( )
Ci E Ci
E t
b
t E
Where ECi(t) = modulus of elasticity as a function of time;
β
E(t) = given by Equation (4):(4)
( )
( )
0.5é
ù
= ë
û
E
t
CCt
b
b
Where
β
CC(t) is given by Equation (5):(5)
1 2
1
28 1 ìé ùü
æ ö ïê úï
ç ÷ ïê úï ïê-ç ÷ úï í ç ÷ ý
ê ú
ï ç ÷ ï
ê ú
ïê è ø úï ïë ûï
î þ
s t t
( )
=
CCt
e
b
Where s = depends on the type of cement; t = age of concrete in days; t1 = one day.
Characteristic compressive strength
The characteristic compressive strength, fck, is measured at 28 days. Change of strength with time may be computed by Equation (6):
(6)
( )
=
( )
cm CC cm
f t
b
t f
2.5 Time-dependent efects
Creep
Creep is the continuous increase of deformations due to a con-stantly applied stress [1]
According to CEB-FIP, creep coeicient is a linear function of stress as long as the limit, |σc|<0.4fcm(t0), is satisied. If this is true then creep deformation, εCC(t,t0), is given by Equation (7):
(7)
( )
( ) ( )
00 0
,
=
c,
CC
Ci
t
t t
t t
E
s
e
f
Where
σ
c(t0) = constant stress;φ
( )
t,t0 = creep coeicient, given by( )
t,t0 =φ
0β
C(
t−t0)
φ
.To compute the creep coeicient it is necessary to determine the theoreti-cal creep coeicient given by Equation (8) and other parameters, such as the relative humidity inluence on the coeicient, given by Equation (9), concrete strength inluence on the coeicient, given by Equation (10), and inluence of initial age of loading, given by Equation (11):
(8)
( ) ( )
0
=
RHf
cmt
0f
f b
b
(9)
0 1 3 01
1
0.46
-= +
æ
ö
ç
÷
è
ø
RHRH
RH
h
h
f
(10)
( )
0.55.3
=
æ
ö
ç
÷
è
ø
cm cm cmof
f
f
b
(11)
( )
0 0.20 1
1
0.1
=
æ ö
+ç ÷
è ø
t
t
t
b
It is also necessary to compute the coeicient that models the in-crease of creep with time after initial loading, given by Equation (12), and the coeicient that models the time-dependent inluence of relative humidity, given by Equation (13):
(12)
(
)
(
)
(
)
0.3 0 1 0 0 1é
-
ù
ê
ú
ê
ú
-
=
-ê
ú
+
ê
ú
ë
û
C Ht t
t
t t
t t
t
b
b
(13)
18 0 0150 1 1.2ìï æ ö üï 2 1500
= í +ç ÷ ý + £
è ø
ï ï
î þ
H RHRH hh
b
Shrinkage
Shrinkage is the decrease in concrete volume during the harden-ing process due to loss of pore water [1]. Development of shrink-age may result in cracking and increase of deleterious stresses. Shrinkage strains, εCS(t,tS), may be computed by Equation (14):
(14)
( )
,
0(
)
=
=
-CS
t t
S CS St t
Se
e b
where εCS0 is the theoretical shrinkage coeicient, computed by
εCS0=εS (fcm) βRH, with additional terms given by Equations (15) e (16):
(15)
( )
=
é
160 10
+
æ
9
-
ö
ù
´
10
-6ê
ç
÷
ú
ê
è
ø
ú
ë
û
cm
S cm SC
cmo
f
f
f
e
b
where
β
SC depends on cement type, and is given by:(16)
1.55
,
40%
99%
0.25, 99%
-
£
£
ì
= í
= +
³
î
sRH RH RHse
RH
se RH
b
b
b
Also, the relative humidity coeicient is given by:
3
0
1
= −
sRHRH
RH
β
Development of shrinkage deformation with time is given by Equa-tion (17) where ts = concrete age at the start of shrinkage.
(17)
(
)
(
)
(
)
0.5 1 2 0 1350
é
-
ù
ê
ú
ê
ú
-
= ê
ú
-æ ö
ê
ç ÷
ú
ê
è ø
ú
ë
û
s s s st t
t
t t
t t
h
h
t
b
3. Data assimilation and history matching
With proper monitoring of displacements over time, it is possible to infer the characteristic concrete material properties actually ap-plied to the structure. Material proportioning, type of aggregates and operational techniques of casting impair particular features to the concrete that may difer from parameters originally adopted at the design stage. This in turn may be conducive to diferences be-tween real and predicted behaviors.
minimized in order to accomplish the desired design proile at the end of construction. Displacement monitoring coupled with an optimization process leads to more representative values of concrete parameters minimizing residual deformation along the construction stages.
The optimization process iteratively determines new values of material parameters and thereby computes new predicted structural displacements. Deformations are computed using SAP2000 [7] and the CEB-FIP code material modeling. Cho-sen design variables are concrete compressive strength, fck, which influences immediate deformations, and relative humid-ity, RH, which influences time-dependent deformations. The particular choice of these parameters derives from the adopted structural analysis code and its time-dependent modeling of concrete deformations.
Once design variables are chosen the optimization may be stated as follows:
(18)
( )
2( )
1
=
=
å
no ii
Minimize
f x
f x
:
L
£
£
u=
1,2
j j j
Subject to
x
x
x
j
Where no = number of observations; x = vector of unknown mate-rial parameters; xiL and x
i
U = lower and upper bounds of the two
material parameters: fck and RH. Parameter bounds are set to val-ues that bracket the material properties of the real structure. In the examples of this study bounds on the compressive strength, fck, are set to 20MPa and 50MPa. For relative humidity, which appears in Equation (16), the adopted values are 40% and 99%.
The mismatch functions fi(x) correspond to the diference between predicted and measured structural displacements at the ends of each segment, at each construction stage, as shown in Equation (19). In order to take into account possible negative values fi(x) is squared in the inal objective function f(x).
(19)
where i = observation index; ypi(x) = predicted displacement, and yri = actual surveyed displacement values.
Usage of actual ield measurements characterizes this problem as model parameters-itting problem. Therefore, Nonlinear Least Squares technique is suitable to efectively solve it. The nonlin-ear relationships between displacements and material parameters make it necessary to adopt a nonlinear solver.
3.1 Nonlinear least squares algorithm
In general, the least squares technique seeks to ind a vector x that minimizes an objective function comprising the sum of the squares of mismatching terms. This is exactly the form of function f in Equation (18). It is a very useful technique in practical prob-lems because it can determine model parameters that best it a given set of experimental results. If the mathematical model of the problem is adequate, the minimum value of the objective function may be expected to be small. If it is assumed that the value of the
objective function is negligible in the solution a very eicient algo-rithm based on Newton’s method can be developed. In fact, in this case second order derivatives may be computed using irst order derivatives only.
The objective function in Equation (18) may be rewritten as:
(20)
( )
( )
2( ) ( )
1
1 1 ,
2 = 2
é ù
=
å
noë û= T ii
f x f x F x F x
( )
=éë1( )
¼( )
ùûT no with F x f x f x
Newton’s method solves the problem by equating to zero the gradi-ent of function f. This results in a nonlinear system of equations. Equation (21) expresses the gradient of f in terms of the Jacobian matrix J(x) of vector function F(x):
(21)
( )
( ) ( )
( )
( )
1=
é
ù
Ñ
=
å
no iÑ
i= ë
û
T if x
f x f x
J x
F x
The Hessian matrix of f is given by:
(22)
( )
( ) ( )
( )
( )
2 2
1 1
= =
Ñ
= Ñ
å
noÑ
T+
å
noÑ
i i i i
i i
f x
f x f x
f x
f x
Assuming that the value of f in the solution approaches zero, it is possible to neglect the second term of the right-hand side of Equa-tion (22). Then, as can be seen from EquaEqua-tion (23), due to the special structure of the problem it is possible to compute second derivatives with irst order information only.
(23)
( )
( ) ( )
( )
( )
( )
2 1 =é
ù
Ñ
= Ñ
å
n iÑ
i=
ë
û
T=
i
f x
f x f x
J x
J x
H x
Using Taylor series expansion of function f at
x
and using Equa-tions (20), (21) and (23), then:(24)
( )
=
1
2
( ) ( ) (
T+
-
)
Té
ë
( )
ù
û
Tf x
F x F x
x x
J x
( ) (
+
1
2
-
)
Té
ë
( )
ù
û
T( )(
-
)
F x
x x
J x
J x x x
The irst order necessary optimality condition requires that the gra-dient vanished at the solution, x*. Using Newton’s method to solve
the system
∇
f(x*) = 0 results in the iterative process shown inEquation (25).
(25)
( ) ( )
1( )
1
-+
=
-
é
ë
ù
û
•Ñ
T
k k k k k
3.2 Optimization using MATLAB
optimization toolbox
The optimization process is implemented using MATLAB Optimi-zation Toolbox [13]. New values for the design variables, which are the two material properties fck and RH, are obtained by mini-mizing the diferences between predicted displacements using the SAP2000 model and real measured deformations. This automatic iterative process allows for computation of new material param-eters that best it the real behavior up to the current construction stage and are inserted into the structural model to predict new dis-placement curves for future stages.
MATLAB Function lsqnonlin
MATLAB function lsqnonlin is the tool of choice to solve the mini-mization problem of Equation (18). This function uses a Nonlinear Least Squares technique to solve the problem:
(26)
( )
( )
22
min
å
i=
min
x i
f x
xF x
Function syntax is:
[x, resnorm, residual, exitlag, output] = lsqnonlin (fun, x0, lb, ub, options)
where the output components at in the solution are: x = solution vector of design variables; resnorm = value of the objective function which is sum of the squares in individual; residual = residual values; exitlag = describes solution status; output = output structure detailing the optimi-zation history. The input components are fun = name of the function that
returns each individual residual shown in Equation (27) (sum of squares should not be informed); x0 = initial vector of design variables; lb and ub = vectors of lower and upper bounds on design variables; options = structure containing option speciications for the solver.
(27)
In order to compute the residual values one must have real and predicted values for structural displacements. SAP2000 model is used to compute the predicted displacements and is automatically called from inside the supplied function subroutine fun.
3.3 Computing displacements with SAP2000
Computation of predicted displacements with SAP2000 requires a structural model template. Design variables are fed into the tem-plate to create an input ile for analysis. The input ile activates the export of output displacement in EXCEL spreadsheet format. The MATLAB interface reads the spreadsheet ile and creates the nec-essary displacement vectors for the optimization process.
This process is iterative and automatic. A result of the optimization process updated values of the design variables, fck and RH, are computed by assimilating ield measurements and producing de-formation curves that better it actual structural behavior.
4. Camber computation and correction
Displacement control is an essential serviceability requirement for
A
B
all structures. Those built by the forward cantilever technique re-quire camber control, which is applied through corrective displace-ments that compensate for cantilever deformations so that inal design proile is achieved.
4.1 Methods of camber computation
It is essential to estimate structural displacements. Camber curve
is the sum of deformations as a result of casting successive seg-ments, i.e., it is the mirror image of total displacements [16] (see Figure 2).
Use of camber diagrams may cause problems since its applica-tions depend on constructor experience. Absolute coordinates are not used because the system changes at each construction stage. It is, therefore, advisable to use relative camber which is imposed displacements relative to the previously cast segment.
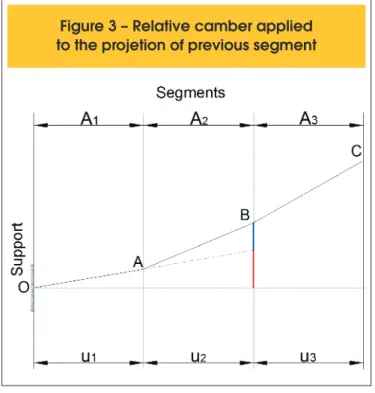
Figure 3 presents the relative camber applied to section B at cast-ing time of segment A2, which corresponds to the blue portion of the vertical line through B. Relative camber is positioned over the projection of the axis of segment A1 that is represented by the red portion of the vertical line. Absolute camber is the sum of the two portions, blue and red, and equals the summation of all displace-ments at section B.
Modiied Paim [15] methodology is used to compute the neces-sary camber. Construction stage index is denoted by i, whereas j denotes the end section of segment j. Hence, the displacement at section j due to isolated action of loads pertaining to stage i only is denoted by yij. In those segments still to be constructed, these values are deined by tangential extension of the deformed axis, as illustrated in Figure 4.
Using the isolated displacements it is possible to compute the ac-cumulated displacements, Yaij, at end j, at each construction stage i, as given by Equation (28):
(28)
1
=
=
å
iij kj
k
Ya
y
Total displacement, Yj, is the sum of all isolated displacements over the total number of construction stages, n, as given below:
(29)
1=
=
å
nj kj
k
Y
y
In order to compute the relative camber for the casting of a new segment, it is necessary to know the position of node j, yet to be executed, according to the tangential extension of the previous segment, (j-1), at stage (i-1). It is then necessary to compute the position of node j up to casting of the previous stage, (i-1). The position of segments during construction is the accumulated dis-placement curve, including relative camber application, computed by Equation (30):
(30)
( )
( )
( )
÷÷øö ç
ç è æ
-+ ÷ ø ö ç
è æ
-=
÷ ÷ ø ö ç
ç è æ
-1 1 camberstageiup1to
relative of Sum i
stage at ddisplacement Accumulate
i stage at relativecamber including ddisplacement Accumulate
( ) ( )
( )1
1 1
1
--
-=
=
+
å
i kji j i j k
Z
Ya
cf
where Z(i-1)j = accumulated displacement at node j, including cam-ber, up to stage (i-1), stage preceding the one being considered; Ya(i-1)j = accumulated displacement at node j up to execution of
Figure 3 – Relative camber applied
to the projetion of previous segment
stage (i-1), and (i 1) kj k 1 cf − =
∑ = accumulated relative camber at node j up to execution of stage (i-1).
At the execution of the irst segment, since there are no previous displacements, Z1j=0.
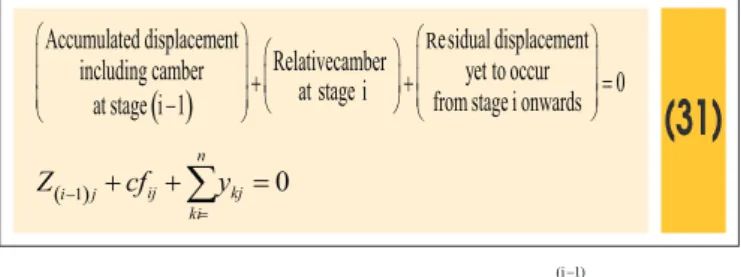
Knowing the present position of node j it is possible to determine the relative camber to be applied to this node at stage i to honor the design proile from the displacements that will occur in the future, from stage i onwards, through Equation (31):
(31)
( )
Accumulated displacement
Residualdisplacement
Relativecamber
including camber
at stage i
yet to occur
0
at stage i 1
fromstagei onwards
æ ö æ ö
æ
ö
ç ÷ ç ÷
+
ç
÷
+
=
ç ÷ ç ÷
è
ø
ç ÷ç
-
÷ è øè ø
( )-1
0
=
+
ij+
å
n kj=
i j
ki
Z
cf
y
Where cfij = relative camber at node j at stage i;
(i 1) kj k 1cf
-=
å
= residual displacement still to occur from stage i onwards.Therefore, it is possible to compute the relative camber at node j at the execution of stage i using Equations (30) and (31), as:
(32)
( ) ( )
( )1
1 1 1 -- -= = =
æ
ö
æ
ö
= -
ç
+
÷
= -
ç
ç
+
+
÷
÷
è
å
ø
è
å
å
ø
i
n n
ij i j kj i j kj kj
k i k k i
cf
Z
y
Ya
cf
y
Using Equation (28) the accumulated displacement corresponding to the previous stage, Ya(i-1)j, can be computed as:
(33)
( ) ( )1 1
1
-=
=
å
i kj i jk
Ya
y
Substituting Equation (33) into (32) and using Equation (29), then:
(34)
( )1 ( )1 ( )1 ( )1
1 1 1 1 1
- - -
-= = = = = =
æ
ö
æ
ö
æ
ö
= -
ç
ç
+
+
÷
÷
= -
ç
ç
+
÷
÷
= -
ç
ç
+
÷
÷
è
å å å
ø
è
å å
ø
è
å
ø
i i n i n i
ij kj kj kj kj kj kj j
k k k i k k k
cf
y
cf
y
cf
y
cf Y
Hence, the relative camber to be applied at node j, at construction stage i, may be computed by:
As execution of segment j occurs at stage i=j, the tangential extension at nodes starting form (j+1), for stages form i to n, is a linear function of the relative camber applied to node j, as given by Equation (35):
(35)
=
=
iiå
j>
ij k
ki i
cf
cf
u if j i
u
where cfii = is the relative camber at the end of the executed seg-ment at stage i, i.e., when i=j; ui = length of segment i.
Similar methodologies for camber computation can be found in [11] and [16].
4.2 Camber adjustment during construction
Residual deformation with respect to design proile occurs even with application of camber speciied in the design documents. Problems during construction or mischaracterization of materials actually employed result in diferences between predicted and real displacements. Field monitoring of displacements allows for iden-tiication of camber correction needs for segments yet to be exe-cuted. Therefore methods for possible correction of camber values during construction should be developed.
4.3 Proposed procedure for camber control
during construction
A procedure for adaptive camber adjustment during construction using the Nonlinear Least Squares technique is proposed below to reine the estimation of displacements. Field survey data of displacements are assimilated and material properties values are reined allowing for bet-ter deformation prediction and thus improved camber speciication. The sequence of steps of the proposed procedure is given below:
1. To construct the structural model of the forward cantilever bridge computing the original design values of displacements in EXCEL spreadsheet format;
2. To determine the original design camber values based on the modi-ied Paim methodology given above.
Next procedure steps comprise an iterative process for camber adjust-ment after the execution of each new segadjust-ment. Therefore, the num-ber of steps depends on the numnum-ber of segments.
3. To execute segment j (j=1..n) and measure displacement at the
Table 1 – Accumulated displacements
for execution up to j = 3
Stage Node 1 Node 2 Node 3 Node 4
1 Ya11 – – –
2 Ya21 Ya22 – –
3 Ya31 Ya32 Ya33 –
4 – – – –
Table 2 – New accumulated displacements
for execution up to j = 3
Stage Node 1 Node 2 Node 3 Node 4 Node 5
1 Ya11 – – – –
2 Ya21 Ya22 – – –
3 Ya31 Ya32 Ya33 – –
4 Ya41 Ya42 Ya43 Ya44 –
ends of all previously built segments. Isolated displacements that occur up to execution of current segment are computed. Accumu-lated displacements are determined according to Equation (28) and are assimilated through the optimization process. Table 1 illustrates an example of accumulated displacements for execution up to the third segment;
4. To assimilate displacement data up to segment j. This step makes use of the optimization procedure implemented in MATLAB. Dis-placement data are processed minimizing deformation mismatch and, thereby, obtaining new reined values for material properties, fck and RH that are more representative of the actual applied concrete; 5. New reined values of material properties are automatically fed into
the structural model;
6. The new model is analyzed and a new accumulated displacement coniguration is predicted for the whole structure (see Table 2); 7. To determine new camber values for segment j+1. Table 3 presents
isolated displacements considering the updated model, in black, displacements that have already taken place, in red, and tangential extensions for the yet to be cast segments, in gray.
It is possible to compute new values of total displacements already incorporating actual measured deformations using Equation (29). By applying these results in Equations (34) and (35) it is possible to compute new camber values, in blue, and their tangential exten-sions, in gray, as illustrated in Table 4. In these calculations actual values of camber applied to already cast segments must be kept unchanged, in red.
8. On execution of the last segment, corrections can no longer be made and inal values of material properties should be more
repre-Table 3 – Isolated displacements
for the updated model
Stage Node 1 Node 2 Node 3 Node 4 Node 5
1 y11 (y12) (y13) (y14) (y15)
2 y21 y22 (y23) (y24) (y25)
3 y31 y32 y33 (y34) (y35)
4 y41 y42 y43 y44 (y45)
5 y51 y52 y53 y54 y55
Figure 5 – Geometry of bridge
Table 4 – New relative camber
after update the model
Stage Node 1 Node 2 Node 3 Node 4 Node 5
1 cf11 (cf12) (cf13) (cf14) (cf15)
2 – cf22 (cf23) (cf24) (cf25)
3 – – cf33 (cf34) (cf35)
4 – – – cf44 (cf45)
sentative of the actual concrete used in the bridge.
Use of the material properties for a longer-term prediction of dis-placements may require more elaborated material models.
5. Results and discussion
The proposed procedure is applied to a synthetic case. The struc-ture is a bridge built according to the forward cantilever technique adapted from Oyamada [14].
5.1 Problem deinition
Geometry
The bridge has a total length of 100m, consisting of three spans
25m, 50m, and 25m (see Figure 5). Side spans are divided into ive segments of diferent lengths, two 4m long and three 5m long. Closure segments are cast in situ linking the structure to the abut-ments. The central span is divided into ten segments plus closure. Segment arrangement for each half-span is identical with side spans. The deck is 7.5m wide and the cross-section is variable, as can be seen in Figure 6.
Materials
Design material speciications are given below: 1. Characteristic compressive strength: fck = 30MPa 2. Normal hardening cement: α = 2
3. Relative humidity: RH = 70%
4. Prestressing steel: CP190RB 5. Cables: 10 ϕ 12.5mm
Loads
The model considers four loading cases and takes into account the time-dependent efects of creep and shrinkage.
1. Dead Loads – Self-weight;
2. Prestressing – Initial presstressing force of 2888kN per cable; 3. Formwork – For segments 1 and 2 = 200kN vertical force and
400kN-m moment; other segments = 200kN vertical force and 500kN-m moment.
4. Wet Concrete – temporary weight of cast concrete applied to the previous adjoining segment. It becomes dead load after concrete hardening.
5. Creep and Shrinkage – CEB-FIP model is used to compute time-dependent displacements as well as prestressing loss.
Construction stages
The main characteristic of this structure is staged construction and this is taken into consideration in the model.
Once the design model is concluded and analyzed the initial de-sign camber values are shown in Table 5.
5.2 Simulation data for “real” displacements
In order to simulate ield measurements, regarded here as “real” displacements, two cases with diferent pairs of fck and RH values, diferent from the original design data, are considered as detailed below:
Case A: fck = 36MPa; RH = 80%. Case B: fck = 26MPa; RH = 60%.
Case A represents the situation where actually applied concrete in
the bridge is stronger and relative humidity higher than the original design data. Case B represents the opposite situation where con-crete strength and relative humidity are lower than considered in the original design.
Case A
The camber control process is started with original design values for fck and RH. Displacement at each construction stage is as-similated and new values for these two properties are obtained. Subsequent displacement predictions are based on the updated values, simulating real construction camber control. Design vari-ables at the execution of the last segment are fck = 32,2 MPa and RH = 83,7%.
A study comparing the results of the application of the corrected and original uncorrected design camber is discussed in the sequel. Table 6 presents values of residual displacements that occur after application of both camber strategies, Znj. Percent ratio between residual displacements and structural total displacements, Yj, is presented for both uncorrected and corrected cambers. . It can be seen that, as construction advances, residual deformation de-creases so that it is lower than 3% for corrected camber whereas reaches 12% for the uncorrected case, at the last node.
Case B
A similar study is carried out. At the execution of the last seg-ment reined property values are fck = 24,7 MPa and RH= 50%. Comparative values of residual displacements are presented in Table 7. Results are similar to those of Case A with slightly bet-ter accuracy. For the last node the residual displacement percent ratio for uncorrected camber is 0.10%, while for the uncorrected case it is 7.93%.
6. Conclusions
Structures built by the forward cantilever technique require camber control in order to achieve the design proile. The computation of cam-ber, in turn, requires reined prediction of displacements during the staged construction. Design displacements are based on assumed material properties, which depend on the kind of aggregate and pro-portioning details that are generally not available at the design stage. The proposed procedure adaptively reines the material properties based on the monitoring of ield displacements and an optimization
Table 5 – The initial design
camber values (cm)
Node 1 Node 2 Node 3 Node 4 Node 5
Camber cf11 =
0,12
cf22 = 0,30
cf33 = 0,74
cf44 = 1,30
cf55 = 2,48
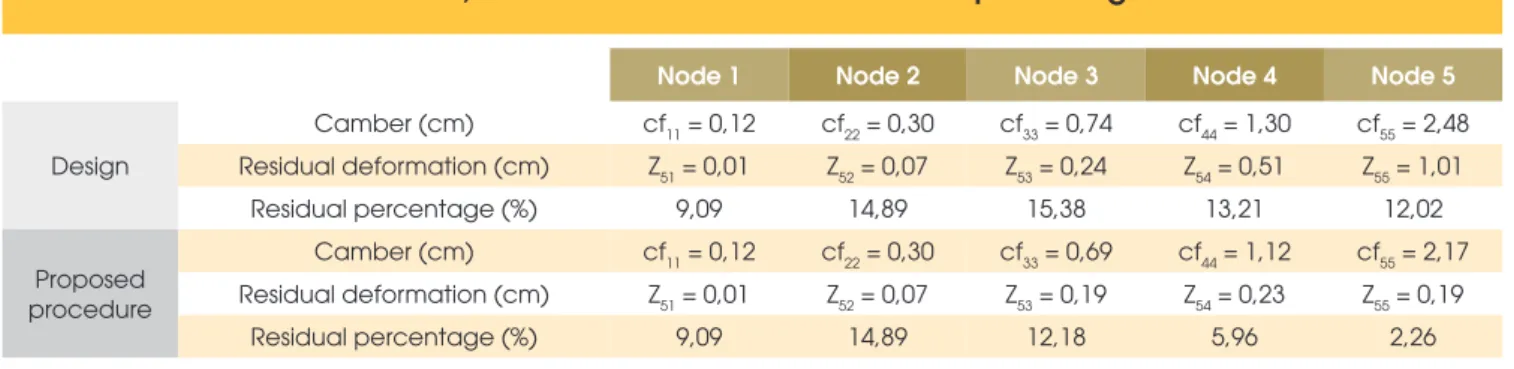
Table 6 – Camber, residual deformation and residual percentage to Case A
Node 1 Node 2 Node 3 Node 4 Node 5
Design
Camber (cm) cf11 = 0,12 cf22 = 0,30 cf33 = 0,74 cf44 = 1,30 cf55 = 2,48
Residual deformation (cm) Z51 = 0,01 Z52 = 0,07 Z53 = 0,24 Z54 = 0,51 Z55 = 1,01
Residual percentage (%) 9,09 14,89 15,38 13,21 12,02
Proposed procedure
Camber (cm) cf11 = 0,12 cf22 = 0,30 cf33 = 0,69 cf44 = 1,12 cf55 = 2,17
Residual deformation (cm) Z51 = 0,01 Z52 = 0,07 Z53 = 0,19 Z54 = 0,23 Z55 = 0,19
process that uses the Nonlinear Least Squares Technique to minimize the mismatch between predicted and real displacements.
The presented synthetic example corroborates that as more data are assimilated by the proposed procedure the closer the unknown material parameters approach the actual properties of the applied concrete. Therefore, the proposed tool allows concrete properties to be better characterized for the given structural software through a learning process as construction progresses.
The procedure assumes that diferences between real and mea-sured displacements are due to material model inaccuracies. If major formwork misalignment is detected during construction ad-ditional corrective measures should be applied.
With the proposed corrective procedure for camber control, it is possible to reach the desired design proile with high accuracy. As demonstrated by the synthetic example in the irst stages residual deformations may reach 10% of the total structural displacements. This is not particularly detrimental because those are very small dis-placements. As construction progresses and more data are assimi-lated material properties are updated and residual displacements are lower than 5% of total displacements. This is signiicant because those are the sections undergoing the largest deformations. The proposed camber correction procedure produces smaller residual deformation than the original design uncorrected values.
The considered material model is adequate for camber control dur-ing the construction phase. In order to use the inal reined values for long-term displacement predictions more reined material mod-els must be adopted.
7. Acknowledgements
The authors wish to thank the Graduate Program in Civil Engineer-ing of the Federal University of Pernambuco as well as CNPQ and CAPES for their inancial support that allowed the development of this research. We would also like to thank professors Fernando Stucchi and Paulo Ribeiro for their contribution to this work.
8. References
[1] ARAÚJO, J. M. Curso de concreto armado, v.1, Rio Grande: Dunas, 2ed, 2003, 222 p.
[2] BAZANT, Z. P. Theory of Creep and Shrinkage in Concrete Structures: A Précis of Recent Developments. Mechanics Today, v. 2, New York: Pergamon Press, 1975, 93 p. [3] BAZANT, Z. P. Mathematical Modeling of Creep and
Shrink-age of Concrete, Canada: John Wiley & Sons, Inc., 1ed, 1988, 215p.
[4] BERGER, D., WAIMBERG, M., STUCCHI, F. R. Design and Executive Control of three curved box girder bridges in São Paulo, In: ib International Congress and Exhibition, 3º, Washington, 2010.
[5] BERGER, D., STUCCHI, F. R., HERNANDO, C., RIBEIRO, C. F.. Executive Control Cable-Stayed Bridge Octávio Frias de Oliveira. In: FIB Symposium, 2009 – Concrete, 21º, Lon-don, 2009, Superhero, LonLon-don, 2009.
[6] COMITE EURO-INTERNATIONAL du BETON, FÉDÉRA-TION INTERNAFÉDÉRA-TIONALE DE LA PRÉCONTRAINTE. CEB-FIP Model Code 1990. Design Code. Lausanne, 1993. [7] COMPUTERS AND STRUCTURES, Getting Started with
SAP2000 Linear and Nonlinear Static and Dynamic Analy-sis and Design of Three-Dimensional Structures. Berkeley: Computers and Structures, Inc., 2009, 60p.
[8] ________. Introduction to SAP2000/Bridge. Berkeley: Com-puters and Structures, Inc., 2009, 41p.
[9] JUNG, S. Field Calibration of time dependent behavior in segmental bridges using self-learning simulation. Illinois, 2004, Doctorate thesis, University of Illinois at Urbana-Champaign - Graduate College of Civil and Environmental Engineering, 140p.
[10] LAI, J.; WANG, W. Study on Pre-camber Control for Over-pass Bridge: Balanced Cantilever Bridge as an Example. 2010
[11] MATHIVAT, J. The cantilever construction of prestressed concrete bridges, New York: A Wiley- Interscience Publica-tion, John Wiley & Sons, Inc., 3ed, 1983, 341p.
[12] MENN, C. Prestressed Concrete Bridge. Translated by: Paul Gauvreau, Boston: Basel, 1ed, 1990, 535p.
[13] MATHWORKS, Optimization Toolbox™ User’s Guide. Mas-sachusetts: The MathWorks, Inc., 2013, 276p.
[14] OYAMADA, R. N. Controle de Flecha e Adaptação por Fluência em Pontes Construídas pelo Método do Balanço Sucessivo. São Paulo, 2004, Doctorate thesis, Polytech School, University of São Paulo – Department of Structures and Foundations, 182p.
[15] PAIM, O. D. Projeto e Dimensionamento de Pontes em Bal-anços Sucessivos. In: Seminário de Concreto Protendido, Rio de Janeiro, 1983, Anais da Associação Brasileira de Pontes e Estruturas, Rio de Janeiro, 1983, v.1, 123-206p. [16] PODOLNY, W. Jr.; MULLER, J. M. Construction and Design
Table 7 – Camber, Residual deformation and Residual percentage to Case B
Node 1 Node 2 Node 3 Node 4 Node 5
Design
Camber (cm) cf11 = 0,12 cf22 = 0,30 cf33 = 0,74 cf44 = 1,30 cf55 = 2,48
Residual deformation (cm) Z51 = - 0,01 Z52 = - 0,05 Z53 = - 0,18 Z54 = -0,41 Z55 = - 0,81
Residual percentage (%) 7,69 8,47 9,09 8,58 7,93
Proposed procedure
Camber (cm) cf11 = 0,12 cf22 = 0,30 cf33 = 1,01 cf44 = 1,23 cf55 = 2,60
Residual deformation (cm) Z51 = - 0,01 Z52 = - 0,05 Z53 = - 0,09 Z54 = - 0,06 Z55 = - 0,01
of Prestressed Concrete Segmental Bridges, Canada: John Wiley & Sons, Inc., 1ed., 1982, 205-208 and 482-487p. [17] SANTOS, M. F. L. O. Projeto e Execução de Pontes em