Numerical analysis of wafle slabs in lexure considering
the effects of concrete cracking
Análise numérica de lexão em lajes nervuradas com a
consideração dos efeitos de issuração no concreto
Abstract
Resumo
Wafle slab structures simulated by computational model are generally analyzed by simpliied methods, for both the section geometry (converting into solid slabs or grids) and for the material mechanical properties (linear elastic regime). Results obtained by those studies show large differ
-ences when compared with test results, even at low loading levels. This is mainly due to lack of consideration of the eccentricity between the axis of the ribs and the cover, as well as the simpliication of the mechanical behavior of concrete tensile strength. The so called more realistic numerical models do consider the effect of the eccentricity between the axis of the cover and ribs. One may also introduce physical nonlinearity of reinforced concrete in these models, obtaining results closer to tests.
The objective of this work is to establish a numerical model for the typical section of wafle slabs given the recommendationslisted above. Such model considers the eccentricity between the axis of the ribs and the cover, the physical nonlinearity of concrete in compression and the concrete contribution between cracks (tension stiffening) through a smeared crack model.
The inite element program SAP2000 version 16 is used for the non-linear analysis. The area element discretization uses the Shell Layered ele
-ment along the thickness of layers, allowing for the heterogeneous material behavior of the reinforced concrete. The numerical model was vali
-dated comparing results with tests in slabs and, eventually, used to evaluate some wafle slabs subjected to excessive loading.
Keywords: wafle slab, reinforced concrete, numerical model, non-linear analysis.
As estruturas de lajes nervuradas simuladas por modelo computacional geralmente são analisadas por metodologias simpliicadas, tanto para a geometria da seção (convertendo em lajes maciças ou grelhas) como para as propriedades mecânicas dos materiais (regime elástico-linear). Os resultados obtidos por estes estudos teóricos apresentam grandes diferenças quando comparados com os valores dos ensaios experimentais, mesmo para baixos níveis de carregamento. Isto se deve principalmente pela não consideração da excentricidade entre os eixos da nervura e da capa como também a simpliicação do comportamento mecânico do concreto à tração. Modelos numéricos chamados realísticos consideram o efeito da excentricidade entre os eixos da capa e da nervura da seção transversal. Pode-se, ainda, introduzir a não-linearidade física do concreto armado nestes modelos, obtendo resultados próximos do experimental.
O objetivo deste trabalho é estabelecer um modelo numérico para a seção típica de laje nervurada que leve em consideração a excentricidade
B. R. B.RECALDE a
F. P. S. L. GASTAL a
V. R. D’A BESSA a
P. F. SCHWETZ b
1. Introduction
Reinforced concrete wafle slabs are structural elements formed by a set of ribbed beams joined by a top concrete slab, to optimize the use of concrete and steel.
Classical methods used for the analysis of solid slabs are still em
-ployed to obtain an equivalent behavior of ribbed slabs. However, signiicant differences in lexural and torsional stiffness between these two structures cannot be ignored. Because of these differ
-ences, ribbed slabs have been studied in an experimental, analyti
-cal and numeri-cal approach over the last years.
Recent studies show important experimental programs, providing technically reliable data, that may support the validation of numeri
-cal models under development, as in Borges [1] and Schwetz [2], both used to validate the proposed model.
Quite a few of the existing numerical models do not consider the crack
-ing behavior of concrete and perform only linear analyzes (Dias [3], Stramandinoli [4], Araújo [5] and Donin [6]). Others do, but take con
-crete as a homogeneous material with no regard to the reinforcement (Rebelo & Duarte Filho [7] Oliveira et al [8]). The use of these models, show signiicant stiffness differences when compared to experimental results. To overcome that and approach test results, some authors proposed changing the structure’s bending and twisting inertia. The present work aims to establish a numerical model to realis
-tically analyze the mechanical behavior of wafle slabs used in structural systems of different geometric conditions and levels of static loading. The proposed model takes into account the eccen
-tricity between the top concrete slab and the axes of the ribs, the physical nonlinearity of concrete in compression and the collabo
-ration of concrete between cracks, considering the reinforcement independently. The computational program employed was the SAP2000 Version 16, using an area element called Shell Layered.
This element allows considering the heterogeneity of concrete by discretization along the layers.
2. Methods used to analyze wafle slabs
The methods used for the analysis of wafle slabs may be divided
into simpliied and realistic. Simpliied methods transform ribbed slabs in a solid slab with equivalent stiffness or in an equivalent grill, while realistic methods consider the effects of the eccentricity between the top slab and the ribs.
According to Dias [3], however, some simpliied methods do ac
-count for the eccentricity between the top slab and the ribs, when considering “T” section beams to obtain an equivalent thickness for a solid slab or grid.
There are several numerical models of the realistic type, such as those proposed by Dias [3] and Schwetz [2], showing better perfor
-mance when compared to the simpliied ones. In both cases, the authors concluded that the model shown in Figure 1, consisting of separate area inite elements to independently model top slab and ribs, is a model with good performance for numerical analysis of wafle slabs. Both authors validated this numerical model in linear elastic analysis from experimental tests. They showed results simi
-lar to the tests in lexural behavior for loads in the linear range, but different values for a nonlinear analysis.
Supported on such results, the proposed numerical model uses area inite elements and the numerical analyzes is performed us
-ing the SAP2000 program, version 16 (Software Integrates for
Structural Analysis & Design).
2.1 Constructing the proposed model
in the program SAP2000
Both top slab and ribs are represented by Shell Layered inite ele
-ments. These elements, layered along the thickness, allow for the discretization of concrete and steel material properties. Element forces are based on the Mindlin Theory[9], and the elements have four nodes and ive degrees of freedom per node. Thickness is divided into two layers of concrete and a middle one representing the reinforcement, as in Figure 2.
The cross section of a wafle slab is therefore represented by ele
-ments arranged horizontally for the top slab and vertically for the ribs. The nonlinear analysis uses the Initial Stiffness Method and, when there is no convergence, the Newton-Raphson Method. Nonlinear physical properties of materials are deined by their constitutive
models: an elastic-plastic stress-strain relation for steel, Drucker-Prager relation for concrete in compression and, in tension, a lin
-ear-elastic relation before cracking.
Concrete cracking is modeled by the distributed cracking model proposed by d’Avila [10], as illustrated in the following section.
2.2 Distributed cracking model proposed
by d’Avila [10]
The tensile behavior of concrete is represented by the model of distributed cracking proposed by d’Avila [10], based on the Model Code CEB-FIP-90 [11], which accounts for the concrete contribu
-tion between cracks, known as Tension-stiffening.
After cracking, the concrete stress-strain diagram is represented by a multilinear softening behavior, as shown in Figure 3.
The determination of the
f
t ,i and parameters, for each area of the diagram in Figure 3, is done by the analysis of reinforced concrete ties with the same reinforcement ratio used in the tensile zones.The ultimate cracking deformation, for each zone, is related to the reinforcement ratio in the tensioned area. According to the Model
Code CEB-FIP-90 [11] the effective depth of the tensioned zone is given by:
(1)
where “h” is the total depth, “d” the effective depth and “x” is the compressive zone depth of the structural element.
Each region represents a stage in the behavior of cracked rein
-forced concrete. The behaviors that represent each region deined by d’Avila [10] are:
n 1° region: related to the cracking formation period, causing a
gradual reduction in tension with the increasing of deformation;
n 2° region: related to the stabilized cracking period, character
-ized by an increase of deformation with constant tension;
n 3° region: related to the reinforcement post-yielding period,
with reduction in tension with increasing of deformation. The ultimate deformation of the irst stage,
ε
cr 1ult( ) and the tensiont ,i
f
are related to the inal period of cracking formation. In theFigure 2 – Element shell-layered
Figure 3 – Distributed cracking model
proposed by d'Avila [10]
second stage, stabilized cracking, the tension remains constant while the deformation increases until the ultimate value of
ε
cr 2ult( ),corresponding to reinforcement yielding. At last, the deformation of the third stage corresponds to the reinforcement post-yielding with the value of 10‰.
The equations to determine the parameters of the tri-linear curve of the model can be found in d’Avila [10].
3. Numerical analysis of tested slabs
To help validating the proposed numerical model, three different wafle slabs were numerically analyzed and compared to experi
-mental results obtained by other authors.
3.1 Numerical analysis of the slabs tested
by Borges [1]
The slab reference (REF) tested by Borges [1] is a 1800mm wide square slab with four ribs in each direction, as shown in Figure 4 (a). The top slab is 40mm thick, the ribs have 70mm width and 150mm height. This slab is small compared to those used in usual engineering projects, however, the top-thickness/
slab-height relationship, of 0.27, lies within the commercial
range of 0.19 to 0.38. Also, the distance between axes/width
relationship for the ribs, of 7.61, is in the range of commercial use, from 5.29 to 8.02.
The slab is reinforced by a top mesh of Ø5 mm CA 60 steel, every 150 mm, in both directions, as in Fig 4(b). The ribs have a single
bottom bar of Ø10 mm CA 50.
The tested slab was simply supported at all edges, load was incre
-mentally applied in four equal stages, on the four rib intersections, as detailed in Borges [1].
The numerical model simulation used a 324 (18x18), 10x10 cm wide, inite elements mesh for the top slab (Figure 5). The eight ribs had meshes of 72 (18x4) elements with 10 cm width and vari
-able height, as shown in Figure 6.
The mechanical material properties, obtained in Borges[1], are listed below.
For the compressed concrete: fc=33,8 MPa and Ec=26100 MPa.
For the Ø5 mm reinforcement: Es= 261000 MPa; fy,s=548 MPa and
fu=685 MPa.
For the Ø10 mm reinforcement: Es= 256000 MPa; fy,s=579,2 MPa and fu=726,2 MPa.
The stress-strain values for tensile concrete are shown in Figure 7, which represents the zone related to non-cracked concrete (initial zone with stress varying from zero to ft,m=3,0 MPa ), and the three
zones related to the cracked concrete (Figure 3). Values deining the limits of each zone are shown in Table 1.
Figure 5 – Finite element mesh for top slab
Figure 7 – Stress-strain relationship
for tensile concrete – REF
Table 1 – Eccentricities under column supports
Values of MFD for ribs
(strain) Values of MFD for top slab (strain) Stress (MPa) Zone
1,15E-04 1,15E-04 3,00 –
4,35E-04 7,83E-04 1,20 1
2,19E-03 2,04E-03 1,20 2
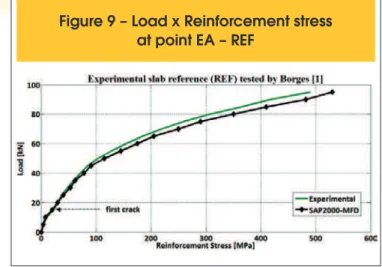
Numerical integration for stresses and internal forces used 3x3 Gauss integration points for concrete and 2x2 for the reinforcement. Figure 8 shows the center slab displacements under loading. Good agreement is found, since the largest difference between numerical and experimental results is less than 20%. The rib reinforcement strength, point EA of Figure 4(a) was also ad
-equately simulated, with a maximum difference of 8%, as seen in Figure 9.
3.2 Numerical analysis of the slabs tested
by Abdul-Wahab & Khalil [12]
Three 154 cm square simply supported slabs, called S2, S5 and S6, were chosen to validate the presented model. They have eight internal ribs in each direction, apart by a distance a1 = 16.7 cm, as
shown in Figure 10. The igure also shows a rigid 30x30 cm plate,
placed at the center of the slab, used for applying the test load, as well as the slab reinforcement details. The slabs differ only in the rib dimensions, shown in Table 2.
Figure 8 – Load x Displacement at center
slab – REF
Figure 9 – Load x Reinforcement stress
at point EA – REF
e 10 – Slabs tested by Abdul-Wahab and Khalil (2000)
Table 2 – Slab dimensions of Abdul -Wahab
& Khalil [12]
Slab number Rib thick(mm) Slab thickh (mm)
S2 52 95
S5 57 125
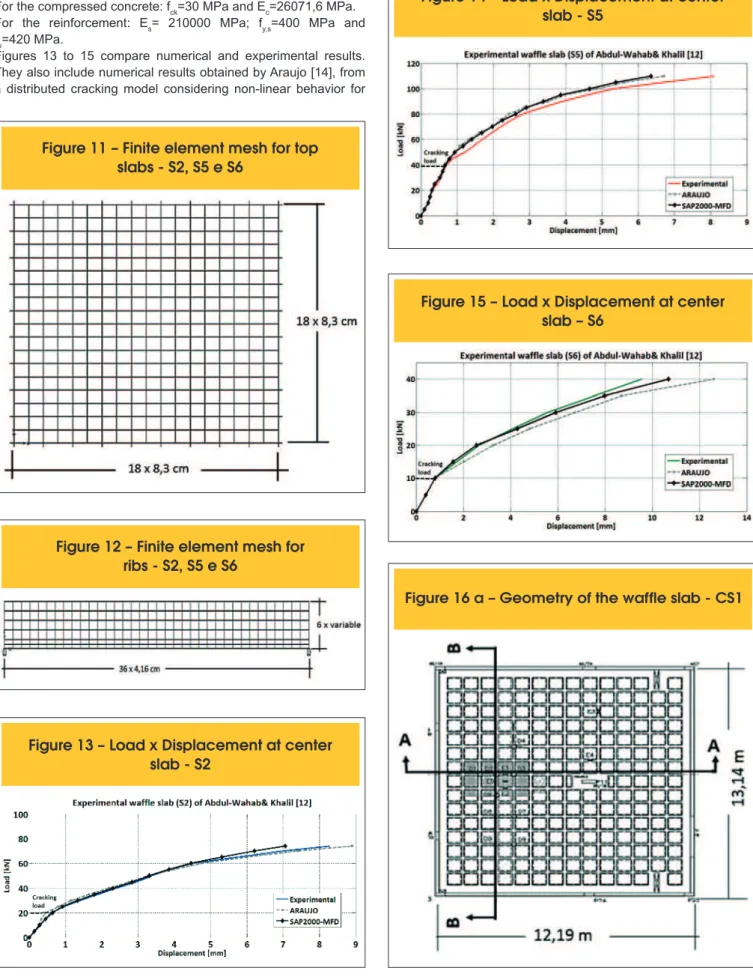
The numerical analysis used a 324(18x18) inite elements mesh for the top slab and twenty 216 (36x6) meshes for the ribs, as shown in Figures 11,12 and Table 3.
The stress-strain diagram for concrete is shown in Table 4 and the material properties, obtained from Abdul-Wahab & Khalil [12] or calculated according to NBR6118 [13] are listed below.
For the compressed concrete: fck=30 MPa and Ec=26071,6 MPa. For the reinforcement: Es= 210000 MPa; fy,s=400 MPa and
fu=420 MPa.
Figures 13 to 15 compare numerical and experimental results. They also include numerical results obtained by Araujo [14], from a distributed cracking model considering non-linear behavior for
the cracked concrete. This model uses a quadratic isoparametric element of 8 nodes, and 5 d.o.f per node, to represent top slab and ribs.
Figure 11 – Finite element mesh for top
slabs - S2, S5 e S6
Figure 12 – Finite element mesh for
ribs - S2, S5 e S6
Figure 13 – Load x Displacement at center
slab - S2
Figure 14 – Load x Displacement at center
slab - S5
Figure 15 – Load x Displacement at center
slab – S6
Results seem to be very close to each other. Displacements at the cracking load level differ less than 4% and at failure load less than 12%. Perhaps, the difference found for the failure load is due to the fact that the tensile strength and the concrete elastic modulus had to be determined by the requirements of NBR6118, since they were not experimentally obtained during the tests. These values directly inluence the convergence of the last load increments.
3.3 Numerical analysis of the slabs tested
by Schwetz [2]
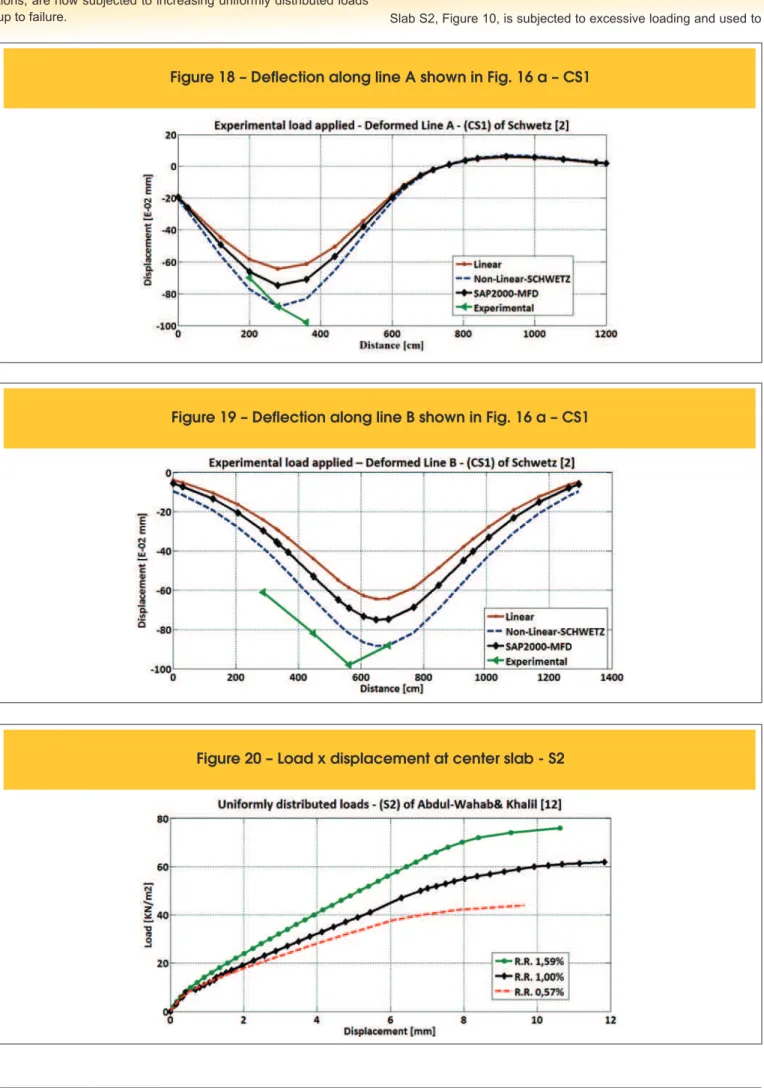
Schwetz [2] has performed the experimental evaluation of some full size wafle slabs, among which the Case Study 1 (CS1). This is a rectangular slab supported by edge beams over concrete col
-umns, tested under an experimental load distributed within the 2x3 m rectangular grey area shown in Figure 13. The test load was applied in four steps, up to a total of 6.67 kN/m2.
The concrete properties were experimentally determined as Ec = 35,740.0 MPa; fc = 35.9 MPa and ft = 2.9 MPa.
Schwetz [2] used the 5661 inite element mesh shown in Figure 17
and performed a non-linear numerical analysis considering the ac
-tual stress-strain curve of concrete in compression, but with a simpli
-ied tensile behavior. A reduction coeficient appl-ied to the maximum tensile strength was kept constant throughout the analysis, resulting a larger cracking deformation of the structure. Results are shown in Figures 18 and 19, relecting only the effect of the test load. This slab was part of an existing building under construction and thus subjected to other loads, as the self-weight and the walls sup
-ported by the border beams. For that reason, the numerical results shown in Figures 18 and 19, were obtained as the difference be
-tween beginning and end of the application of the test load. Such fact may, in part, justify the differences obtained by the re
-sults shown, that come close to 50% for the irst point of experi
-mental B-B curve. Another factor that may have contributed to this difference is that this slab is supported by beams and columns, which also deform. That, however, was indeed considered by the numerical model, where the border beams and columns were also modeled, as seen Figure 17.
4. Analysis of slabs under excessive
deformation
This section examines the performance of the proposed mod
-el regarding the global behavior of slabs as w-ell as predicting localized stresses in the reinforcement, for slabs under excessive
Figure 16 b – Rib Detail (cm) - CS1
Figure 17 – Finite element model for CS1
Table 3 – Parameters for layered shell elements
Number of meshes Number of components Name of layer Thickness (mm) Type Gauss´s
points Material Angle
Top slab 1 324
ConcreteC 20 Shell 3 Concrete 0
Rebar1C 0,0145 Shell 2 Steel 0
Rebar2C 0,0145 Shell 2 Steel 90
Rib 20 216 ConcreteN1 * Shell 3 Concrete 0
RebarN ** Shell 2 Steel 0
* depending on dimensions in Table 2 – ** depending on reinforcement rate
Tabela 4 – Stress-strain for cracked concrete
in S2, S5 and S6
Value of MFD S2 (strain) Value of MFD S5 (strain) Value of MFD S6 (strain) Stress Zone
1,15E-04 1,15E-04 1,15E-04 2,9 –
4,35E-04 7,83E-04 7,83E-04 1,16 1
2,19E-03 2,04E-03 2,04E-03 1,16 2
deformation. Thus, two slabs already discussed in previous sec
-tions, are now subjected to increasing uniformly distributed loads
up to failure.
4.1 Wafle Slab of Abdul-Wahab & Khalil [12]
Slab S2, Figure 10, is subjected to excessive loading and used to
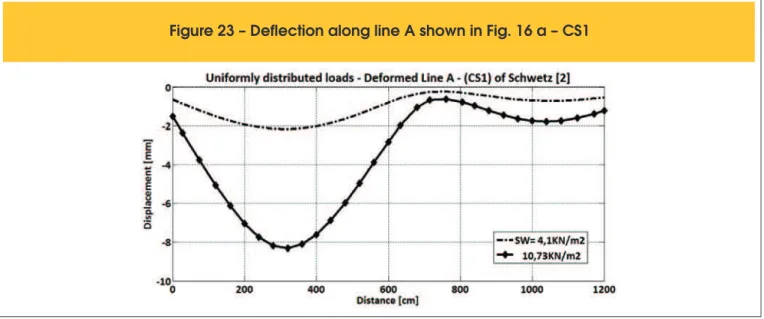
Figure 18 – Deflection along line A shown in Fig. 16 a – CS1
Figure 19 – Deflection along line B shown in Fig. 16 a – CS1
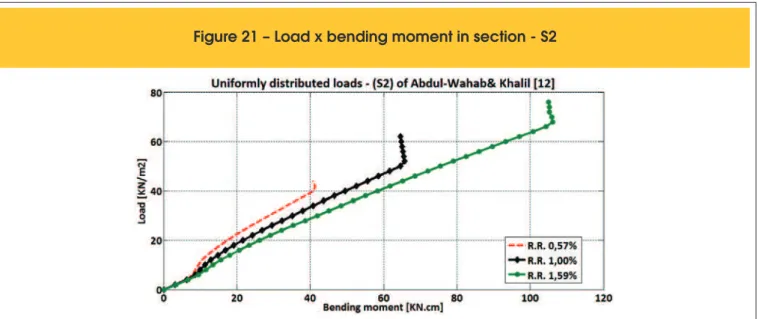
evaluate the influence of different rib reinforcement ratios. In the analysis below, an uniformly distributed load is increas
-ingly applied up to the slab ultimate capacity. The rib tensile reinforcement rate is varied, thus obtaining different values for the parameters of the distributed cracking model. The rates used are: 0.57% for 6.3mm bars, 1.00% for 8mm bars and 1.59% for 10mm bars.
The concrete physical properties remain Ec = 26.07 GPa; fcm =
32 MPa and fct,m = 2.9 MPa, therefore, in the cracking model input data, all three cases have the same tensile stress value but differ on the deformation values.
Results show the structure´s stiffness and load capacity in
-creasing with the rib reinforcement rate, as in Figure 20. However, Figure 22 shows that the reinforcement stress de
-creases with such ratio, limited by the strength of 400 MPa, for all cases. For a particular load level, both the slab dis
-placement and the reinforcement stress decrease with the
reinforcement ratio increment. The section´s capacity of ab
-sorbing bending moment, shown in Figure 21, on the other hand, increases.
4.2 Wafle slab of SCHWETZ [2]
The slab (CS1), Figure 16, was also analyzed under an uni
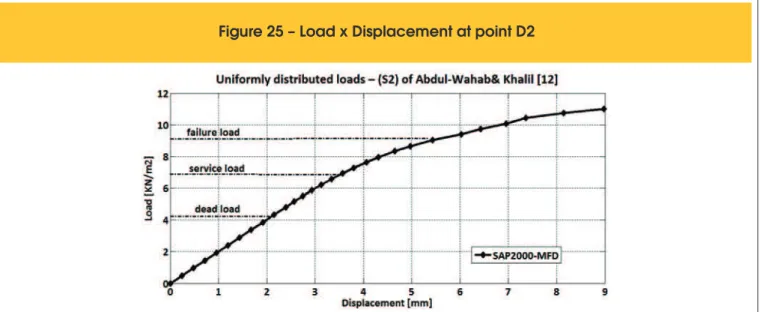
-formly distributed load, increasingly applied up to its ultimate capacity. The slab has a self-weight of 4.10 kN /m2 and was
designed for supporting a live load of 2.5 kN/m2. The current
analysis shows an ultimate load of 10.73 kN / m2, 16 % above
the design predicted failure load of 9.24 kN/m2, as in Figure 25.
Figures 23 and 24 show, in different directions, displacement curves corresponding to self-weight and ultimate load. It is clear the great distance between those curves, indicating a strong nonlinear behavior beyond service load, as observed in Figure 25.
Figure 21 – Load x bending moment in section - S2
5. Conclusions
The distributed cracking model of d´Avila [10] resulted compat
-ible with the application of SAP2000. It has the advantage to allow the setting of concrete cracking parameters according to section dimensions and reinforcement rates.
The proposed model for the analysis of wafle slabs was proven adequate for representing under and post-cracking behavior. It is suitable for observing the inluence of some geometrical charac
-teristics, as the variation of rib reinforcement ratios, for instance. It may reveal the structure´s global behavior and also observe details as the development of reinforcement stresses or the slab capability to absorb bending moment in a particular section. Some applications of the proposed model may be:
Evaluate the influence of reinforcement variation on the global and some localized behavior of a slab, for design optimization or load upgrading.
Observe the behavior of slabs with large openings, desired for the introduction of elevators or escalators.
6. Acknowledgements
The authors acknowledge the Brazilian Ministry of Science’s National Research Council (CNPq) and the Brazilian Ministry of Education’s Higher Education Human Resources Devel
-opment Agency (CAPES) for providing the financial support needed to develop this project.
The authors also express their appreciation to the Graduate Program in Civil Engineering-PPGEC of the Federal University of Rio Grande do Sul - UFRGS.
7. References
[01] Borges, A. R.; Análise experimental de lajes de concreto
Figure 23 – Deflection along line A shown in Fig. 16 a – CS1
armado nervuradas com mesas pré-fabricadas. Trabalho de Conclusão de Curso, Faculdade de Engenharia Civil, da Universidade Federal do Pará, 2009.
[02] Schwetz, P.F. Análise Numérico-Experimental de Lajes Nervuradas Sujeitas a Cargas Estáticas de Serviço. Tese (Doutorado em Engenharia) – Escola de Engenharia, Uni
-versidade Federal do Rio Grande do Sul, Porto Alegre, 2011. [03] Dias, R. H. Análise numérica de pavimentos de edifícios em
lajes nervuradas. Dissertação (Mestrado) - Escola de En
-genharia de São Carlos - Universidade de São Paulo, São Carlos, 2003.
[04] Stramandionoli, J.S.B. Contribuições à análise de lajes ner
-vuradas por analogia de grelha. Dissertação (Mestrado em Engenharia) – Universidade Federal de Santa Catarina, Flo
-rianópolis, 2003.
[05] Araujo, J. M. Considerações sobre a rigidez à torção das lajes nervuradas de concreto armado. Teoria e Prática na Engenharia Civil, n.7, p.1-8, Setembro, 2005.
[06] Donin, C. Análise numérica de lajes nervuradas por meio do método dos elementos initos. Dissertação Pós-Graduação em Engenharia Civil, Área de Concentração em Construção Civil, da Universidade Federal de Santa Maria, 2007. [07] Rebêllo R.R.; Duarte FºL.A. Análise numérica e experimen
-tal de laje nervurada bidirecional em concreto armado. In: CONGRESSO BRASILEIRO DO CONCRETO,49. Bento Gonçalves, 2007.
[08] Oliveira, R. S.; Araújo, D. L.; Ramalho, M. A. Avaliação da deformação de lajes nervuradas considerando a não lineari
-[11] COMITÉ EURO-INTERNATIONAL DU BÉTON. CEB-FIP Code Model 1990.Bulletin d’Infornation n.213/214, Lausane: CEB, mar. 1993.
[12] Abdul-Wahab, H.M.S.; Khalil, M.H. Rigidity and strength of orthotropic reinforced concrete wafle slabs.JournalofStruc
-turalEngineering, v. 126, n. 2, Feb., p. 219-227, 2000. [13] ASSOCIAÇÃO BRASILEIRA DE NORMAS TÉCNICAS.
NBR 6118:2007: projeto e execução de obras de concreto armado. Rio de janeiro, 2007.
[14] Araujo, J. M. Análise não-linear de lajes maciças e lajes ner
-vuradas de concreto armado. Revista Portuguesa de Engen
![Figure 1 – Waffle slab model according to DIAS [3]](https://thumb-eu.123doks.com/thumbv2/123dok_br/18860985.417919/2.892.65.832.822.1127/figure-waffle-slab-model-according-dias.webp)
![Figure 2 – Element shell-layered Figure 3 – Distributed cracking model proposed by d'Avila [10]](https://thumb-eu.123doks.com/thumbv2/123dok_br/18860985.417919/3.892.460.830.176.406/figure-element-layered-figure-distributed-cracking-proposed-avila.webp)