*e-mail: [email protected]
1. Introduction
The development of electromagnetic (EM) wave absorbers has been a recent focus towards solving the serious EM pollution arising from the fast-growing generation and applications of electronic devices1-5. Among various potential candidates for EM wave absorbers, the one in the form of magnetic nanoparticles core/ dielectric shell-structured nanocapsules, such as Ni/ZnO, FeNi3/SiO2, Ni/PANI, Ni/C, and Ni/Ni2O3 nanocapsules, has been of particular interest in recent years owing to its tailorable properties in conjunction with smaller sizes and weights6-10. An essence of determining the EM wave absorbing properties of the nanocapsules is to obtain a balance between the permeability of the magnetic nanoparticle cores with the permittivity of the dielectric shells11. However, the generally low permeability (~ 1) intrinsic in the magnetic nanoparticle cores at gigahertz frequencies, has constrained the strong absorption in some limited frequency range with large variations with absorber thickness.
More recently, improved high-frequency permeabilities have been observed in magnetic nanomaterials with different morphologies, including polyhedral Fe nanocomposites11, FeNi3 nanorods12, dumbbell-like Fe
3O4-Au nanoparticles 5, hierarchical branch- and lower-like Ni microcrystals13 and Fe nanolakes14. The improvement in high-frequency permeabilities has been attributed to an increased in their magnetic shape anisotropy. In fact, Ni is an important soft magnetic metal with a large saturation magnetization (MS),
a high permeability, a high anti-oxidation ability, and low energy losses. In this paper, we report the synthesis of three-dimensional (3D) butterly-like Ni architectures by a surfactant-assisted hydrothermal method as well as the microstructure, magnetic, dielectric, and EM wave absorbing properties of the architecture.
2. Experimental Procedure
All chemicals used were of analytical grade and were used as received. In a typical synthesis, NiCl2 6H2O (0.476 g, 2 mmol), sodium dodecyl benzenesulfonate (SDBS) (0.232 g, 1 mmol) and NaOH (1.6 g, 40 mmol) were dissolved in deionized water (40 mL) under constant stirring, resulting in a precursor green suspension. To prepare the proposed 3D butterly-like Ni architectures, the precursor green suspension was transferred into a 50-mL Telon-lined stainless steel autoclave. The autoclave was sealed and heated at 100 °C for 15 h and then cooled to room temperature naturally. The products obtained after the hydrothermal treatment were centrifuged, washed with distilled water and ethanol several times and inally dried in vacuum at 60 °C for 4 h.
The composition and phase purity of the as-prepared products were examined by an X-ray diffractometer (XRD, Brucker D8 Advance, Germany) at 40 kV voltage and 50 mA current and with CuKα radiation (λ=1.5418 Å). The morphologies of the products were captured using a scanning electron microscope (SEM, JEOL-6300F, Japan) at
Hydrothermal Synthesis of Three-dimensional Butterly-like
Ni Architectures as Microwave Absorbers
Yuping Suna,b, Niandu Wub,c, Caiyun Cuib,c, Siu Wing Orb, Xianguo Liuc*
aCenter for Engineering practice and Innovation Education, Anhui University of Technology – AHUT,
Maanshan 243032, PR China
bDepartment of Electrical Engineering, The Hong Kong Polytechnic University – PolyU,
Hung Hom, Kowloon, Hong Kong, China
cAnhui Key Laboratory of Metal Materials and Processing, School of Materials Science and
Engineering, Anhui University of Technology – AHUT, Maanshan 243002, PR China
Received: August 14, 2015; Revised: September 12, 2015
Three-dimensional butterly-like Ni architectures were fabricated by a surfactant-assisted hydrothermal method. The Ni architectures, with lengths of about 20 μm and widths of 4-6 μm, were assembled from tens of Ni nanorods with the averaged diameter of about 200 nm. The Ni nanorods were coated by oxide shells. The saturation magnetization of the Ni architectures was found to be 66.2 emu/g. The magnetic loss in the Ni architectures was mainly caused by the natural resonance, while the dielectric relaxation loss was originated from the interfacial relaxation between the oxide shells and the Ni nanorods in addition to the size distribution and morphology of the Ni architectures. Absorbers with a thickness of 2.1 mm exhibited an optimal relection loss (RL) value of -38.9 dB at 12.8 GHz. RL values exceeding -20 dB in the 8.0-17.8 GHz range were obtained by choosing absorber thicknesses between 1.5 and 3.2 mm. A quarter-wavelength cancellation model was used to explain the observed thickness dependence of RL peak frequency.
Sun et al.
1116 Materials Research
an acceleration voltage of 20 kV and a transmission electron microscope (TEM, JEOL-2010F, Japan) at an acceleration voltage of 200 kV. The magnetization curves were measured using a vibration sample magnetometer (VSM 7407, China). Parafin-bonded Ni architecture composites were prepared by uniformly mixing 40 wt.% Ni architectures in the parafin matrix and by pressing the mixture into cylinder-shaped compacts. More details can be found elsewhere6,11,12. The prepared compacts were cut into toroidal samples with 7.00 mm outer diameter and 3.04 mm inner diameter. The EM parameters of the toroidal samples were evaluated in the frequency range of 2-18 GHz, using a vector network analyzer (Agilent N5244A, USA) in conjunction with a coaxial method in transverse EM mode. The vector network analyzer was calibrated for the full two-port measurement of relection and transmission at each port. The complex permittivity (εr= −ε' jε'') and complex permeability (µr= −µ' jµ'') were calculated from S-parameters tested by the vector network analyzer using the simulation program of Relection/Transmission Nicolson-Ross model11.
3. Results and Discussion
The XRD pattern in Figure 1 shows the phase components of the as-prepared products. All XRD peaks can be indexed to the single-phase face-centered cubic Ni and are consistent with the standard card JCPDS No. 04-0850 (space groupFm m3 ; a=3.523 Å). No relections for oxides are found, which can be ascribed to the anti-oxidation nature of Ni. The average grain size of Ni is estimated to be 24.8 nm by using the relection peak of (111) and Debye-Scherrer’s relation. The inset of Figure 1 shows the hysteresis loop of the products at 295 K. The MS of the products reaches 66.2 emu/g, which is bigger than that of Ni/C nanocapsules9, but, is smaller than that of bulk nickel because of the size effect9.
Figure 2 shows the typical morphology of the products with different magniications. The SEM image in Figure 2a implies that the products are butterly-like architectures with a length of about 20 μm and a width of 4-6 μm. The magniied SEM image in Figure 2b shows that the butterly-like architectures
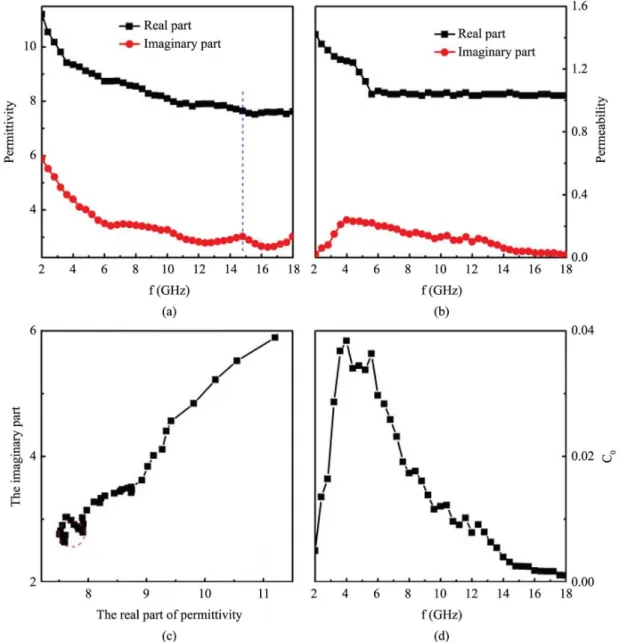
are composed of tens of order-attached nanorods, each with averaged length of about 20 μm and the averaged diameter of about 200 nm. It is also observed that the nanorods are attached together in the middle part of an individual butterly-like architecture and become curly and separated at the two ends with a symmetric character. The TEM image of the products in Figure 2c further conirms our observation in Figure 2a that the Ni architectures are self-assembled by nanorods. A typical HRTEM image of one nanorod in Figure 2d, clearly indicates that the d-spacing of 0.2 nm corresponds to the lattice fringe {111} of Ni. In addition, few amorphous oxides are seen on the surface of nanorods as a result of the high surface energy from small size effect11. The formation if the architectures possibly consists of four steps: (1) Formation of Ni crystal nuclei. (2) Ni nuclei grow into Ni nanoribbons. (3) The Ni nanoribbons self-assemble into Ni nanorods through an oriented attachment mechanism. (4) Ni nanorods attach orderly and assemble into butterly-like architecture. The εr and µr of the parafin-based composites are fundamental physical quantities in determining the microwave absorbing properties15. Figure 3a shows the frequency (f) dependence of εr for the parafin-bonded Ni architecture composites. Both the real part (ε') and imaginary part (ε'') display a similar decreasing trend with increasing frequency from 2 to 18 GHz. The results may be caused by an increased lagging in the dipole polarization response with respect to the electric ield change at higher frequencies16. The maximum/minimum values can be found below/above the resonance frequency in the ε' curve6. Accordingly, one peak is observed in the ε'' curve near the resonance frequency. The resonance frequency of ε in the current frequency range is 14.8 GHz. From the plot of ε' versus ε'', the Cole-Cole semicircle, as shown in Figure 3c. the composites present a clear segment of one semicircle at high frequencies and a linear curve at relatively low frequencies. The presence of one semicircle at high frequencies suggests that there is a Debye dielectric relaxation process due to the dielectric relaxation of the interfacial relaxation between the oxide shells and the Ni nanorods16. The dielectric relaxation is signiicant for the enhancement of the microwave absorption in the Ni architectures. Besides the dielectric relaxation process, other dielectric mechanisms such as resistance loss and defects may contribute to the permittivity dispersion, leading to the linear curve at relatively lower frequencies17,18. Following the effective-medium theory of three-phase inclusions19, the permittivity of the composites seems to originate from the special geometric structures of the Ni architecture inclusions, the intrinsic permittivity of each component in the composites (Ni, oxides, and parafin), and the dispersion (volume fraction) of the composites.
From Figure 3b, the real part (µ') of µr decreases from 1.42 to 1.04 with increasing frequency in frequency range of 2-5.6 and becomes almost independent of frequency for frequencies up to 18 GHz. Meanwhile, the imaginary part (µ'') of µr has a resonance peak at 4.0 GHz with a broad resonance band covering 3-11 GHz. The resonance frequency at 4.0 GHz is due to the large anisotropy energy of Ni architectures6,9. The anisotropy energy of particles of small sizes, especially in the nanometer scale, may be remarkably increased due to the size effect-induced shape/surface anisotropy6,9. The broad Figure 1. XRD pattern of the products. The inset shows hysteresis
resonance band may be interpreted as a consequence of size and morphology of the Ni architectures. Due to the fact that their lengths and widths are larger than a magnetic wall, the Ni architectures are made up of several magnetic domains so that the broad resonance band may be interpreted as a consequence of their magnetic polydomain coniguration. The frequency band broadening is also related to the shape and morphology of the nanostructures because of the effect of the demagnetization ields15.
As a typical magnetic material, the magnetic loss of Ni architectures is mostly associated with magnetic hysteresis, domain wall resonance, eddy current loss, natural resonance, and exchange resonance for particles smaller than 100 nm[20,21]. Magnetic hysteresis stemming from irreversible magnetization
occurs only in a highly applied ield, whereas domain wall resonance derived from multi-domain materials occurs only in the sub-GHz frequency range. Exchange resonance should be excluded in the present system since the size of the Ni architectures is larger than 100 nm. If the magnetic loss only stems from the eddy current loss, the values of µ µ''( ')−2f−1
should be constant when the frequency is changed. As shown in Figure 3d, the values of µ µ''( ')−2f−1 of the Ni architectures change remarkably with increasing frequency. Therefore, the magnetic loss in the present system is mainly caused by the natural resonance.
Sun et al.
1118 Materials Research
thickness can be calculated from the complex permeability and permittivity by means of the following expressions3,5-12:
0
/ / tanh(( 2 / ) )
20 lg ( 1) / ( 1)
in r r r r
Z Z Z j t
RL Z Z
µ ε π λ µ ε
= =
= − + (1)
where Z is the normalized input impedance related to the impedance in free space; λ is the wavelength in free space; and t is the thickness of the absorber.
The 3D plot of the RL of the parafin-bonded Ni architectures composites against thickness (1-5 mm) and frequency (2-18 GHz) is presented in Figure 4. It is clear that an optimal RL of -38.9 dB, corresponding to 99.97% absorption, is observed at 12.8 GHz for a thickness of 2.1 mm. By increasing the thickness, the RL maximum shifts to a lower frequency. When the thickness is thicker
Figure 3. Frequency dependence of (a) the relative complex permittivity and (b) the relative complex permeability, (c) Cole-Cole plot, and (d) frequency dependence of C0 (C0=µ µ''( ')−2f−1).
than the critical value, two peaks appear simultaneously. RL values exceeding -20 dB are obtained in the 8.0-17.8 GHz range with the thickness varying between 1.5 and 3.2 mm. This frequency range covers the absorption frequency range of the traditional sintered ferrites22. The good microwave absorbing properties of Ni architectures can be ascribed to the excellent synergetic effect of the dielectric relaxation loss and the magnetic resonance loss.
A quarter-wavelength cancellation model has been successfully used to explain the relationship between RL peak frequency and absorber thickness for carbonyl-iron particles, Ni@Ni2O3 core-shell particles and FeNi3/C nanowires10,12,23. According to the model, the minimum RL can be gained at given frequencies if the absorber thickness (tM) satisies:
/ (4 ) (n = 1, 3, 5...)
m m r r
Figure 5. (a) Dependence of RL on frequency at various thicknesses
for the Ni-parafin composites; and (b) Dependence of λ/4 and 3λ/4 thickness on frequency for the Ni-parafin composites.
where fM is the peak frequency of RL, εr and µr are the complex permittivity and permeability at fM, respectively, and c is the velocity of light.
Refering to Equation 2, the RL peak frequency is inversely proportional to the thickness, and two RL peaks appear at a suficiently large thickness. The One at a lower frequency is relative to the λ/4 condition, while the other one at a higher frequency comes from the 3λ/4 condition. A comparison between the tMCAL calculated by Equation 2 (n equals 1 and 3) and the tMSIM simulated by Equation 1 for the parafin-bonded Ni architecture composites is shown in Figure 5. The good agreement between tMCAL and t
M SIM
implies that the microwave absorption mechanism of the parafin-bonded Ni architecture composites can be explained by the quarter-wavelength cancellation model10.
4. Conclusions
3D butterly-like Ni architectures have been fabricated by a surfactant-assisted hydrothermal method. The as-prepared Ni architectures have been characterized by XRD, SEM, and TEM techniques and found to have a length of about 20 μm, a width of 4 - 6 μm, and be assembled by tens of Ni nanorods with a diameter of about 200 nm. The MS of Ni architectures at 295 K has shown 66.2 emu/g and ferromagnetism. The EM properties of parafin-bonded Ni architecture composites had been investigated. An absorber with a thickness of 2.1 mm has found to exhibit an optimal RL value of -38.9 dB at 12.8 GHz. RL values exceeding -20 dB have been obtained in the 8.0-17.8 GHz range by choosing a thickness of 1.5-3.2 mm. The dielectric relaxation loss in the Ni architectures has been attributed to the interfacial relaxation between the oxide shells and the Ni nanorods as well as the size distribution and morphology of the Ni architectures, while the magnetic loss in the present system has been found to originate from the natural resonance. The thickness dependence on RL peak frequency has been described by a quarter-wavelength cancellation model. The present work suggests a great potential of using our 3D butterly-like Ni architectures in microwave absorbing materials.
Acknowledgements
This study was supported by the National Natural Science Foundation of China (Grant No. 51201002), the Research Grants Council of the HKSAR Government (Grant No. PolyU 5236/12E), and The Hong Kong Polytechnic University (Grant Nos. G-YK59).
Figure 4. 3D representation of the RL derived from the measured
and of the Ni-parafin composites as a function of the frequency.
References
1. Ohkoshi S, Kuroki S, Sakurai S, Matsumoto K, Sato K and Sasaki S. A millimeter-wave absorber based on gallium-substituted
ɛ-iron oxide nanomagnets. Angewandte Chemie International
Edition. 2007; 46(44):8392-8395. http://dx.doi.org/10.1002/
anie.200703010.
2. Namai A, Sakurai S, Nakajima M, Suemoto T, Matsumoto K, Goto M, et al. Synthesis of an electromagnetic wave absorber for high-speed wireless communication. Journal of the American
Chemical Society. 2009; 131(3):1170-1173. http://dx.doi.
org/10.1021/ja807943v. PMid:19115851.
3. Ren YL, Wu HY, Lu MM, Chen YJ, Zhu CL, Gao P, et al. Quaternary nanocomposites consisting of graphene, Fe3O4@ Fe core@shell, and ZnO nanoparticles: synthesis and excellent electromagnetic absorption properties. ACS Applied Materials & Interfaces. 2012; 4(12):6436-6442. http://dx.doi.org/10.1021/ am3021697. PMid:23176086.
4. Watts PCP, Hsu WK, Barnes A and Chambers B. High Permittivity from defective multiwalled carbon nanotubes in the X-band.
Advanced Materials. 2003; 15(7-8):600-603. http://dx.doi.
org/10.1002/adma.200304485.
Sun et al.
1120 Materials Research
heterogeneous interfacial polarizations. Particle & Particle Systems Characterization : Measurement and Description of Particle Properties and Behavior in Powders and Other Disperse
Systems. 2013; 30(10):842-846. http://dx.doi.org/10.1002/
ppsc.201300108.
6. Liu XG, Jiang JJ, Geng DY, Li BQ, Han Z, Liu W, et al. Dual nonlinear dielectric resonance and strong natural resonance in Ni/ZnO nanocapsules. Applied Physics Letters. 2009; 94(5):053119. http://dx.doi.org/10.1063/1.3079393. 7. Yan SJ, Zhen L, Xu CY, Jiang YT and Shao WZ. Microwave
absorption properties of FeNi 3 submicrometre spheres and SiO2
@FeNi 3 core–shell structures. Journal of Physics. D, Applied
Physics. 2010; 43(24):245003.
http://dx.doi.org/10.1088/0022-3727/43/24/245003.
8. Dong XL, Zhang XF, Huang H and Zuo F. Enhanced microwave absorption in Ni/polyaniline nanocomposites by dual dielectric relaxations. Applied Physics Letters. 2008; 92(1):013127. http:// dx.doi.org/10.1063/1.2830995.
9. Zhang XF, Dong XL, Huang H, Liu YY, Wang WN, Zhu XG, et al. Microwave absorption properties of the carbon-coated nickel nanocapsules. Applied Physics Letters. 2006; 89(5):053115. http://dx.doi.org/10.1063/1.2236965.
10. Wang BC, Zhang JL, Wang T, Qiao L and Li FS. Synthesis and enhanced microwave absorption properties of Ni@Ni2O3 core–shell particles. Journal of Alloys and Compounds. 2013; 567:21-25. http://dx.doi.org/10.1016/j.jallcom.2013.03.028. 11. Liu XG, Sun YP, Feng C, Jin CG and Li WH. Synthesis,
magnetic and electromagnetic properties of Al2O3/Fe oxides composite-coated polyhedral Fe core–shell nanoparticles.
Applied Surface Science. 2013; 280:132-137. http://dx.doi.
org/10.1016/j.apsusc.2013.04.109.
12. Sun YP, Liu XG, Feng C, Fan JC, Lv YH, Wang YR, et al. A facile synthesis of FeNi3@C nanowires for electromagnetic wave absorber. Journal of Alloys and Compounds. 2014; 586:688-692. http://dx.doi.org/10.1016/j.jallcom.2013.10.063. 13. Wang ZZ, Zou JP, Ding ZH, Wu JF, Wang PH, Jin SW, et al.
Magnetic and microwave absorption properties of Ni microcrystals with hierarchical branch-like and flowers-like shapes. Materials
Chemistry and Physics. 2013; 142(1):119-123. http://dx.doi.
org/10.1016/j.matchemphys.2013.07.003.
14. Song ZJ, Deng LJ, Xie JL, Zhou PH, Lu HP and Wang X. Synthesis, dielectric, and microwave absorption properties of flake carbonyl iron particles coated with nanostructure polymer.
Surface and Interface Analysis. 2014; 46(2):77-82. http://dx.doi. org/10.1002/sia.5351.
15. Wen SL, Liu Y, Zhao XC, Cheng JW and Li H. Synthesis, multi-nonlinear dielectric resonance and electromagnetic absorption properties of hcp-cobalt particles. Journal of Magnetism and Magnetic Materials. 2014; 354:7-11. http://dx.doi.org/10.1016/j. jmmm.2013.10.030.
16. Wang H, Guo HH, Dai YY, Geng DY, Han Z, Li D, et al. Optimal electromagnetic-wave absorption by enhanced dipole polarization in Ni/C nanocapsules. Applied Physics Letters. 2012; 101(8):083116. http://dx.doi.org/10.1063/1.4747811. 17. Wu HJ, Wang LD, Wang YM, Guo SL and Shen ZY. Enhanced
microwave performance of highly ordered mesoporous carbon coated by Ni2O3 nanoparticles. Journal of Alloys and
Compounds. 2012; 525:82-86. http://dx.doi.org/10.1016/j.
jallcom.2012.02.078.
18. Liu XG, Feng C, Or SW, Sun YP, Jin CG, Li WH et al. Investigation on microwave absorption properties of CuO/ Cu2O-coated Ni nanocapsules as wide-band microwave absorbers. RSC Advances. 2013; 3(34):14590-14594. http:// dx.doi.org/10.1039/c3ra40937f.
19. Wang Y and Paulus B. A comparative electron correlation treatment in H(2)S-benzene dimer with DFT and wavefunction-based ab initio methods. Chemical Physics Letters. 2007; 441(4-6):187-193. PMid:21072139.
20. Ma J, Li J, Ni X, Zhang XD and Huang JJ. Microwave resonance in Fe/SiO[sub 2] nanocomposite. Applied Physics Letters. 2009; 95(10):102505. http://dx.doi.org/10.1063/1.3224883. 21. Deng LJ, Zhou PH, Xie JL and Zhang L. Characterization
and microwave resonance in nanocrystalline FeCoNi flake composite. Journal of Applied Physics. 2007; 101(10):103916. http://dx.doi.org/10.1063/1.2733610.
22. Wang H, Dai YY, Gong WJ, Geng DY, Ma S, Li D, et al. Broadband microwave absorption of CoNi@C nanocapsules enhanced by dual dielectric relaxation and multiple magnetic resonances. Applied Physics Letters. 2013; 102(22):223113. http://dx.doi.org/10.1063/1.4809675.