ISSN 1 5 1 7 - 7 0 7 6
Revista Matéria, v. 11, n. 1, pp. 41 – 47, 2006 http://www.materia.coppe.ufrj.br/sarra/artigos/artigo10691
Autor Responsável: Sergio Neves Monteiro Data de envio: 06/10/05 Data de aceite: 28/03/06
Influence of Temperature on the Properties and Phase Transformations
in Ti-Nb Alloys with 2%Al
Lioudmila A. Matlakhovaa , Anatoly N. Matlakhov a Sergio N. Monteiro a, Sergei G. Fedotov b
a
State University of the Northern Rio de Janeiro, UENF, Advanced Materials Laboratory, LAMAV, Av. Alberto Lamego, 2000, 28013-602, Campos dos Goytacazes, Brazil,*
e-mail: [email protected], [email protected], [email protected]
b
Laboratory for Amorphous and Nanocrystalline Alloys, A.A. Baikov Institute of Metallurgy and Materials Science, Russian Academy of Science, Moscow, Russia.
ABSTRACT
Quenched alloys from the Ti-Nb system are of considerable scientific and applied interest due to properties such as superconductivity, shape memory effect and high damping capacity. In this work, Ti-Nb quenched alloys with 2 wt.% Al and Nb content varying from 15 to 40% were investigated with respect to effects on phase transformations, internal friction and elastic modulus caused by the temperature up to 800°C. The results showed that the internal friction presented peaks and the elastic modulus displayed minimum values with the temperature. These results were associated with phase transformations occurring with increasing temperature.
Keywords: Ti-Nb-2%Al, temperature effects, phase transformations, elastic modulus, internal friction.
1 INTRODUCTION
Titanium-Niobium alloys have been applied in technological systems related to special phenomena of electrical superconductivity, shape memory effect and superelasticity [1, 2]. Moreover, the elastic properties and related increase in the internal friction of the Ti-Nb crystalline lattice result in a high damping capacity. The addition of other elements to the composition of Ti-Nb alloys can significantly change the value of the elastic effects and, in some cases, enhance the alloys properties. In particular, the introduction of aluminum tends to increase both, the elastic modulus and the internal friction.
Previous works on Ti-Nb-Al alloys have shown that, even in relatively small amounts, aluminum can cause relevant changes in the microstructure and physical behavior. For instance, Matlakhova et allii [3-5] investigated the effects of 2 to 15 wt.% addition of Al on the microstructure and physical properties of Ti alloys with 10 to 40 wt.% Nb. The microstructure was studied in terms of phase transformations and related changes in properties such as the Young’s modulus (E), the shear modulus (G), the density (ρ) and the internal friction (Q-1). The authors [3-5] found that the introduction of Al promotes a rhombic distortion in the original α’ hexagonal close-packed (HCP) martensitic structure of the Ti-Nb alloy. This martensitic structure then transforms to an α” orthorhombic structure. For alloys with the inferior limit of 2 wt.% Al, the rhombic distortion will take place at Nb content as low as 15 wt.%. As a consequence a duplex α’ + α” microstructure will exist from 15 to 24 wt.% Nb. Above this, from 24 to 30wt.% Nb, the α” structure is partially transformed into a metastable ω phase that gradually changes to a metastable β body centered cubic (BCC) phase. At even higher Nb percentages, from 30 to 35 wt.%, a triplex α’ + α” + β microstructure will exist [5, 6]. Finally, from 35 to 40 wt.%, α’ disappears leaving a duplex α” + β microstructure. From 40 wt.% Nb and above, a single stable BCC β phase microstructure predominates.
All these complex microstructural changes brought by the addition of only 2 wt.% Al strongly affect the physical properties of Ti-Nb alloys. For example, the appearance of the ω or the β metastable phases for Ti-Nb-2 wt.% Al alloys is directly responsible for increases in E, G, ρ and Q-1 [6, 7].
work have studied changes caused by temperature, up to 800°C, on the phase transformation and values of E, G, ρ and Q-1 in Ti-Nb alloys with 2 wt.% Al.
2 EXPERIMENTAL PROCEDURE
2.1 Materials
The 2 wt.% Al and 15 to 40 wt.% Nb with balanced Ti alloys investigated in the present work were electric arc furnace fabricated through five consecutive melts using high purity elements. The titanium was iodized and 99.99 wt.% pure. The niobium was electron beam zone refined and 99.9 wt.% pure. The aluminum was electrolytically refined and 99.999 wt.% pure.
After solidification, ingots weighting 100 g were encapsulated under vacuum and heat-treated at 1200°C for 5 hours to homogenize the microstructure. In the following step, the homogeneous alloy ingots were re-heated at 1200°C in Argon atmosphere and forged as cylindrical bars with 8 mm in diameter. These forged bars were then machined down to 6 mm in diameter to discard any surface contamination.
Two types of samples were transversally cut from the machined bars. Samples with 80 mm in length were cut for the determination of E, G and Q-1. Samples with 20 mm in length were cut for differential thermal analysis (DSC) and microstructure characterization.
All these samples were again vacuum encapsulated, in the same previous procedure as for the ingots, and then heat-treated at 1000°C for 5 hours. This was immediately followed by water quenching. Consequently, the initially investigated alloy microstructure was a quenched martensite and not that predicted by the phase diagram at room temperature.
2.2 Properties and Microstructure Evaluation
As for the physical properties the elastic moduli, E and G, were obtained by dynamic resonance through the equations:
E = 4.0775 ρ l2 fl2 (1)
G = 4.0775 ρ l2 ft2 (2)
Where fl and ft are, respectively, the longitudinal and the transversal oscillations corresponding to
the resonance frequencies. The length l and the density ρ of the alloy sample were also measured by standard procedure. The resonance frequencies were determined in an Elastomat equipment in which the oscillation could vary up to 26 kHz at a maximum stress of 0.1 MPa and a temperature in the range of 20 to 750°C with a heating rate of 2°C/min.
The evaluation of the damping capacity of the alloys crystalline lattice was carried out by measurements of the internal friction Q-1. These measurements were performed in the same Elastomat equipment coupled with an oscillatory excitation device with possibility of changing the temperature up to 800°C.
The DSC curve for the thermoanalysis was obtained in a Seteram, model DSC-3, equipment from 20 to 800°C with heating and cooling rates of 2°C/min.
The microstructure of the quenched alloys was analyzed on discs collected from the samples using a Miniton cutter. The discs were cold mounted in rigid polymeric resin before surface preparation. This preparation was initially done by grinding with a sequence of conventional emery papers followed by polishing down to 0.25 μm diamond paste. The polished surface was finally electrolytically etched at 30V in a 12 ml HNO3 + 2 ml HF + 100 ml H2O solution. The microstructure was then observed in a model 32
Neophot optical microscope.
3 RESULTS AND DISCUSSION
Figure 1: Micrographs of the alloys with: (a) 15, (b) 34 and (c) 40 wt.%Nb.
Alloys with relatively low amount of Nb, such as 15 wt.% in Figure 1(a), develop, after quenching, a microstructure completely covered by α’ martensite plates. For 34 wt.% Nb, Figure 1(b), a complex microstructure is observed in which metastable β phase has partially replaced α’ and α” phases [3-5]. For 40 wt.% Nb, Figure 1(c), no martensite plate is formed after quenching and the microstructure consists of the same β phase formed at 1000°C [5-7].
0 200 400 600 800
Heating a) 15%Nb
+
Δ
q
0 200 400 600 800
Temperature (oC)
b) 34%Nb
Heating
+
Δ
q
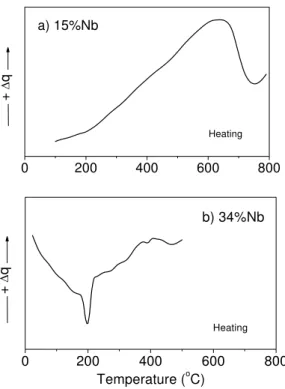
Figure 2: DSC curves for the quenched alloys: (a) Ti-15wt.%Nb-2wt.%Al and (b) Ti-34wt.%Nb-2wt.%Al.
the curve until 600°C. This increase can be attributed to the thermal energy liberated by intermediate transformations of the martensitic HCP α’ phase into stable HCP α phase. Above 650°C there is an endothermic peak in Figure 2(a) with a minimum around 750°C.
This peak can be associated with the final transformation of stable α phase into stable BCC β phase [5-7]. On the other hand, the alloy with 34 wt.% Nb in Figure 2(b) displays two distinct thermal effects. An endothermic peak occurs with a minimum around 190°C. This peak can be related to the orthorhombic α” phase transformation into metastable BCC β phase. An exothermic valley can be observed in the interval from 330 to 460 °C. Actually, this valley corresponds to the superposition of different processes, including the decomposition of the β metastable phase forming other phases that are richer and poorer in alloying elements. The poor alloying phase will consolidate in the stable non-martensitic α phase, which then may transform into stable β phase at higher temperatures [7]. The alloying rich regions will directly form the stable β phase since Nb is a BCC stabilizer.
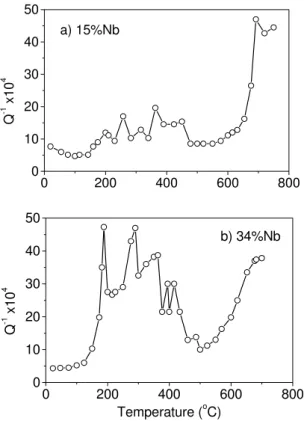
Figure 3 illustrates the variation of the internal friction Q-1 with temperature for two alloys, one with 15 wt.% Nb (a) and the other with 34 wt.% Nb (b). The variation of Q-1 with temperature shown in Figure 3 can be associated with the phase transformations mentioned in the introduction of this work and illustrated in Figure 1.
For the alloy with 15 wt.% Nb, Fig 3(a), the values of Q-1 are about 5 x 10⁻⁴ to 20 x 10-4 up to 450°C in association with an α’ or α” - α(α”) - microstructure. When the transformation of stable α phase into stable β phase takes place above 600°C, the values of Q-1 significantly increase up to 50 x 10-4. Whereas, the alloy with 34 wt.% Nb, Figure 3(b), displays, up to 450°C, maximum values in Q-1 of almost 50 x 10-4 during the already discussed phase transformation of α” into metastable β followed by decomposition of metastable
β into stable α phase. As in the alloy with 15 wt.% Nb, the alloy with 34 wt.% Nb, Figure 3(b), increases the value of Q-1 as the temperature rises above 600°C due to the transformation of stable α into stable β phase. Similar behavior was found for the other alloys investigated.
0 200 400 600 800
0 10 20 30 40 50
a) 15%Nb
Q
-1 x10
4
0 200 400 600 800
0 10 20 30 40 50
b) 34%Nb
Q
-1 x10
4
Temperature (oC)
Figure 3: Variation of the internal friction, Q-1, with temperature for the quenched alloys: (a) Ti-15wt.%Nb-2wt.%Al and (b) Ti-34wt.%Nb-Ti-15wt.%Nb-2wt.%Al.
similar dependence also exists for the shear modulus G. Since G follows, proportionally, the same behavior of E, Figure 4, it was not considered relevant to present a G versus temperature curve for all alloys investigated.
Figure 4: Variation of the moduli E and G with the temperature for the Ti-34wt.%Nb-2wt.%Al alloy.
0
200
400
600
800
50
60
70
80
90
(4) 34% Nb
(5) 36% Nb (6) 40% Nb (1) 15% Nb (2) 20% Nb (3) 24% Nb
6
5
4 2
3
1
E (
G
Pa)
Temperature (
oC)
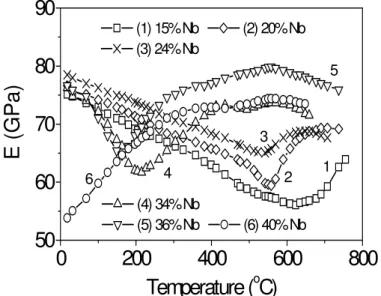
Figure 5: Temperature dependence of the elastic modulus, E, for the quenched alloys: (1) 15wt.%Nb-2wt.%Al, (2) 20wt.%Nb-15wt.%Nb-2wt.%Al, (3) 24wt.%Nb-15wt.%Nb-2wt.%Al, (4) 34wt.%Nb-15wt.%Nb-2wt.%Al, (5)
Ti-36wt.%Nb-2wt.%Al and (6) Ti-40wt.%Nb-2wt.%Al.
As above-mentioned, it is important to notice in Figure 4 that E goes through a minimum value, Emin, at different temperatures for each alloy. This minimum occurs at a comparatively higher temperature the
smaller the Nb content. For instance, the modulus for alloy Ti-15wt.%Nb-2wt.%Al at 20oC decreases to a minimum around 650oC and increases above this temperature. The Ti-40wt.%Nb-2wt.%Al alloy is expected to have a minimum in its modulus a little lower than 0oC. As shall be discussed, the reason for this Emin could
be associated with phase transformations occurring with increasing temperature.
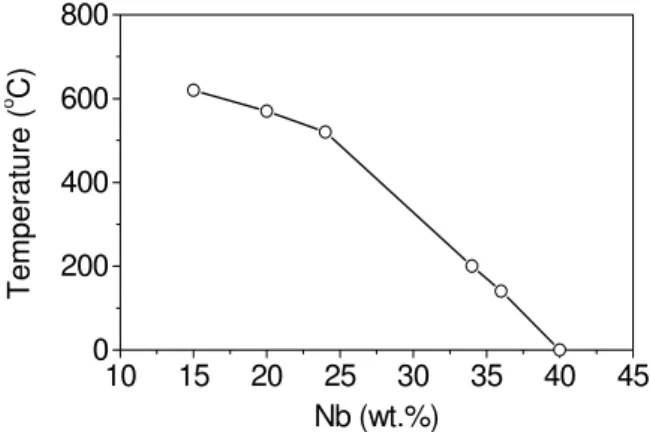
Figure 6 plots the temperature where Emin occurs as a function of the Nb content. This plot conforms
well to two linear branches. The different slopes of the branches indicate two distinct causes for the minimum values of E. The first branch corresponds to alloys with lower percentages of Nb, up to 24 wt.%, and initial
Figure 5, without notable interference from any transformation down to Emin, when the lattice stiffness of the α′ phase is decreasing. However, when the α phase transforms to β phase the situation is reversed. Since the
β phase tends to increase the stiffness of its lattice, with temperature [1, 8], the value of E then begins to increase. In other words, this Emin is a consequence of a lattice softening being overcome by the hardening
contribution of the α′ (α″) to β transformation. At high temperatures, due to diffusion processes, the metastable phases decompose forming stable ones. Under these conditions, the reverse martensitic α′ (α″) transformation into metastable β and the occurrence of inelastic effects such as shape memory and superelasticity are not possible to take place.
10 15 20 25 30 35 40 45
0 200 400 600 800
T
e
mperature (
o C)
Nb (wt.%)
Figure 6: Dependence of the temperature of the minimum value in the modulus, Emin, as shown in Figure 5,
with the relative amount of Nb.
The second linear branch in Figure 6, corresponding to alloys with initial duplex, α” + β, or single metastable β microstructure, is associated with Emin at low temperatures, not greater than 200oC. In this case,
an early transformation of the initial metastable β is responsible for this behavior. At temperatures lower than 200oC, α’ or α” phase begin transforming into metastable β as a martensitic reversible transformations. This corresponds to the endothermic peak at 190oC, Figure 2(b), for the alloy with 34 wt.% Nb. The initial metastable β decomposes forming regions rich and poor in Nb [6, 7]. The rich regions become stable β since Nb is a strong BCC stabilizer. The poor regions turn into the more thermodynamically stable α, which eventually transforms into stable β. Consequently, stable β may be formed at lower temperature, increasing the stiffness and raising the value of E. This explains the lower temperature Emin displayed by alloys with 34,
36 and 40 wt.% Nb in Figure 5. Due to these phase transformations, alloys with Nb content between 30 to 36 wt.% may present shape memory effect after a special heat treatment [1, 8, 9].
4 CONCLUSIONS
Depending on the relative amount of Nb, the quenching process of Ti-Nb-2 wt.% Al alloys, from temperatures corresponding to the stable β phase, will produce distinct structures. After heating, the initial metastable structure [ α’ (up to 15 wt. % Nb), α’ + α” (15 to 24wt.% Nb), α’ (α”) + ω (24 to 30 wt.% Nb), α’ (α”) + β (30 to 35 wt. % Nb), α” + β (35 to 40 wt. % Nb) or β (> 40 wt. % Nb)] undergoes transformations towards a stable condition. These transformations are accompanied by endothermic and exothermic effects as well as alterations in the values of the internal friction and elastic modulus
The internal friction presents peaks that could be associated with these phase transformations. In the case of alloys with initial metastable β (> 30 wt. % Nb) peaks at lower temperatures were registered due to the decomposition of this phase. Above 600 °C, all alloys present an increase in internal friction as a consequence of the stable α to stable β phase transformation.
alloys with initial α’(α”) + β or single metastable β, will suffer reverse martensitic transformation and/or β decomposition at significantly lower temperature. Therefore, the minimum in E and G occurs at temperatures not greater than 200°C.
5 ACKNOWLEDGEMENTS
The authors would like to express their thanks to the financial support provided by the Russian Academy of Science and the Brazilian agencies FAPERJ, CNPq and CAPES. Special thanks are due to Dr. V.V. Molokanov (IMET, Moscow) for the DSC tests.
6 REFERENCES
[1] COLLINGS, E.W., The Physical Metallurgy of Titanium Alloys, 3 ed., Metals Park, Ohio; American Society for Metals, ASM, 1984.
[2] MATTHEW, J., DONACHIE Jr., M.J., Titanium, Technical Guide, 2 ed., Materials Park, Ohio, ASM International, 2000.
[3] MATLAKHOVA, L.A., FEDOTOV, S.G., PEKHTEREVA, N.N, “Properties and Structural Characteristics of Ti-Nb-Al Alloy “, Journal News of the USSR Academy of Science, Metals. v. 3, pp. 108-113, 1994.
[4] MATLAKHOVA, L.A., FEDOTOV, S.G., MATLAKHOV, A.N., MONTEIRO, S.N., “Propriedades Físico-Mecanicas e Estruturais de Ligas Titânio-Nióbio-Alumínio“ In: Proceedings of the 51th Annual Congress of the Brazilian Society of Metallurgy and Materials, ABM, pp. 389-402, Porto Alegre, Brazil, Aug. 1996.
[5] MATLAKHOVA, L.A., MATLAKHOV, A.N., MONTEIRO, S.N. et al., “Properties and Structure Characteristics of Ti-Nb-Al Alloys”, Journal Materials Science and Engineering A, v. 393, pp. 320-326, 2005.
[6] FEDOTOV, S.G., KONSTANTINOV, K.M., KOKNAEV, R.G. et al., In Yu.K. Kovneristyi (ed.), Titanium Alloys with Special Properties, Moscow, Nauka Pub., pp. 29-32, 1982.
[7] FEDOTOV, S.G., KONSTANTINOV, K.M., SINODOVA, E.P., In Yu.K. Kovneristyi (ed.), Titanium Alloys with Special Properties, Moscow, Nauka Pub., pp. 78-82, 1982.
[8] FEDOTOV, S.G. In: I.I. Kornilov (ed.), Investigations of Liquid and Solid Metals, Moscow, Nauka Pub., pp. 207-240, 1982.