ISSN 0104-6632 Printed in Brazil
www.abeq.org.br/bjche
Vol. 31, No. 04, pp. 959 - 965, October - December, 2014 dx.doi.org/10.1590/0104-6632.20140314s00002685
Brazilian Journal
of Chemical
Engineering
MATHEMATICAL MODELING OF A CONVECTIVE
TEXTILE DRYING PROCESS
G. Johann
1*, E. A. Silva
2, O. C. Motta Lima
1and N. C. Pereira
1¹Chemical Engineering Department, State University of Maringá, Avenida Colombo 5790, Bl. D-90, 87020-900, Maringá - PR, Brazil.
Phone: + (55) (44) 3261-4780, Fax: + (55) (44) 3261-4792 E-mail: grajohann@yahoo.com.br
²Chemical Engineering Department, State University of West Paraná, Rua da Faculdade 645, 85903-000, Toledo - PR, Brazil.
(Submitted: May 4, 2013 ; Revised: November 15, 2013 ; Accepted: January 27, 2014)
Abstract - This study aims to develop a model that accurately represents the convective drying process of textile materials. The mathematical modeling was developed from energy and mass balances and, for the solution of the mathematical model, the technique of finite differences, in Cartesian coordinates, was used. It transforms the system of partial differential equations into a system of ordinary equations, with the unknowns, the temperature and humidity of both the air and the textile material. The simulation results were compared with experimental data obtained from the literature. In the statistical analysis the Shapiro-Wilk test was used to validate the model and, in all cases simulated, the results were p-values greater than 5 %, indicating normality of the data. The R-squared values were above 0.997 and the ratios Fcalculated/Fsimulated, at the 95 %
confidence level, higher than five, indicating that the modeling was predictive in all simulations.
Keywords: Textile convective drying; Moisture distribution; Simulation.
INTRODUCTION
The textile industry is one of many industries that utilizes large volumes of water in the manufacturing process (Cerqueira et al., 2009). In the last three dec-ades, the development of research related to drying has grown exponentially. In the textile industry, the drying process is one of the major cost elements among the textile finishing operations, directly affect-ing the specific energy consumption and the quality of the product; therefore, a proper understanding of drying is of great importance (Cay et al., 2010; Akyol
et al., 2010a).
According to Efremov (2000), the finishing proc-esses of textile material require repeated heat treat-ments, since more than 80% of all energy consumed in the production of textile material is due to the most common process and which consumes the most
energy: the drying process. Drying is a complex process involving simultaneous coupled transient heat, mass and momentum transport (Haghi and Amanifard, 2008). During drying of the textile mate-rial, the water moves from areas of high humidity to low humidity areas, meaning that the exterior must be drier than the interior (Herrero and Watai Ponce, 1985).
The study of the finishing processes of textile material requires a more detailed investigation of the kinetics of such processes, due to the complexity of describing it due to the transient regime which is es-tablished (Efremov, 1999). Therefore, it is of great importance to develop models that best describe the drying process.
transfers heat to the material by forced convection and, at the same time, carries away evaporated water (Akyol et al., 2010b).
According to Cheng and Fan (2005), since 1980 various mathematical models have been proposed in this field. The simulation for drying textile material can be derived from the model solution for heat and mass transfer of textile material and air drying.
Many theoretical models have been proposed for drying of porous materials in agriculture, ceramics, food, pharmaceuticals, paper pulp, minerals, poly-mers and textile materials, and these models are based on conservation of mass, energy and momen-tum, consisting of two sets of differential equations with their respective initial and boundary conditions (Lee et al. 2002). According to Akyol et al. (2012), many studies are available in the literature on the investigation of drying or heat and mass transfer mechanisms in textile fibers. However, most of the research done the heat and mass transfer in textile materials is focused on simplified models, which usually neglect convection in the gas phase.
The aim of the present work was to model and mathematically simulate the convective drying proc-ess of textile material, validating the model obtained by comparison with experimental data obtained from the literature and statistical analysis.
MATERIALS AND METHODS
Modeling of the Convective Drying
The kinetics of drying can be described by drying curves and the drying rate, which differ according to the nature of the solids and drying conditions. These curves show periods of constant and decreasing dry-ing rates. Obtaindry-ing generalized models which de-scribe the drying of textile materials during these periods is of great interest since they can be used to predict the drying time, in different conditions of operation of the dryer, directly from the solution of the developed model. In tissue, the material thick-ness is small; therefore, in the modeling it will be considered that the diffusion process in tissue is fast and the controlling step in mass transfer will be diffusion in the outward film. In this case the drying rate, ψ, can be expressed in terms of a mass transfer coefficient, kf , and of the difference in moisture in the gas, Yeq, and within the fluid phase, Y:
(
)
(
,)
f eq Sk Y T X Y
ψ = − (1)
The coefficient kf remains constant if the gas ve-locity and mass transfer area do not change during the drying process. The term Yeq is the humidity of the air in equilibrium with the tissue moisture
( )
Xin the solid at temperature TS.
For the mathematical formulation of the tissue dry-ing model, the followdry-ing considerations were made.
The air flows unidirectionally in the parallel di-rection of the textile material; the air behaves as an ideal gas in terms of modeling; the predominant step in mass transfer is diffusion in the outer film; con-ductive effects on the tissue are negligible compared to convective effects; the volume of the textile material remains constant; evaporation occurs only at the two faces of the tissue; the heat desorption of the textile-water system is equal to the vaporization heat of water; the humidity gradient varies only in the air flow direction; humidity of the tissue does not vary with thickness.
Based on these considerations, the following set of partial differential equations was obtained:
Mass balance of the water in air:
2
G G S
G G
TG
Y Y L
Y v vY
t t z z A
∂ρ + ρ ∂ = − ρ ∂ − ∂ρ + ψ
∂ ∂ ∂ ∂ (2)
where t is time, ρG is the density of dry gas, v is the velocity of the drying air, z is the space, LS =0.15 m is the side length of textile, ATG=0.087 m2is the transversal area of the air feed box.
Mass balance of the dry air:
G v G
t z
∂ρ = − ∂ρ
∂ ∂ (3)
Mass balance of water in the textile material:
2
S S
X t
∂ = − ψ
∂ ρ ε (4)
where ρS is the density of dry solid, ε =S 0.007m is the textile thickness.
Energy balance in air:
( )
(
)
2(
)
2
c S
G G G G G S
TG
S s TG
h L
U v H T T
t z A
L H A
∂ ρ = − ∂ ρ − −
∂ ∂
+ Δ ψ
where UG is the specific internal energy of the gas, G
H is the gas enthalpy, hc is the convective heat transfer coefficient, TG is the gas temperature, TS is the solid temperature, ΔHs is the desorption enthalpy.
Energy balance in the textile material:
(
)
2 2
S c
S G s
S S S S
U h
T T H t
∂ = − − Δ ψ
∂ ρ ε ρ ε (6)
where US is the specific internal energy of the solid. Equation (1) was used to represent the drying rate. Resolution of the obtained model required some additional equations described below:
Heat of vaporization of pure water, as given by Silva (1995):
S WS v
s
h
Cp
cp
T
H
=
Δ
0+
(
−
)
Δ
(7)where Δh0 is the water vaporization energy at 0 °C; v
Cp is the heat capacity at constant pressure of the steam in the solid; cpWS is the heat capacity at constant pressure of water in the solid.
Desorption isotherm for the textile as analyzed by Sousa (2003):
0.49
ln 1
936.26 430.41 exp
e S UR X T ⎡ − ⎤ ⎣ ⎦ = ⎛− ⎞ − ⎜ ⎟ ⎝ ⎠ (8)
where Xe is the absolute equilibrium humidity con-tent of the solid on a dry basis, UR is the air relative humidity on a dry basis.
The absolute humidity of water in air:
0.622 1 eq Y Y Y + =
− (9)
The vapor pressure of water:
(
)
5 4 3 2 1
8
6 7
((( ) ) )
( ) exp
)
S S S S
v S
S S
v T v T v T v T v P T v
v v T T
⎡ + + + + ⎤
= ⎢ ⎥
−
⎣ ⎦ (10)
where Pv is the vapor pressure of water, vi are the equation coefficients, found in Brooker et al. (1974).
The following initial and boundary conditions were used: 0 0 0 0 0
ci1: ( 0, )
ci2: ( 0, )
ci3: ( 0, )
ci4: ( 0, )
ci5: ( 0, )
cc1: ( , 0)
cc2: ( , 0)
G G
S S
G G
feed
G G feed
Y t z Y X t z X T t z T T t z T
t z Y t z Y T t z T
⎧ = =
⎪ = =
⎪ = =
⎨
⎪ = =
⎪ ρ = = ρ
⎩
= = ⎧
⎨ = =
⎩
where Y0 is the humidity,
0
G
T is the initial tempera-ture of ambient air,
0
S
T is the initial temperature of the textile,
0
G
ρ is the initial density of ambient air, Yfeed
is the humidity of hot air used for drying.
Statistical Analysis
The statistical tests should be performed in order to validate the model obtained from the mass and energy balances, and even to test the considerations used in model simplification. The test for the coeffi-cient of determination, known as a test of R-squared, is the square of the coefficient of Pearson correla-tion. It is a measure of the proportion of the variabil-ity in a variable which is explained by the variabilvariabil-ity of the other (Barros Neto et al., 1995). Considering the study of drying, the R-squared value indicates the proportion of the moisture of the textile material ex-plained by the model when compared to experimen-tal data.
Moreover, according to Barros Neto et al. (1995), the F-test statistical analysis can be used to deter-mine if the model is predictive, or whether it can be used for prediction of the variables studied. Accord-ing to the authors, for predictive purposes, the value of Fcalculated (average square error of regression /
average square error of residuals) should be at least four to five times the value of Ftabelated.
The W test, developed by Shapiro and Wilk (1965), is essentially the square of the Pearson cor-relation coefficient, computed between the statistical order of the sample and that for a population that is Gaussian. If the value of W is close to 1.0 the sample behaves like a Normal sample, whereas if W is be-low 1.0 the sample is non-Gaussian. The original Shapiro-Wilk test is defined as:
( ) ( )
(
)
(
)
2 1 1 2 1 ki n i i
i
n i i
a x x W X X − + = = ⎡ − ⎤ ⎢ ⎥ ⎣ ⎦ = −
∑
where n is the number of observations, k is
approxi-mately n/ 2, ' 1
(
' 2)
1/21
' ( ,..., n) ,
a = a a =mV− mV− −m −
,
m V are the mean vector and covariance matrix of
the order statistics of the standard normal distribu-tion X=
(
X1n,...,Xnn)
' (Bai and Chen, 2003).The p-value test of W is calculated by the fol-lowing equation:
ln 1
n n n
W d z b c
W
−
⎡ ⎤
= + ⎢⎣ − ⎥⎦ (12)
where the coefficients are obtained in the second vol-ume of the Biometrika Tables (Pearson and Hartley, 1976), by entering the value of n.
In statistics, the null hypothesis is a hypothesis that is presumed true until statistical evidence in the form of hypothesis testing indicates otherwise. It is a hypothesis that depends on confront with the facts. From the analysis of the results obtained with the drying model, it can be confirmed that the parame-ters or mathematical characteristics obtained from the model (population 1) are identical or not to the experimental results (population 2). The p-value is the probability that the sample could be taken from a population being tested assuming that the null hypothesis is true. A value of 0.05, for example, indicates that there is a probability of 5% that the test sample may have been removed from the assembly, assuming that the null hypothesis is true.
RESULTS AND DISCUSSION
The simulations were performed for velocities of 0.5, 1.0 and 1.5 m/s at temperatures of 50, 60 and 70 °C. These conditions were experimentally used by Sousa (2003) in order to compare the model results with those obtained in the laboratory.
To solve the system of differential equations from Eq. (2) to Eq. (6) the method of lines was used. In this method the spatial derivatives were approxi-mated by finite differences. This method transforms the system of partial differential equations into a system of ordinary equations. To apply this method, the problem domain is divided into (n) discretization elements. In solving the mathematical model a com-puter program in FORTRAN language was devel-oped, employing the subroutine DASSL (Differen-tial/Algebric Equation system solver) developed by Petzold (1982) that uses backward differentiation formulas. The DASSL code requires a consistent set
of values for the dependent variables (Y, X , TG e
S
T ) and their respective derivatives with respect to time. In cases where the boundary condition is dis-continuous it is necessary to modify it (Madras et al. 1994). In the drying problem investigated, the initial ambient temperature and humidity (
0 G
T ,Y0) are suddenly raised to TG feed and Yfeed in dryer feeding (z=0), and maintained at that value. This boundary condition was modified in order to make it continuous in the time variable according to the following expressions:
(
0)
s t G G feed G G feed
T =T + T −T ⋅e− ⋅ (13)
(
0)
s t feed feedY=Y + Y −Y ⋅e− ⋅ (14)
with s = 108 min-1
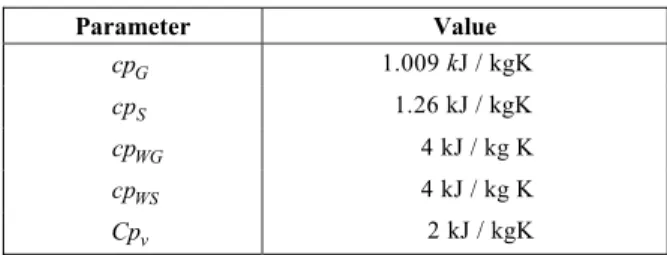
Table 1 shows the values of the heat capacities involved in the problem of crude cotton convective drying, material used by Sousa (2003) in the experimental analysis of textile drying process.
Table 1: Specific heat values of crude cotton.
Parameter Value
G
cp 1.009 J / k kgK S
cp 1.26 kJ / kgK
WG
cp 4 kJ / kg K
WS
cp 4 kJ / kg K
v
Cp 2 kJ / kgK
The solution of the equation system occurred simultaneously with the optimization of the heat transfer coefficient, hc. The initial estimates for
val-ues of hc were calculated according to the method proposed by Xue (2004), using that from the ex-perimental data, proposes the use of the following equation:
(
)
c G S S
S
h T T dw
m
dt H
−
= Δ (15)
where mS is the textile weight, dw dt/ is the drying rate.
the other parameters in Equation (15), yielding the value of hc.
According to Treybal (1980), when the flow direction and the air velocity are constant, the coefficients of mass and heat transfer are constant. One can then correlate the mass transfer coefficient with the coefficient of convective heat transfer by the Chilton-Colburn analogy, which is based on the analysis of the thermal and concentration boundary layers:
2/3
1 Pr
f
G G
k
hc cp Sc
⎛ ⎞
=ρ ⎜ ⎟
⎝ ⎠ (16)
where cpG is the heat capacity at constant pressure of the dry gas, Pr is the Prandlt number, Sc is the Schmidt number.
Figure 1 shows the simulated and experimental results, obtained by Sousa (2003) from the moisture profile for a drying air temperature equal to 70 ºC, with flows of 0.5, 1.0 and 1.5 m/s. Figures 2 and 3 show the moisture profile at temperatures of 60 ºC and 50 ºC, respectively. From these three graphs, one can observe the influence of the air velocity on drying. In the case of a temperature of 70 °C, for a speed of 1.5 m/s, the moisture equilibrium is reached in about 15 minutes, for 60 °C in 20 min and for 50 °C in 30 min. As for drying at 1.0 m/s, it is ob-served that the equilibrium moisture content is reached in 20, 30 and 40 min at 70 ºC, 60 ºC and 50 ºC, respectively. In the case of low air velocity analyzed, 0.5 m/s, it was observed that the moisture equilib-rium is only reached at operational times of 30, 40 and 60 minutes for air temperatures of 70 °C, 60 °C and 50 °C, respectively.
Therefore, when keeping the temperature con-stant and increasing the velocity of air different equilibration times are obtained. The higher the velocity, the shorter the time required to reach equi-librium between the moisture content of the textile material and air drying. This is the expected result, since the mass transfer is greater in air at higher speeds.
The statistical analysis was performed with the software Statistica 5.1®, with which the p-value of the Shapiro-Wilk test was calculated, besides the distribution profiles of waste. For all conditions tested, the R-squared value was higher than 0.997 and the p-value was higher than 0.05, indicating that the difference between the experimental values and those obtained by the model was not significant. The
most normal behavior was 1.5 m/s and 60 °C and the lowest at 0.5 m/s and 70 °C.
Figure 1: Effect of the air drying velocity at 70 oC
Figure 2: Effect of the air drying velocity at 60 °C.
Figure 3: Effect of the air drying velocity at 50 °C.
The maximum and the average error between the experimental and calculated humidity was calcu-lated. It is observed that the largest average error (Xexp-Xcal)/Xexp, was 0.294 and the largest maximum
error was 0.785.
To determine whether the obtained model was predictive, the F test was performed. For all simu-lated conditions, ratios Fcalculated/Fsimulated, at the 95%
CONCLUSIONS
Based on the results it can be concluded that the model developed, together with the numerical method used for solving the equations system, was effective in describing the phenomenon of drying textile mate-rial by forced convection, in simulated operating conditions. The simulated moisture profiles are in accord with experiment and, in all cases, the statisti-cal analyses used in the validation of the results pre-sented Shapiro-Wilk tests with p-values greater than 5%, indicating normality between the literature data and the results obtained by the model solution of drying textiles materials, with R-squared values higher than 0.997. The Fcalculated/Fsimulated ratios greater than
five indicated that the modeling was predictive in all simulations.
NOMENCLATURE
i
a Equation (11) parameter
-TG
A Transversal area of the air feed box
m2
b Equation (12) parameter
-c Equation (12) parameter
-G
cp Specific heat of dry air, at
constant pressure
kJ/(kg air K)
S
cp Specific heat of the dry
solid, at constant pressure
kJ/(kg solid K)
WG
cp Specific heat of steam in
air, at constant pressure
kJ/(kg water K)
WS
cp Specific heat of water in
solid, at constant pressure
kJ/(kg water K)
v
Cp Specific heat of steam in the
solid, at constant pressure
kJ/(kg water K)
d Equation (12) parameter
-obj
F Objective Function
-c
h Convective heat-transfer coefficient
kJ/(m2 K min)
G
H Air enthalpy kJ/kg total
f
k Mass transfer coefficient kg water/
(m2 min ΔY)
S
L Length of textile m
S
m High basis weigh of textile kg/m2
n Sample number
-Nu Nusselt number
-Pr -Prandlt number
-v
P Steam pressure Pa
Re Reynolds number
-s Equation (11) parameter
-t Time min
0 G
T Ambient temperature K
G
T Gas temperature K
S
T Solid temperature K
Gfeed
T Gas feed temperature K
G
U Internal energy of the gas kJ/kg total air
S
U Internal energy of the solid kJ/kg solid
UR Relative moisture of the air, dry basis
kg water/ kg dry air
v Air velocity m/min
i
v Constant for steam pressure calculation
-Y Absolute moisture of air, dry basis
kg water/ kg dry solid
eq
Y Absolute equilibrium moisture of air, dry basis
kg water/ kg dry solid
X Absolute moisture of solid, dry basis
kg water/ kg dry solid
e
X Absolute equilibrium moisture of solid, dry basis
kg water/ kg dry solid
cal
X Calculated absolute
moisture of solid, dry basis
kg water/ kg dry solid
exp
X Experimental absolute moisture of solid, dry basis
kg water/ kg dry solid
W Shapiro-Wilk statistics
-z Space m
Greek Symbols
ψ Drying rate kg water/m3
s
0
h
Δ Vaporization energy of
water at 0 °C
kJ/kg K
s
H
Δ Desorption enthalpy kJ/kg water
G
ρ Dry air density kg dry air/m3
0 G
ρ Initial density of ambient air kg dry air/m3
S
ρ Dry solid density kg dry solid /m3
S
ε Solid thickness m
REFERENCES
Akyol, U., Cihan, A., Kahveci, K., Experimental and theoretical investigation of drying kinetics of cotton bobbins. 7th International Conference – TEXSCI, September 6-8, Liberec, Czech Republic (2010a).
Akyol, U., Cihan, A., Shaliyev, R., Thermophysical parameter estimation of a wool bobbin during convective drying process. Inverse Problems in Science and Engineering, No. 18, p. 227 (2010b). Akyol, U., Kamil, K., Cihan A., Determination of
Bai, Z. D., Chen, L., Weighted W test for normality and asymptotics a revisit of Chen–Shapiro test for normality. Journal of Statistical Planning and In-ference, No. 113, p. 485 (2003).
Barros Neto, B., Scarmínio, I. S., Bruns, R. E., Planejamento e Otimização de Experimentos. Campinas, Editora da UNICAMP (1995). (In Portuguese).
Brooker, D. W., Bakker-Arkema, F. W., Hall, C. W., Drying Cereals Grains. Westport, the AVI Pub-lishing Company (1974).
Cay, A., Tarakçıoğlu, I., Hepbasli, A., Exergetic analysis of textile convective drying with stenters by subsystem models: Part 1 – Exergetic model-ing and evaluation. Drymodel-ing Technology, 28(12), 1359-1367 (2010).
Cerqueira, A., Russo, C., Marques, M. R. C., Elec-trofloculation for textile wastewater treatment. Brazilian Journal of Chemical Engineering, No. 26, p. 659 (2009).
Cheng, X. Y., Fan. J., Heat and moisture transfer with sorption and phase change through clothing assemblies Part II: Theoretical modeling, simula-tion, and comparison with experimental results. Textile Resource Journal, No. 75, p. 187 (2005). Efremov, G. I., Development of Generalized Methods
of Calculating Non-Steady Heterogeneous Proc-esses in Chemical Engineering and in Finishing of Textiles. Doctoral Dissertation, Moscow State Textile Academy – Moscow (1999).
Efremov, G. I., Generalized kinetics of drying of fiber materials. Fiber Chemistry, No. 32, p. 431 (2000).
Haghi, A. K. and Amanifard, N., Analysis of heat and mass transfer during microwave drying of food products. Brazilian Journal of Chemical En-gineering, No. 265, p. 491 (2008).
Lee, H. S., Carr, W. W., Beckham, H. W., Leisen, J., A model of through of tufted textile materials. International Journal of Heat and Mass Transfer, No. 45, p. 357 (2002).
Madras, G., Thibaud, C., Erkey, C., Akgerman, A. Modeling of supercritical extraction of organics from solid matrix. AIChE Journal, No. 40, p. 777 (1994).
Pearson, E. S., Hartley, H. O., Biometrika Tables for Statisticians. Vol. 2, Reprinted with Corrections. Biometrika Trust, London, p. 385 (1976).
Petzold, L. R., A Description of DASSL: A Dif-ferential/Algebric Equation System Solver. STR, SAND82-8637, Livermore (1982).
Silva, E. A., Drying of Gelatin – Analysis of Con-centration Profile Inside the Gel. Master Thesis, PEQ/DEQ/UEM, Maringá-PR (1995).
Sousa, L. H. C. D., Study of Textile Materials Drying. Ph.D. Thesis, PEQ/DEQ/UEM, Maringá – PR (2003).
Shapiro, S. S., Wilk, M. B., An analysis of variance test for normality (complete samples). Biometrika, p. 591 (1965).
Treybal, R. E, Mass-Transfer Operations. New York, McGraw Hill (1980).