ISSN 0104-6632 Printed in Brazil
www.abeq.org.br/bjche
Vol. 28, No. 02, pp. 295 - 304, April - June, 2011
Brazilian Journal
of Chemical
Engineering
ADSORPTION ISOTHERMS AND
THERMOCHEMICAL DATA OF FD&C RED N° 40
BINDING BY CHITOSAN
J. S. Piccin, G. L. Dotto and L. A. A. Pinto
*Unit Operation laboratory, School of Chemistry and Food, Phone: + (55) (53) 3233-8648, Fax: + (55) (53) 3233-8745, Federal University of Rio Grande, FURG, 475, Engenheiro Alfredo Huch street, 96201-900, Rio Grande - RS, Brazil.
E-mail: [email protected]
(Submitted: November 23, 2009 ; Revised: March 30, 2010 ; Accepted: January 15, 2011)
Abstract - Chitosan is a natural polymer that has been employed in dye adsorption. In this work, adsorption and thermodynamic data for the interaction of FD&C Red n° 40 food dye with chitosan in aqueous solutions were investigated. The equilibrium adsorption isotherms were determined by the batch method, from 298 to 338 K. Adsorption data were adjusted to five isotherm models: Langmuir, Freundlich, Redlich-Peterson, Temkin and Dubinin-Radushkevich, in order to determine which presented the best adjustment to the experimental data. Error analysis showed that the Langmuir isotherm model was the most appropriate for fitting the experimental data, with a maximum monolayer adsorption of 3065.8 μmol g-1 at 308 K. Negative enthalpy (-112.7 kJ mol-1), entropy (-0.338 kJ mol-1 K-1) and Gibbs free energy (-15.6 to 1.0 kJ mol-1) values demonstrated that the adsorption process is exothermic, spontaneous, favorable, and that randomness of the system decreases during the adsorption process.
Keywords: Dye adsorption; Chitosan; Isotherm models.
INTRODUCTION
Chitosan, the deacetylated form of chitin, is a polymer composed of glucosamine residues linked by
β-1, 4 glycosidic bonds. Chitin is usually obtained from waste materials of the seafood processing industry, mainly crab, shrimp, prawn, and krill shells (Jayakumar et al., 2010). This process requires chemical treatments to eliminate inorganic materials, proteins, lipids, and pigments. Chitin can be converted into chitosan by enzymatic means or alkali deacetylation, with the latter being the method most used (Weska et al., 2007).
Chitosan has many applications in agriculture, medicine, environment and food. Recently, several workers observed a high potential of chitosan for the adsorption of dyes (Annadurai et al., 2008; Sakkayawong et al., 2007; Uzun and Guzel, 2005; Wong et al., 2004), metal ions (Gamage and Shahidi,
2007; Ngah et al., 2006; Franco et al., 2004) and proteins (Wibowo et al., 2007; Casal et al., 2006).
Foods, Drugs and Cosmetics (FD&C) dye Red n° 40 (C.I. 16035) is an artificial azobenzene dye whose structure is a disodium (E)-6-hydroxy-5-((2-methoxy-5-methyl-4-sulfonatophenyl) diazenyl) naphthalene-2-sulfonate (C18H14N2O8S2Na2), molecular weight of
496.4 g mol-1). It is widely used for dyeing sweets, chewing gum, jellies, puddings, juices, jams, mustard, drugs and cosmetics (Piccin et al., 2009) and termochemical parameters of this dye do not exist in the literature. In addition, recent works have used chitosan to adsorb textile dyes (Cheung et al., 2009; Chatterjee, et al. 2009; Annadurai et al., 2008; Sakkayawong et al., 2007; Uzun and Guzel, 2005; Wong et al., 2004), but food dyes have been little investigated (Piccin et al., 2009; Cestari et al., 2008).
Adsorption properties and equilibrium data, commonly known as adsorption isotherms, describe how pollutants interact with adsorbent materials and so are critical for optimizing the use of adsorbents. The two most frequently used equations applied in chitosan/dye systems for describing sorption isotherms are the Langmuir and the Freundlich models; in addition, Temkin, Redlich-Peterson, Sips, Harkins-Jura, Halsey and Dubinin-Radushkevich isotherms are used (Crini and Badot, 2008). Moreover, the shape of an isotherm not only provides information on the adsorption affinity of dye molecules, but also reflects thermodynamic data, providing relevant information about adsorption spontaneity and the stability of the adsorbent–adsorbate interactions (Annadurai et al., 2008; Crini and Badot, 2008).
In this research, the adsorption isotherm technique was used to verify the affinity between chitosan and FD&C Red n° 40. Five isotherm models were used and error analysis was carried out to test adequacy and accuracy. Adsorption thermodynamic parameters, such as the Gibbs free energy and enthalpy and entropy of adsorption were also found, due to their importance as parameters required for any industrial adsorption system design.
MATERIALS AND METHODS
Materials
Commercial dye (FD&C Red n° 40) was supplied by a local manufacturer, with a labeled purity of over 85%. All other reagents used were of analytical-reagent grade.
Raw material used for chitin production was shrimp (Farfantepenaeus brasiliensis) shell wastes, obtained from fish industries of Rio Grande city, RS state, Brazil. Chitin was obtained at a pilot scale
through the following steps: demineralization, which consists of reducing the ashes of the raw material; deproteinization, where there is a reduction of the protein nitrogen of the shrimp wastes; and deodorization, for reducing shrimp characteristic odor (Weska et al., 2007; Piccin et al., 2009).
Deacetylation was carried out on a small scale in a reactor, under heating and stirring, by adding 2 L of sodium hydroxide solution (425 g L-1) to 30 g of chitin. Reaction temperature was 130°C and deacetylation was carried out for 100 min. Chitosan was purified according to Weska et al. (2007) and dried in a tray drier until reaching commercial moisture content (7.0–10.0%, wet basis). Chitosan was milled by a mill (WILEY MILL STANDARD model nº 3, USA) and sieved until the discrete particle size ranged from 100 ± 20 μm.
Deacetylation degree was determined by FT-IR analysis (Cerveira et al., 2004). Molar weight of chitosan was determined by the intrinsic viscosity method described by Roberts and Domszy (1982) and Weska et al. (2007). These experiments were carried out in triplicate, obtaining a deacetylation degree value of 86 ± 2% and molar weight value of 170 ± 10 kDa. Chitosan powder particles had specific mass of 1.55 g cm-3 and sphericity of 0.75.
Equilibrium Adsorption Methodology
Experiments were carried out at different temperatures (298 to 338 K) in order to calculate the thermodynamic parameters. The equilibrium adsorption isotherm was determined by batch studies according to Piccin et al. (2009). The powder adsorbent material chitosan (0.05 g) was added to 100 mL of water and the pH of the chitosan/water mixture was adjusted to 6.0 with citric acid/sodium diphosphate buffer solutions (0.1 mol L-1). A time was allowed for the pH to enter into equilibrium (approximately 30 min), measuring it before and after the adsorption with a pHmeter (Marte model MB10, Brazil). Afterwards, different volumes (5 to 35 mL) of the buffered dye solution containing 2 g L-1 were added to the adsorbent solutions and completed to 200 mL with distilled water. Mixtures were placed into
500 mL flasks and stirred at 100 rpmusing a
Wagner-type stove with agitation (FANEM model 315 SE, Brazil). The experiments were carried out in replicate.
by spectrophotometry (QUIMIS model Q108 DRM, Brazil) at 500 nm. The adsorption capacity (qe), valid
when the solute remaining in the liquid filling the pores is negligible, was determined according to Equation (1) (Crini and Badot, 2008; Piccin et al., 2009; Konaganti et al., 2010):
i e e
C C
q V
m −
= (1)
where Ci is the initial dye concentration (mol L-1), Ce is
the equilibrium concentration (mol L-1), m is the mass of adsorbate (g) and V is the volume of solution (L).
Adsorption Isotherms Models
Adsorption equilibrium is a fundamental property in adsorption studies; considering that fact, numerous studies have been conducted in order to determine the amount of species adsorbed under a given set of conditions. In order to optimize the design of an adsorption system for dye removal from solutions, it is important to find the most appropriate correlation for the equilibrium curve (Crini and Badot, 2008; Wong et al., 2004). Adsorption isotherm models are described in many mathematical forms, some of which are based on a simplified physical description of adsorption and desorption, while others are purely empirical and intended to correlate experimental data. In this work, various adsorption isotherm models were fitted to the experimental equilibrium data in order to verify which model presented the best adjustment.
The Langmuir theory has, as its basic assumption, that adsorption occurs at specific homogeneous sites inside of the adsorbent and, once a dye molecule occupies a site, no additional adsorption can occur there. The Langmuir isotherm model can be described as in Equation (2).
e e
e L m m
C 1 C
q =K q +q (2)
where qm is the maximum monolayer adsorption
capacity (mol g-1), KL is the Langmuir constant
(L mol-1), and qe and Ce are the adsorption capacity
(mol g-1) and equilibrium concentration (mol L-1), respectively. Plotting Ce/qe versus Ce (Equation (2))
results in a straight line of slope 1/qm and intercept
1/KL qm.
The Freundlich isotherm model is used for heterogeneous surface energy systems and for
description of multilayer adsorption with interaction between adsorbed molecules. The Freundlich isotherm can be described by Equation (3).
( )
e( )
F( )
e1
ln q ln K ln C
n
= + (3)
The constants associated with the Freundlich
isotherm model are sorption capacity (KF) and
sorption intensity (1/n). Moreover, the exponent (1/n) provides an indication of favorability and capacity of the adsorbent/adsorbate system. Plotting ln qe versus ln Ce (Equation (3)) results in a straight
line of slope 1/n and intercept ln KF.
The Redlich-Peterson (R-P) isotherm model is used for representing adsorption equilibrium over a wide concentration range, and can be applied in either homogeneous or heterogeneous systems due to its versatility. It can be described by Equation (4).
( )
( )
e
R R e
e C
ln K 1 ln a ln C
q
⎛ ⎞
− = + β
⎜ ⎟
⎝ ⎠ (4)
where KR is the R-P constant (L g-1), aR is the R-P
constant (L mg-1) and β is the exponent which lies between 1 and 0 (Mane et al., 2007; Wong et al. 2004). Plotting the left-hand side of Equation (4) against ln Ce for obtaining the isotherm constants is not applicable because of the three unknowns, aR, KR
and β. Therefore, a maximization procedure of the
coefficient of correlation was adopted for solving Equation (4) by minimizing the distance between experimental data points and theoretical model
predictions, through the solver add-in function of
Microsoft Excel.
The Temkin isotherm model assumes that the adsorption heat of all molecules decreases linearly with the increase in coverage of the adsorbent surface, and that adsorption is characterized by a uniform distribution of binding energies, up to a maximum binding energy. The Temkin isotherm can be described by Equation (5).
e T e
RT RT
q ln K ln C
b b
= + (5)
where KT is the equilibrium binding constant (L mol-1)
corresponding to the maximum binding energy, b is related to the adsorption heat, R is the universal gas constant (8.314 J K−1 mol−1) and T is the temperature (K). Plotting qe versus ln(Ce) (Equation (5)) results in
The Dubinin-Radushkevich (D-R) isotherm model considers that adsorbent size is comparable to the micropore size and the adsorption equilibrium relation for a given adsorbate-adsorbent combination can be expressed independently of temperature by using the adsorption potential (ε) (Equation (6)).
e 1 RT ln 1
C
⎛ ⎞
ε = ⎜ + ⎟
⎝ ⎠ (6)
The D-R isotherm assumes a Gaussian-type distribution for the characteristic curve and the model can be described by Equation (7).
2 e S
ln q =ln q − εB (7)
where qs is the D-R constant (mol g-1) and B gives the
mean sorption free energy E (kJ mol-1) per molecule
of sorbate at the moment of its transfer to the solid surface from the bulk solution and can be computed using Equation (8) (Mane et al., 2007).
( )
12
1 E
2B
= (8)
Values of qs and B can be determined through
linearization of the D-R isotherm. Plotting ln qe versus ε2, using Equation (7), results in a straight line of slope B and intercept ln(qs).
Error Analysis
Determination of the best isotherm model is only possible through analysis of the correlation coefficient (R2). Although efficient, this indicator is limited to solving isotherm models that present linear forms (Wong et al., 2004). Therefore, in this work, three different error functions were employed in order to discover the isotherm model most suitable for representing the experimental data.
The Sum of Squared Errors (SSE) (Equation (9)) is the most commonly utilized error function. However, it has the disadvantage of providing isotherm parameters that present better adjustment to the final portion of the isotherm. This is due to the magnitude of the errors, which causes an increase in squared errors as the adsorbate concentration increases. The sum of absolute errors (SAE) (Equation (10)) also provides better adjustments for higher concentrations. This occurs because an increase of the concentration range causes an increase in error. The average relative error (ARE) (Equation (11)) function attempts to minimize the
fractional error distribution across the entire concentration range. These error analyses were applied by Mane et al. (2007) and Wong et al. (2004) in order to verify which model presented better isotherm adjustment for chitosan and rice husk ash dye adsorptions.
(
)
2n
e,calc e,meas i 1 i
SSE q q
=
=
∑
− (9)n
e,calc e,meas i i 1
SAE q q
=
=
∑
− (10)n
e,calc e,meas e,meas i 1 i
q q
100 ARE
n = q
−
=
∑
(11)where qe,calc is the calculated value, qe,meas is the
measured value and n is the number of data points .
Adsorption Thermodynamics
Adsorption thermodynamics were determined using the thermodynamic equilibrium coefficients obtained at different temperatures and concentrations in order to verify possible adsorption mechanisms (Crini and Badot, 2008). The adsorption characteristics of a material can be expressed in terms of thermodynamic
parameters such as ΔG (Gibbs free energy change),
which can be calculated by Equation (12).
D
G - RT ln K
Δ = (12)
where KD is the thermodynamic equilibrium constant
(L g-1). According to Niwas et al. (2000), KD can be
obtained by plotting qe/Ce vs. qe and extrapolating
qe to zero.
According to thermodynamics, the Gibbs free energy is the difference between the adsorption
enthalpy (ΔH) and adsorption entropy (ΔS)
multiplied by the temperature. In this manner, by applying this concept to Equation (12), the
thermochemical parameters ΔH and ΔS can be
determined using van’t Hoff’s plot, according to Equation (13).
D
H S
ln K
RT R
Δ Δ
= − + (13)
RESULTS AND DISCUSSION
Equilibrium Data
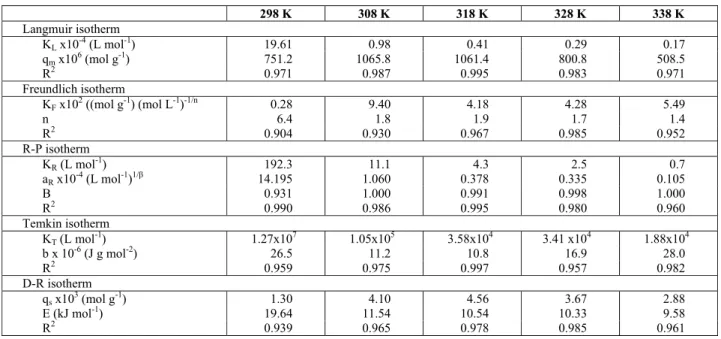
Figure 1 shows the effect of temperature (298 at 338 K) on the adsorption of FD&C Red n° 40 dye by chitosan.
0 50 100 150 200 250 300 350 400 450 500
Ce (mol L-1) x106
0 1 2 3 4 5 6 7 8 qe ( m ol g
-1) x10
4
Ce (mol L-1) x 106
0 50 100 150 200 250 300 350 400 450 500 0 1 2 3 4 5 6 7 8 qe (mol g
-1) x1
0
4
0 50 100 150 200 250 300 350 400 450 500
Ce (mol L-1) x106
0 1 2 3 4 5 6 7 8 qe ( m ol g
-1) x10
4
Ce (mol L-1) x 106
0 50 100 150 200 250 300 350 400 450 500 0 1 2 3 4 5 6 7 8 qe (mol g
-1) x1
0
4
Ce (mol L-1) x 106
0 50 100 150 200 250 300 350 400 450 500 0 50 100 150 200 250 300 350 400 450 500 0 1 2 3 4 5 6 7 8 0 1 2 3 4 5 6 7 8 qe (mol g
-1) x1
0
4
Figure 1: Adsorption isotherms of FD&C Red n° 40 by chitosan: ■ T=298 K; ▲ T=308 K; ● T=318 K;
○ T=328 K; □ T=338 K
In Figure 1, it can be observed that a temperature increase causes a decrease in adsorption. This occurred because chitosan adsorption of the dye at acid pH is controlled by chemisorption (Stefanich et al., 1994; Saha et al., 2005; Crini and badot, 2008; Piccin et al., 2009), in addition, but with less intensity, physical chitosan-dye interactions occur. Protonated amino groups of chitosan interact with sulfonate groups of the dye. This reaction is an exothermic process (Saha et al., 2005). The physical interaction between the dye and
chitosan is weakened due to decreased hydrogen bond and van der Waals interactions. Combination of these factors was responsible for the adsorption capacity decrease with temperature increase. This indicates that chitosan adsorption of FD&C n° 40 is a chemisorption controlled by an exothermic process. A similar effect is observed for adsorption of Indigo Carmine dye by chitosan (Anjos et al, 2002) and Congo Red by chitosan hydrobeads (Chatterjee et al., 2007).”
Adsorption Isotherms Models
The Langmuir (Equation (2)), Freundlich (Equation (3)), R-P (Equation (4)), Temkin (Equation (5)) and D-R (Equation (7)) isotherm parameters were determined through the linearized form and their values, along with the respective correlation coefficients, are listed in Table 1.
Table 1 shows that the best correlation coefficients were, in decreasing order, Langmuir > R-P > Temkin > D-R > Freundlich models. Table 1 also shows that qm and qs values of the Langmuir and
D-R isotherm models increase below 308 K, and decrease above 318 K. However, the b parameter values of the Temkin model present a behavior contrary to the one observed for qm and qs. In this
temperature range, interaction between the dye and chitosan is probably larger due to the existence of a higher number of exposed adsorption sites. However, at high temperatures, the physical interaction between FD&C Red n° 40 and chitosan weakens due to weakening of hydrogen bonds and van der Waal interactions. A similar effect is observed for adsorption of Congo Red by chitosan hydrobeads (Chatterjee et al., 2007).
Table 1: Isotherm parameters for removal of FD&C Red no 40 by chitosan.
298 K 308 K 318 K 328 K 338 K
Langmuir isotherm
KL x10-4 (L mol-1) 19.61 0.98 0.41 0.29 0.17
qm x106 (mol g-1) 751.2 1065.8 1061.4 800.8 508.5
R2 0.971 0.987 0.995 0.983 0.971
Freundlich isotherm
KF x102 ((mol g-1) (mol L-1)-1/n 0.28 9.40 4.18 4.28 5.49
n 6.4 1.8 1.9 1.7 1.4
R2 0.904 0.930 0.967 0.985 0.952
R-P isotherm
KR (L mol-1) 192.3 11.1 4.3 2.5 0.7
aR x10-4 (L mol-1)1/β 14.195 1.060 0.378 0.335 0.105
Β 0.931 1.000 0.991 0.998 1.000
R2 0.990 0.986 0.995 0.980 0.960
Temkin isotherm
KT (L mol-1) 1.27x10⁷ 1.05x10⁵ 3.58x10⁴ 3.41 x10⁴ 1.88x104
b x 10-6 (J g mol-2) 26.5 11.2 10.8 16.9 28.0
R2 0.959 0.975 0.997 0.957 0.982
D-R isotherm
qs x103 (mol g-1) 1.30 4.10 4.56 3.67 2.88
E (kJ mol-1) 19.64 11.54 10.54 10.33 9.58
Chatterjee et al. (2007) observed that the
maximum monolayer adsorption capacity (qm) of
Congo Red dye by chitosan was 1.34x10⁻⁴ mol g-1 at temperatures of 293 and 303 K. Above 303 K, values lowered again to 1.15x10⁻⁴ mol g-1. In the range from 308 to 323 K, the maximum monolayer adsorption capacity of Indigo Carmine dye by chitosan decreased linearly from 1.28x10⁻⁵ to 0.85 x10⁻⁵ mol g-1 (Anjos et al., 2002). However, Annadurai et al. (2008) found that the maximum monolayer adsorption capacity of Remazol Black n° 13 dye by chitosan increased from 9.2x10⁵ to 13.1 x10⁵ mol g-1 in the temperature range of 303 to 333 K. This demonstrates that the maximum monolayer adsorption capacity can vary in relation to temperature due to many factors, such as chemical structure of the dye and adsorbent, molecular size and nature of the adsorbent.
The KL parameter of the Langmuir model, which
corresponds to the concentration at which
equilibrium concentration is 0.5qm, in relation to
temperature suggests that monolayer saturation (qm)
values were reached with higher equilibrium concentrations (Ce). Adsorption intensity (n) values
of the Freundlich isotherm model demonstrate that the FD&C Red n° 40 adsorption by chitosan is more favorable at low temperatures (Annadurai et al., 2008; Mane et al., 2007).
The R-P isotherm model presented β parameter
values of approximately 1.0, demonstrating that the Langmuir isotherm is as satisfactory as the R-P isotherm for representing experimental data. Similar
β parameter values were observed by Hameed et al.
(2008) and Mane et al. (2007).
Free sorption energy (E) of the D-R isotherm
model decreased from 35.46 to 9.58 kJ mol-1 with a
temperature increase from 298 to 338 K. These values suggest that adsorption occurs through ion exchange (Demiral et al., 2008; Ünlü and Ersoz, 2006; Kilislioglu and Bilgin, 2003). Mane et al. (2007) observed that energy values of Brilliant Green sorption by rice husk ash decreased from
19.31 to 2.1 kJ mol-1 with a temperature increase
from 298 to 318 K. Energy of Neural Red adsorption by peanut husk was observed and values indicate that physiosorption played a significant role in the adsorption process (Runping et al., 2008).
Values of the error functions are presented in Table 2.
Analysis of Table 2 shows that the Langmuir, R-P and Temkin models have smaller errors in almost all of the cases and that the Freudlich and D-R models did not show high accuracy. In this case, the Langmuir isotherm model can be more useful for describing the adsorption process of FD&C Red n° 40 by chitosan, due to the fact that the R-P isotherm parameters cannot be determined by linearization because it contains three unknown parameters (Wong et al., 2004) and that the Temkin model does not offer information on maximum adsorption capacity. Mane et al. (2007) also observed, through error analyses, a better adjustment of the Langmuir isotherm model for Brilliant Green adsorption by rice husk ash at 288 and 318 K.
Table 2: Values of three different error analyses of isotherm models for adsorption of FD&C Red no 40 by chitosan.
T(K) SQEx109 SAEx104 ARE(%)
Langmuir 22.15 5.37 4.99
Freudlich 64.11 10.59 9.19
R-P 22.87 5.08 4.83
Temkin 26.83 6.98 5.33
298
D-R 40.79 8.48 7.18
Langmuir 13.24 4.80 4.72
Freudlich 185.19 10.86 7.60
R-P 16.02 4.43 4.44
Temkin 25.56 6.58 6.77
308
D-R 36.39 7.31 7.29
Langmuir 2.59 1.63 2.70
Freudlich 16.22 4.41 7.13
R-P 2.59 1.63 2.70
Temkin 1.51 1.29 1.62 318
D-R 11.00 3.59 5.76
Langmuir 3.38 1.99 4.47
Freudlich 2.84 1.87 3.14
R-P 3.51 2.00 4.40
Temkin 7.87 3.01 6.74 328
D-R 2.67 1.86 3.52
Langmuir 1.69 1.49 8.52
Freudlich 2.62 1.92 10.69
R-P 1.73 1.50 8.45
Temkin 0.98 1.08 5.68 338
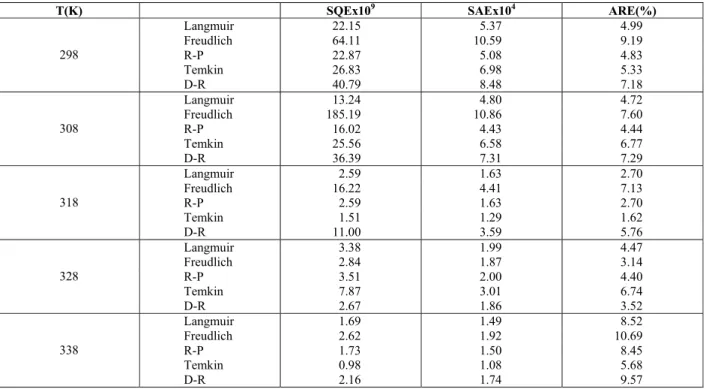
Figure 2 shows the fit of experimental data with the linearized form of the Langmuir isotherm model (Equation (2)).
Adsorption Thermodynamics
Figure 3 shows the van’t Hoff plot, from which
ΔH and ΔS values (Equation (13)) were obtained and are shown in Table 3.
The van't Hoff plot shown in Figure 3 was considered satisfactory due to the coefficient of correlation value, 0.96. Thermodynamic considerations dictate that the ΔG value is the fundamental criterion for determination of adsorption process characteristics. The observed negative ΔG values (-15.6 to 1.0 kJ mol-1) indicate that FD&C Red n° 40 adsorptions is a spontaneous and favorable process above 338 K. However, a more negative ΔG value indicates a higher
adsorption driving force and the increase of these values with the increase of temperature indicates a lower adsorption at higher temperatures. A similar effect was found by Uzun and Güzel (2004). Negative
ΔH values (-112.7 kJ mol-1) confirm the exothermic nature of the adsorption process. According to Crini and Badot (2008), adsorption enthalpy values in the range from -40 to -800 kJ mol-1 characterize chemical adsorption. The negative ΔS value (-0.338 kJ mol-1 K-1) indicates that randomness decreases at the solid– solution interface during the adsorption of FD&C Red
n° 40 by chitosan. The negative ΔH and ΔS values
suggest that enthalpy contributes more than entropy in producing negative ΔG values. Similar thermodynamic parameters were obtained for chitosan adsorption of Reactive Dye n° 141 (Sakkayawong et al., 2005), Reactive Red n° 189 (Chiou and Li, 2003) and Indigo Carmine (Anjos et al., 2002).
0 50 100 150 200 250 300 350 400 450 500
Ce (mol L -1
) x106 0,0
0,2 0,4 0,6 0,8 1,0 1,2 1,4 1,6 1,8 2,0 2,2
Ce
/q
e
(g
L
-1)
0 50 100 150 200 250 300 350 400 450 500 0.0
0.2 0.4 0.6 0.8 1.0 1.2 1.4 1.6 1.8 2.0 2.2
Ce /qe
(g
L
-1)
Ce(mol L-1) x106)
0 50 100 150 200 250 300 350 400 450 500
Ce (mol L -1
) x106 0,0
0,2 0,4 0,6 0,8 1,0 1,2 1,4 1,6 1,8 2,0 2,2
Ce
/q
e
(g
L
-1)
0 50 100 150 200 250 300 350 400 450 500 0 50 100 150 200 250 300 350 400 450 500 0.0
0.2 0.4 0.6 0.8 1.0 1.2 1.4 1.6 1.8 2.0 2.2
0.0 0.2 0.4 0.6 0.8 1.0 1.2 1.4 1.6 1.8 2.0 2.2
Ce /qe
(g
L
-1)
Ce(mol L-1) x106)
Figure 2: Linear plots of Langmuir isotherm model for removal of FD&C Red no 40 by chitosan: ■ T=298 K; ▲ T=308 K; ● T=318 K; ○ T=328 K;
□ T=338 K
0.0030 0.0030 0.0031 0.0032 0.0034 0.0035
1/ T (1/K) -4
-2 0 2 4 6 8 10
ln (
k
)
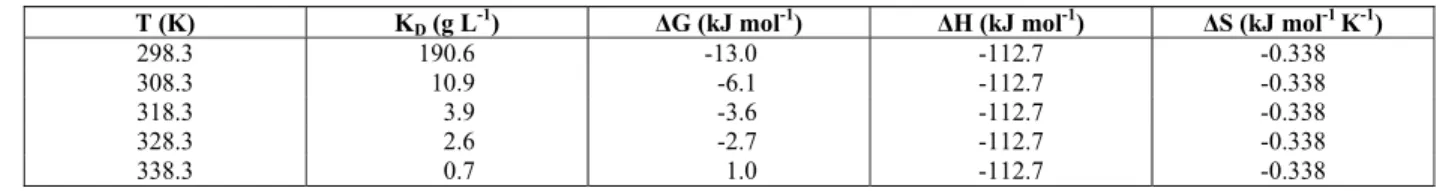
Table 3: Thermodynamic parameters of FD&C Red no 40 adsorption by chitosan.
T (K) KD (g L-1) ΔG (kJ mol-1) ΔH (kJ mol-1) ΔS (kJ mol-1 K-1)
298.3 190.6 -13.0 -112.7 -0.338
308.3 10.9 -6.1 -112.7 -0.338
318.3 3.9 -3.6 -112.7 -0.338
328.3 2.6 -2.7 -112.7 -0.338
338.3 0.7 1.0 -112.7 -0.338
CONCLUSION
In the present work, it was found that chitosan is an effective adsorbent for the removal of FD&C Red n° 40. The equilibrium adsorption isotherms were carried out by the batch method from 298 to 338 K. Maximum adsorption was observed at the temperature of 308 K,
corresponding to 1065.8 μmol g-1. Five isotherm
models were studied and the Langmuir model was the most appropriate for fit of the equilibrium experimental data (higher values of coefficients of determination and through error analysis). Thermodynamic parameters indicate that the adsorption process of FD&C Red n° 40 by chitosan is spontaneous, favorable, and exothermic in nature and that randomness decreases during the adsorption process.
ACKNOWLEDGEMENTS
The authors would like to thank CAPES (Brazilian Agency for Improvement of Graduate Personnel) and CNPq (National Council of Science and Technological Development) for financial support.
NOMENCLATURE
aR Redlich-Peterson constant in
Equation (4)
((g mol-1) (L mol-1)1/β)
b Temkin constant in
Equation (5)
g J mol-2
B D-R constant defined in
Equation (7)
mol2 kJ-2
Ce equilibrium concentration, mol L-1
E sorption free energy defined
in Equation (8)
kJ mol-1
Ci initial dye concentration mol L-1
ΔG Gibbs free energy change
defined in Equation (14)
kJ mol-1
ΔH adsorption enthalpy defined
in Equation (15)
kJ mol-1
KD thermodynamic equilibrium
constant defined in Equation (14)
L g-1
KF Freundlich constant defined
in Equation (3)
((mol g-1) (L mol-1)n )
KR Redlich-Peterson constant
defined in Equation (4)
L mol-1
KL Langmuir constant defined
in Equation (2)
L mol-1
KT equilibrium binding constant
defined in Equation (5)
L mol-1
m mass of the dry chitosan g
n sorption intensity defined in
Equation (3)
n number of data points
p number of parameter
qe adsorption capacity mg g-1
qe,calc calculated value mg g-1
qe,meas measured value mg g -1
qm maximum adsorption
capacity in the monolayer
mg g-1
qs D-R constant defined in
Equation (7)
mol g-1
R universal gas constant 8.314 J K−1
mol−1
ΔS adsorption entropy enthalpy
defined in Equation (15)
kJ mol-1 K-1
T temperature K
V volume of solution L
Greek Letters
β exponent in Equation (4),
which lies between 1 and 0
ε adsorption potential
REFERENCES
Anjos, F. S. C., Vieira, E. F. S. and Cestari, A. R., Interaction of Indigo Carmine dye with chitosan evaluated by adsorption and thermochemical data. Journal of Colloid and Interface Science, 253, 243-246 (2002).
Arami, M., Limaee, N. Y., Mahmoodi, N. M. and Tabrizi, N. S., Equilibrium and kinetics studies for the adsorption of direct and acid dyes from aqueous solution by soy meal hull. Journal of Hazardous Materials, 135, 171-176 (2006). Casal, E., Montilla, A., Moreno, F. J., Olano, A. and
Corzo, N., Use of chitosan for selective removal of ß-Lactoglobulin from whey. Journal Dairy Science, 89, 1384-1389 (2006).
Cerveira, M., Heinamaki, J., Rasanem, M., Yliruusi, J., Solid-state characterization of chitosans derived from lobster chitin. Carbohydrate Polymers, 58, 401-408 (2004).
Cestari, A. R., Vieira, E. F. S, A., Tavares, A. M. G., Bruns, R. E., The removal of the indigo carmine dye from aqueous solutions using cross-linked chitosan—Evaluation of adsorption thermodynamics using a full factorial design. Journal of Hazardous Materials, 153, 566-574 (2008).
Chatterjee, S., Lee, D. S., Lee, M. W., Woo, S. H., Congo red adsorption from aqueous solutions by using chitosan hydrogel beads impregnated with nonionic or anionic surfactant. Bioresource Technology, 100, 3862-3868 (2009).
Chatterjee, S., Chatterjee, S., Chatterjee, B. P. and Guha, A. K., Adsorptive removal of Congo Red, a carcinogenic textile dye by chitosan hydrobeads: Binding mechanism, equilibrium and kinetics. Colloids and Surfaces A: Physicochemical and Engineering Aspects, 299, 146-152 (2007).
Cheung, W. H., Szeto, Y. S., McKay, G., Enhancing the adsorption capacities of acid dyes by chitosan nano particles. Bioresource Technology, 100, 1143-1148 (2009).
Chiou, M. S. and Li, H. Y., Adsorption behavior of reactive dye in aqueous solution on chemical cross-linked chitosan beads. Chemosphere, 50, 1095-1105 (2003).
Crini, G. and Badot, P. M., Application of chitosan, a natural aminopolysaccharide, for dye removal from aqueous solutions by adsorption processes using batch studies: A review of recent literature. Progress in Polymer Science, 33, No. 4, 399-447 (2008).
Demiral, H., Demiral, I., Tümsek, F. and Karabacakoglu, B., Adsorption of chromium(VI) from aqueous solution by activated carbon derived from olive bagasse and applicability of different adsorption models. Chemical Engineering Journal, 144, 188-196 (2008).
Franco, L. O., Maia, R. C. C., Porto, A. L., Messias, A. S., Fukushima, K. and Takaxi, G.M.C., Heavy
metal biosorption by chitin and chitosan isolated
from Cunninghamella elegans. Brazilian Journal
of Microbiology, 35, 243-247 (2004).
Gamage, A. and Shahidi, F., Use of chitosan for the removal of metal ion contaminants and proteins from water. Food Chemistry, 104, No.3, 989-996 (2007).
Garg, V. K., Gupta, R., Yadav, A. B. and Kumar, R., Dye removal from aqueous solution by
adsorption on treated sawdust. Bioresource
Technology, 89, 121-124 (2003).
Hameed, B. H., Tan, I. A. W. and Ahmad, A. L., Adsorption isotherm, kinetic modeling and mechanism of 2,4,6-trichlorophenol on coconut husk-based activated carbon. Chemical Engineering Journal, 144, 235-244 (2008).
Jayakumar, V., Prabaharan, M. Nair, S. V., Tamura, H., Novel chitin and chitosan nanofibers in
biomedical applications. Biotechnology Advances,
28, 142-150 (2010).
Kadirvelu, K., Karthika, C., Vennilamani, N. and Pattabhi, S., Activated carbon from industrial solid waste as an adsorbent for the removal of Rhodamine-B from aqueous solution: kinetic and equilibrium studies. Chemosphere, 60, 1009-1017 (2005).
Kilislioglu, A. and Bilgin, B., Thermodynamic and kinetic investigations of uranium adsorption on amberlite IR-118H resin. Applied Radiation and Isotopes, 53, 155-160 (2003).
Konaganti, V. K., Kota, R., Patil, S., Madras, G., Adsorption of Anionic Dyes on Chitosan grafted Poly(alkyl methacrylate)s. Chemical Engineering Journal(2008), doi:10.1016/j.cej.2010.01.003. Lazaridis, N. K., Kyzas, G. Z., Vassiliou, A. A.,
Bikiaris, D. N., Chitosan derivatives as biosorbents for basic dyes. Langmuir, 14, 34-43 (2007).
Mane, V. S., Mall, I. D. and Srivastava, V. C., Kinetic and equilibrium isotherm studies for the adsorptive removal brilliant green dye from aqueous solution by rice husk ash. Journal of Environmental Management, 84, 390-400 (2007). Mittal, A., Kurup, L. and Mittal, J., Freundlich and
Langmuir adsorption isotherms and kinetics for the removal of Tartrazine from aqueous solutions using hen feathers. Journal Hazardous Materials, 146, 243-248 (2007).
Ngah, W. S. W., Kamari, A., Fatinathan, S. and Ng, P. W., Adsorption of chromium from aqueous solution using chitosan beads. Adsorption, 12, 249-257 (2006).
surface of styrene supported zirconium (IV) tungstophophate: a thermodynamic study. Colloids and Surfaces A: Physicochemical and Engineering Aspects, 164, 115-119 (2000). Roberts, G. A. F., and Domszy, J. G., Determination
of the viscosimetric constants for chitosan. International Journal of Biological Macromolecules, 4, 374-377 (1982).
Runping, H., Pan, H., Zhaohui, C., Zhenhui, Z. and Mingsheng, T., Kinetics and isotherms of Neutral Red adsorption on peanut husk. Journal Enviromental Science, 20, 1035-1041 (2008). Saha, T. K., Karmaker, S., Ichikawa, H., Fukumori, Y.,
Mechanisms and kinetics of trisodium 2-hydroxy-1, 1’-azonaphthalene-3,4’,6-trisulfonate adsorption onto chitosan. Journal of Colloid Interface Science, 286, 433-9 (2005).
Sakkayawong, N., Thiravetyan, P. and Nakbanpote, W., Adsorption mechanism of synthetic reactive dye wastewater by chitosan. Journal of Hazardous Materials, 145, No.1, 250-255 (2007).
Sakkayawong, N., Thiravetyan, P., Nakbanpote, W., Adsorption mechanism of synthetic reactive dye
wastewater by chitosan. Journal of Colloid
Interface Science, 286, 36-42 (2005).
Sun, Q. and Yang, L., The adsorption of basic dyes from aqueous solution on modified peat-resin particle. Water Research, 37, 1535-1544 (2003).
Ünlü, N. and Ersoz, M., Adsorption characteristics of heavy metal ions onto a low cost biopolymeric sorbent from aqueous solutions. Journal Hazardous Materials, 136, 272-280 (2006).
Uzun, I. and Güzel, F., Rate studies on the adsorption of some dyestuffes and p-nitrophenol by chitosan and monocarboxymethylate (mcm)-chitosan from aqueous solution. Journal of Hazardous Materials, B118, 141-154 (2005). Weska, R. F., Moura, J. M., Batista, L. M., Rizzi, J.
and Pinto L. A. A., Optimization of deacetylation in the production of chitosan from shrimp wastes: Use of response surface methodology. Journal of Food Engineering, 80, 749-753 (2007).
Wibowo, A., Velazquez, G., Savant, V. and Torres, J. A., Effect of chitosan type on proteins and water recovery efficiency from surimi wash water treated with chitosan-alginate complexes. Bioresource Technology, 98, 539-545 (2007). Wong, Y. C., Szeto, Y. S., Cheung, W. H. and McKay,
G., Adsorption of Acid dyes on chitosan – Equilibrium isotherm analyses. Process Biochemistry, 39, No. 6, 695-704 (2004).