ISSN 0104-6632 Printed in Brazil
www.abeq.org.br/bjche
Vol. 31, No. 04, pp. 1035 - 1045, October - December, 2014 dx.doi.org/10.1590/0104-6632.20140314s00002568
Brazilian Journal
of Chemical
Engineering
REMOVAL OF THE SYNTHETIC DYE REMAZOL
BRILLIANT BLUE R FROM TEXTILE INDUSTRY
WASTEWATERS BY BIOSORPTION ON THE
MACROPHYTE
Salvinia natans
B. T. Pelosi, L. K. S. Lima and M. G. A. Vieira
*School of Chemical Engineering, State University of Campinas, UNICAMP, Av. Albert Einstein 500, Cidade Universitária Zeferino Vaz, 13083-852, Campinas - SP, Brazil.
Phone: (55) (19) 3521 0358
E-mail: [email protected]; [email protected]
*
E-mail: [email protected]
(Submitted: February 27, 2013 ; Accepted: February 11, 2014)
Abstract - Batch experiments were carried out for biosorption of Remazol Brilliant Blue R dye onto the
macrophyte Salvinia natans. Effects of parameters such as initial dye concentration, pH, biosorbent dosage,
contact time and temperature were investigated. Chemical and morphological characteristics of the biosorbent were evaluated before and after the biosorption process using methods such as Optical Microscopy (OM), Scanning Electron Microscopy (SEM), Thermogravimetric Analysis (TA), Differential Scanning Calorimetry (DSC) and Infrared Spectroscopy (FT-IR). Sorption kinetics were conducted and followed a pseudo-second
order kinetic model. Equilibrium data were well represented by the Langmuir model. Salvinia natans
exhibited a maximum uptake of 61.9 mg.g-1. The Dubinin-Radushkevich model indicated that the adsorption
takes place by a physical process. Thermodynamic parameters were estimated. The negative values of the Gibbs energy indicated the spontaneous nature of the adsorption. The entropy was positive and the positive value of the enthalpy showed that the process is endothermic.
Keywords: Biosorption; Dye; Macrophyte; Salvinia natans.
INTRODUCTION
Textile industries are responsible for producing large amounts of highly contaminated effluents by various types of synthetic dyes, which are character-ized by being toxic and reactive. Textile effluents are ranked among the pollutants most harmful to the environment due to the high discharge volume and diversity in their composition, associated with the quantities of dye lost during the dying process (Al-Ghouti et al., 2009). The dyes have environmental risks, especially to human health, due to their
car-cinogenic and mutagenic properties (Guaratini and Zanoni, 2000). Color affects the nature of water and inhibits sunlight penetration, reducing photosynthetic activity (Sivaraj et al., 2001).
effluents containing synthetic textile dyes because of the chemical stability of these pollutants (Forgacs
et al., 2004). On the other hand, technologies such
as adsorption have great efficiency in the treatment of industrial wastewater, mainly due to the high potential in removing organic matter and associated low cost (Bangash and Alam, 2009; Ncibi et al., 2009).
Currently, one of the most widely used adsorbents is activated charcoal; however, its high cost is a disadvantage when used on a large scale (Schimmel
et al., 2010; McKay et al., 1987; Low et al., 1995).
Many studies have been developed in order to seek low-cost adsorbents such as peat, ash, wood chips, silica, and clays (Silva et al., 2010). The use of bio-materials as adsorbents for the treatment of waste-water is a potential alternative to conventional treat-ments (Vieira et al., 2014; 2012; Mafra et al., 2013; Pelosi et al., 2013; Piccin et al., 2011; Kumar et al.,
2005; Moreira et al., 2001). However, these low cost absorbers typically have low adsorption capacity (Srinivasan and Viraraghavan, 2010). Therefore, there is a huge demand for new materials such as aquatic plants, including macrophytes, which have adapta-tions that allow their growth in a vast region, from saturated soils to fully submerged in water. These kinds of plants are commonly associated with the purification capacity of water where they are pre-sent. They can act as biosorbents of conventional pollutants, heavy metals and organic compounds, and are persistent to pesticides (Iqbal and Saeed, 2007).
This paper proposes the use of the aquatic macro-phyte Salvinia natans as biosorbent for the removal of Reactive Blue 19 dye, which is widely used in textile industries. Characterization of biomaterial and knowledge of the mechanisms involved, through the identification of the functional groups, in the bio-sorption process of dyes were determined by the following methods: Infrared Spectroscopy (FT-IR), Thermal Analysis (TG and DSC), Scanning Electron Microscopy (SEM) and Optical Microscopy. Bio-sorption assays were carried out for adBio-sorption kinet-ics and equilibrium studies. The factors affecting the sorption process such as contact time, pH, initial dye concentration, biosorbent dosage and temperature were investigated. Langmuir, Freundlich and Dubinin-Radushkevich (D-R) models were adjusted to the experimental data. Kinetic models were evaluated in order to identify potential adsorption process mecha-nisms and to understand the possible physical-chemical interactions involved in adsorption phe-nomenon between the macrophyte surface and dye molecules.
MATERIALS AND METHODS
Preparation of Macrophyte and Dye Solutions
Salvinia natans biomass was collected by the
CPAA (Research Center in Environmental Aqua-culture) of the State University of Paraná – Brazil, crushed and sieved in to particles with average size of 0.75 mm for the adsorption tests.
Reactive Blue 19 dye (CI 61200, Remazol Bril-liant Blue R, MW: 626.54) was obtained from Sigma-Aldrich Co Ltd. The dye concentration values ranged from 20 to 300 mg.L-1. The control of solution Ph was done using HNO3 (0.5 mol.L
-1
), and NH4OH (0.1 mol.L-1). Dye concentrations in solution were measured using a UV-vis spectrophotometer (Shi-madzu, UVmini-1240) by monitoring the absorbance changes at the wavelength of 602 nm.
Methods
Characterization of Salvinia natans
A morphological study of biomass was performed using methods such as Optical Microscopy (DMLM, Germany and Scanning Electron Microscopy (SEM) with the aim of obtain the structure of the material from surface images (Sputter Coater, BAL/TEC, SCD 050). FT-IR spectroscopy was used to identify the functional groups present in the macrophyte surface and the occurrence of chemical changes in the biomass after the biosorption process. Also Thermogravimetric and Differential Scanning Calorimetry analyses were used and allowed ob-serving the behavior and thermal stability of materi-als before the adsorption step (Shimadzu, TGA-50).
Adsorption Kinetic Studies
Experiments were conducted in continuously stirred beakers containing 1500 ml of dye solution and 1.5 g of macrophyte with pH monitoring at room temperature. For the pH study the initial dye solu-tions (100 mg.L-1) were adjusted to pH 1.0, 2.0 and 3.0. The effect of initial concentration of dye was studied at pH 1.0. The values of concentration ana-lyzed were 50, 100, 200 and 300 mg.L-1. Samples were withdrawn at predetermined intervals of time and were centrifuged at 3500 rpm for 10 min and the supernatant was analyzed. The amount of biosorbed dye per unit of macrophyte was calculated from the following equation:
(
C0 Cf)
.Vq
m −
where q is the dye uptake (mg.g-1), C0 and Cf are the initial and equilibrium concentrations of the dye (mg.L-1), V is the volume of solution (L), and m is the mass of biosorbent (g).
Kinetic data were described by pseudo-first order (Lagergren, 1898), pseudo-second order (Ho and McKay, 1999) and intraparticle diffusion models (Weber and Morris, 1962). The model equations are represented as follows by Eq. (2), Eq. (3) and Eq. (4), respectively:
(
)
1
t
e t
dq
k q q
dt = − (2)
(
)
22
t
e t
dq
k q q
dt = − (3)
1/2
t in
q =k t +C (4)
where qe is the amount of dye retained in the solid surface at equilibrium (mg.g-1), qt is the amount of dye retained at time t (mg.g-1), k1 corresponds to the reaction rate constant of pseudo-first order (min-1), k2 is the rate constant of reaction of pseudo-second order (g.mg-1min-1), kin is the mass transfer coeffi-cient, which includes the effective diffusion, dimen-sions and physical characteristics of the particle (mg.g-1(min1/2)-1) and C is a constant that gives an idea of the boundary layer thickness.
Effect of Sorbent Loading
This study was conducted with 100 mL of RBBR solution (100 mg.L-1) at room temperature and pH 1.0 for different concentrations of macrophyte (0.1 to 5 mg.L-1). When the biosorption achieved the equi-librium, samples were centrifuged at 3500 rpm for 10 min and the supernatant was analyzed.
Adsorption Isotherms
Equilibrium experiments were carried out by contacting 1 g.L-1 of macrophyte with 100 mL of dye solution at different initial concentrations (20 to 300 mg.L-1). The samples were shaken (350 rpm) at four temperatures (15, 30, 40 and 50 °C). The dye con-centration in solution before and after adsorption was determined by using a UV-vis spectrophotometer. The equilibrium data were analyzed by Langmuir, Freundlich and Dubinin-Radushkevich (D-R) models. The Langmuir isotherm is represented by the fol-lowing equation:
0
1
e e
e
q bC q
bC =
+ (5)
where q0 represents the concentration of dye in the macrophyte for a total coverage of available sites (mg.g-1), b represents the Langmuir adsorption coef-ficient that represents the relationship between the rates of adsorption and desorption (L.mg-1) and Ce is the equilibrium concentration of dye in fluid phase (mg.L-1).
The essential characteristic of the Langmuir iso-therm model can be expressed by the dimensionless constant called the equilibrium parameter (RL), given by Eq. (6):
0
1 1
L
R
bC =
+ (6)
where C0 is the initial concentration (mg.L-1) and b is the Langmuir constant (L.mg-1).
The Freundlich model isotherm is used to de-scribe heterogeneous systems, and is given by:
1n e F e
q =K C (7)
where KF is the Freundlich constant and indicates the adsorption capacity of the adsorbent (mg.g-1) and 1/n is the heterogeneity factor.
The Dubinin-Radushkevich model can be expressed by the following equation:
2
lnqe=lnqm−KDRε (8)
where KDR is the porosity factor (mol2.J-2), qm is the monomolecular adsorption capacity of dye biosorp-tion by the biomass surface (mg.g-1) and the variable
ε can be related to the equilibrium concentration (Ce, g.L-1) as follows:
1 ln 1
e
RT
C
⎛ ⎞
ε = ⎜ + ⎟
⎝ ⎠ (9)
where ε is the Polonyi potential (J.mol-1), R is the universal gás constant (8.314×10⁻³ kJ.K-1mol-1) and
T is the absolute temperature.
A plot of ln qe versusε2 (J2.mol-2) yields a straight line, confirming the model. The mean free energy of adsorption E (kJ.mol-1) per molecule of the adsorbate when it is transferred from the solution to the bio-mass surface (Ergene et al., 2009) can be calculated using the following equation:
(
)
1 22 DR
Thermodynamic Parameters
The thermodynamic parameters for the adsorp-tion process, ΔH (kJ.mol-1), ΔS (J.K-1mol-1) and ΔG (kJ.mol-1), were evaluated using Eq. (11) and Eq. (12):
ln( d)
G RT K
Δ = − (11)
ln(Kd) G S H
RT R RT
Δ Δ Δ
= − = − (12)
where Kd is the adsorbate distribution coefficient (= qeq/Ceq in L.g-1).
The plot of ln(Kd) versus 1/T must be linear with slope (−ΔH/R) and intercept the y axis at (ΔS/R), providing the values for ΔH and ΔS. The variation in Gibbs free energy (ΔG) is the fundamental criterion of process spontaneity.
RESULTS AND DISCUSSION
Characterization of Salvinia natans
Surface Morphology
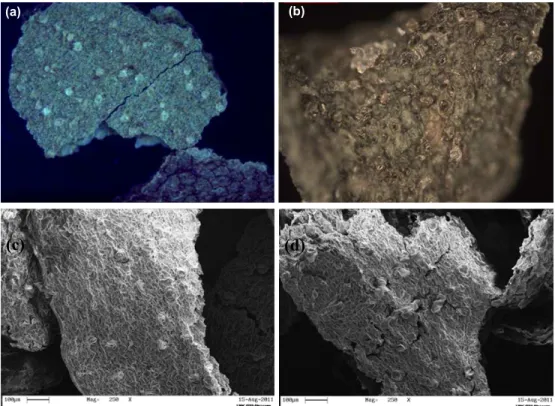
Figure 1 shows the micrographs obtained by OM and SEM analysis of macrophyte Salvinia natans
before and after the biosorption process. In Figure 1-(a) there is a noticeable presence of salt crystals on the biomass surface, which can be attributed to the natural deposition of minerals. After biosorption (Figure 1-(b), there was no change in the material surface. In Figure 1-(c),(d) it is possible observe the irregularity of the S. natans surface and the points assigned to crystalline salts. It can be seen that there was no significant structural changes in the macro-phyte surface after the biosorption process, since the roughness remained approximately the same, and also the crystal structures.
(c)
(c)
(d)
(d)
(a)
(a)
(a)
(b)
(b)
(b)
Functional Groups
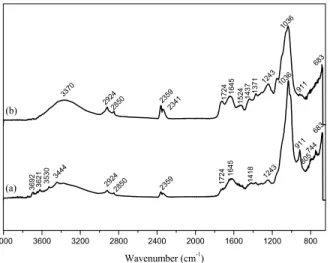
Figure 2 shows the infrared spectrum obtained for biomass "in natura" and after the biosorption process. Through analysis of the bands and peaks present, it was possible to determine the main chemical bonds present in the samples, and determine the most preva-lent organic functional groups. The bands at 2924-2850 cm-1 are the asymmetric and symmetric stretch of methylene (H-C-H), respectively, the 1724 cm-1 peak is stretching vibration of C=O. This peak was observed only in dye saturated biomass, as the 1524 cm-1 band, which is that of secondary amide. The 1243 cm-1 band is the C-O stretching of carboxylic acids, the 911 cm-1 peak is the angular deformation of alkenes present only in the“in natura” biomass. The 900 - 690 cm-1 peaks are due to aromatic compounds. The bands < 800 cm-1 are in the fingerprint zone, which is also the region of phosphate and sulphur functional groups (Saygideger et al., 2005). Some functional groups changed with biosorption. The FT-IR results showed that functional groups as carboxyl, alkenes and hydroxyl take part in dye binding.
4000 3600 3200 2800 2400 2000 1600 1200 800
(b) 36 21 36 92 35 30 805 683 744 911 1036
Wavenumber (cm-1)
1036 1243 13 71 14 37 3370 2924
2850 23 59
2341
17
24 1645
15 24 1243 14 18 3444 2924
2850 2359 17
24 16
45
683
911
(a)
Figure 2: Infrared spectrum of S. natans (a) "in natura" and (b) saturated with RBBR.
Thermal Analysis
Figure 3 shows the biomass thermogravimetric analysis (TA). The figure shows the plot of mass loss
versus temperature and divides it into three steps,
according to the main maxima and minima of the de-rivative curve. The occurrence of mass loss is mainly due to gases and vapor release, vaporization of liquids, dehydration, chemical decomposition and sublima-tion of solids (Chen and McKeever, 1997). The total mass loss of the macrophytes determined by TA was
72.94%. Table 1 shows the percentage of mass loss for each one of the three steps.
0 200 400 600 800 1000
0.0 0.5 1.0 1.5 2.0 2.5 3.0 3.5 4.0 3rd step 2nd step
Loss of mass Derivative of loss of mass Temperature (°C) Lo ss of ma ss ( m g ) 1st step -0.0020 -0.0015 -0.0010 -0.0005 0.0000 d Los s of m as s
Figure 3: Thermogravimetric Analysis (TA) of S.
natans.
Table 1: Loss of mass summary in different steps of TA. Step Temperature, °C Loss of mass, % Reason
1st 25 - 150 8.57 Loss of water, microorganisms and organic matter 2nd 150 - 325 24.52 Loss of hydroxyl 3rd 325 - 700 60.79 Decarbonation
In Figure 4 is shown the Differential Scanning Calo-rimetry (DSC) curve of Salvinia natans biomass. It was observed that the macrophyte had two major endo-thermic events at temperatures of 50 °C and 160 °C. The first event is associated with the energy used to remove the biomass water of hydration molecules. The second event probably corresponds to the fusion energy of the macrophyte S. natans.
0 100 200 300 400 500
-0.25 0.00 0.25 0.50 0.75 1.00 1.25 1.50 1.75 2.00 2.25 He at f low ( m W)
Temperature (°C)
Effect of pH
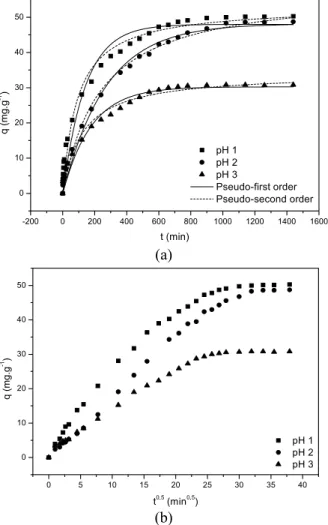
The pH value of the solution exerts a profound in-fluence on the adsorption process due to the impact that it causes on both surface binding-sites of the biosorbent and the ionization process of the dye mole-cules. In the present work, the effect of pH was studied for values between 1 and 3, as shown in Figure 5. It was observed that the equilibrium sorption capacity de-creased with increasing pH from 1 to 3. The increase in biosorption of RBBR dye with decrease in solution pH was observed for other biomass (Aksu and Donmez, 2003; Aksu and Tezer, 2005; Iqbal and Saeed, 2007). The maximum amount of RBBR (50.2 mg.g-1) was adsorbed at pH 1.0. This result can be explained by electrostatic forces. At lower pH, the surface of the macrophyte gets positively charged, which enhances the interaction of negatively charged dye anions with the surface of the macrophyte through the electro-static forces of attraction (Won et al., 2005).
-200 0 200 400 600 800 1000 1200 1400 1600
0 10 20 30 40 50
q (mg
.g
-1)
t (min) pH 1 pH 2 pH 3
Pseudo-first order Pseudo-second order
(a)
0 5 10 15 20 25 30 35 40
0 10 20 30 40 50
q (
m
g.
g
-1 )
t0,5
(min0,5
)
pH 1 pH 2 pH 3
(b)
Figure 5: Pseudo-first and second-order (a) and intraparticle diffusion (b) kinetic model fits for the pH effect on dye biosorption.
Table 2: The pseudo first-order, pseudo second-order and intraparticle diffusion kinetic constants obtained from the pH effect.
Pseudo 1st order Pseudo 2nd order
pH q1
(mg.g-1)
k1
(L.mg-1)
R2 q
2
(mg.g-1)
k2
(L.mg-1)
R2
1 47.97 0.007 0.958 53.18 0.011 0.981 2 48.15 0.004 0.988 58.07 0.002 0.993 3 30.23 0.006 0.962 34.13 0.008 0.976
Intraparticle diffusion
pH kin
(mg.g-1.min-1/2)
C
(mg.g-1) R
2
1 1.25 1.52 0.993
2 1.78 --- 0.996
3 2.21 2.37 0.992
The correlation coefficients for the first order ki-netic model were determined and compared with those of the second order kinetic model. Considering the study of the pH effect, the results presented in Table 2 show that the pseudo-second order model best fits the kinetic data. The plot of q versus t0,5 (Figure 5-(b)) gives a straight line that does not pass through the origin, showing that biosorption of RBBR by the macrophyte Salvinia natans is not an exclu-sivity of the intraparticle diffusion model. The Kin values were calculated by using correlation analysis (Table 2). The values of the intercept q give an idea about the boundary layer thickness; the larger the intercept, the greater the boundary layer effect will be (Kannan and Sudram, 2001). Similar results were found by Ergene et al. (2009) for biosorption of RBBR with heat-inactivated Scenedesmus
quadri-cauda. The authors obtained a maximum capacity of
47.9 mg.g-1 at 30 °C and pH 2.0 (Ergene et al., 2009). The maximum RBBR biosorption capacity of Salvinia
natans at equilibrium observed during the present
study was also higher than values obtained in the literature. Polman and Breckenridge (1996) used the fungi biomass of Botrytis cinerea for removing dye and achieved maximum removal capacity of 42 mg.g-1. Effect of Initial Dye Concentration and Contact Time
model also fits the experimental data better for all concentrations.
-200 0 200 400 600 800 1000 1200 1400 1600
0 10 20 30 40 50 60 70 q (mg .g -1 ) t (min) 50 ppm 100 ppm 200 ppm 300 ppm Pseudo-first order Pseudo-second order (a)
0 5 10 15 20 25 30 35 40
0 10 20 30 40 50 60 70 q ( m g.g -1 )
t0,5 (min0,5)
50 ppm 100 ppm 200 ppm 300 ppm
(b)
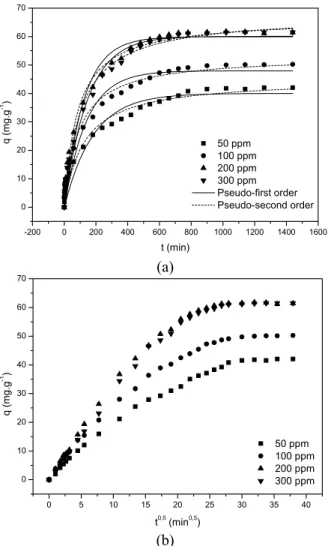
Figure 6: Study of biosorption variation with initial RBBR concentration. Pseudo-first and second order (a) and intraparticle diffusion (b).
Table 3: The pseudo first-order, pseudo second-order and intraparticle diffusion kinetic constants obtained from the RBBR concentration effect.
Dye Pseudo 1st order Pseudo 2nd order
concentration (ppm)
q1
(mg.g-1)
k1
(L.mg-1)
R2 q
2
(mg.g-1)
k2
(L.mg-1)
R2
50 40.01 0.006 0.956 45.10 0.008 0.978 100 47.96 0.007 0.958 53.19 0.011 0.981 200 59.95 0.008 0.975 66.37 0.012 0.990 300 60.10 0.007 0.982 67.54 0.010 0.992
Dye Intraparticle diffusion
concentration (ppm)
kin
(mg.g-1.min-1/2)
C
(mg.g-1)
R2
50 1.72 1.57 0.989
100 2.21 2.37 0.992
200 2.91 0.52 0.997
300 2.97 1.65 0.994
The values of q were found to be linearly corre-lated with values of t0,5. Besides the linearity, intrapar-ticle diffusion is not the main mechanism, meaning that others complex processes are taking place si-multaneously. The equilibrium time necessary for adsorption was found to be 800 min for all initial dye concentrations, indicating that slow adsorption oc-curred and that the equilibrium reaching time is not dependent on initial dye concentration. Furthermore, the amount of RBBR adsorbed in 200 and 300 mg.L-1 concentrations was approximately the same, indicat-ing that this is the limit at which higher concentra-tions of dye does not mean a higher capacity for adsorption by the macrophytes.
Effect of Sorbent Loading
The effect of biosorbent quantity on the removal of Remazol Brilliant Blue was investigated at 100 mg.L-1 dye concentration. A range of concentrations from 0.1 to 5 g.L-1 of Salvinia natans were mixed in the RBBR solution. From Figure 7 it is observed that the removal efficiency increased from 6.6 to 92% with an increase in the biosorbent loading from 0.1 to 5 g.L-1. This can be mostly attributed to an increase in the adsorptive surface area and the availability of more active adsorption sites. Furthermore, at higher bio-sorbent dosage, there is a very fast adsorption onto the biosorbent surface. However, with an increase in the biosorbent loading from 0.1 to 5 g.L-1 the quantity of dye adsorbed per unit weight of macrophyte was reduced from 64.9 to 19.1 mg.g-1. A decrease in the qe value with increasing biomass loading may be due to complex interactions of several factors such as avail-ability of solute, interference between binding sites and electrostatic interactions (Aravindhan et al.,
2007). At higher biosorbent dosages, the available RBBR molecules are insufficient to cover all the ex-changeable sites on the biosorbent, usually resulting in low dye uptake.
0 1 2 3 4 5
0 10 20 30 40 50 60 70
Uptake capacity of macrophyte Removal percentage
Adsorbent dosage (g.L-1)
U p tak e of d y e o n to mac rop hyte (mg .g -1) 0 20 40 60 80 100 Re m o v a l ( % )
Equilibrium Adsorption Studies
The adsorption equilibrium is reached when the amount of solute being adsorbed onto the adsorbent surface is equal to the amount being desorbed. When this occurs, the equilibrium solution concentration remains constant. Plotting solid phase concentration
versus liquid phase concentration, it is possible to
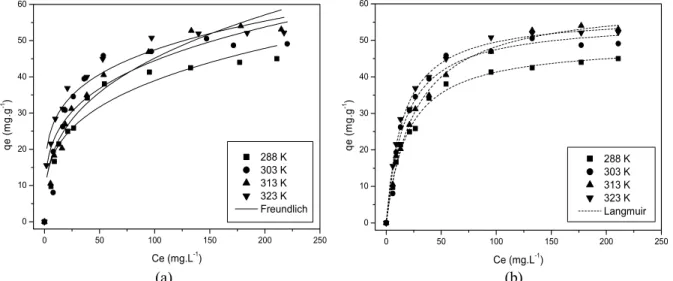
depict the equilibrium adsorption isotherm. Equi-librium data were analyzed using the Langmuir, Freundlich and Dubinin-Radushkevich equations. Figure 8 shows the Langmuir and Freundlich iso-therms at four different temperatures. It is possible to see that the maximum adsorbed capacity is observed to increase as the process temperature rises, i.e., an increase in energy favors the adsorption on the macrophyte surface. This behavior indicates that this is an endothermic process.
The Langmuir isotherm theory is specific for monolayer adsorption, in which the biosorbent sur-face consists of sites equally available for adsorption and with equal energies of adsorption. According to the RL parameter, Table 4, the isotherm can be
con-sidered favorable (0<RL<1) for dye biosorption. The Freundlich model is better applied to adsorption at heterogeneous sites on the biomass, with a non-es-tablished mechanism. Table 4 shows that the Langmuir isotherm model best fits the experimental data, indi-cating that the dye adsorption on the surface of the macrophyte takes place as a monolayer, i.e., the sur-face consists of identical sites, equally available for adsorption and with equal energies of adsorption (Aravindhan et al., 2007). However, as seen from the R2 values, the Freundlich isotherm also fitted the experimental sorption data, and the 1/n Freundlich constant values indicate that RBBR ions has high affinity for the biomass, because in all cases, 1/n < 1, indicating favorable adsorption. The Dubinin-Radushkevich model determines if the adsorption occurred by a physical or chemical process. It is known that when the E value lies between 8 and 16 kJ.mol-1, the adsorption process takes place by chemical ion exchange, while E < 8 kJ.mol-1 means that the adsorption process is physical (Argun et al.,
2007).. As shown in Table 4, the E value for all tem-peratures is less than 8 kJ.mol-1, meaning that the adsorption of dye on the macrophyte surface is a physical process.
0 50 100 150 200 250
0 10 20 30 40 50 60
288 K 303 K 313 K 323 K Freundlich
qe
(
m
g.
g
-1)
Ce (mg.L-1)
0 50 100 150 200 250
0 10 20 30 40 50 60
288 K 303 K 313 K 323 K Langmuir
qe
(
m
g.
g
-1)
Ce (mg.L-1)
(a) (b) Figure 8: Langmuir (a) and Freundlich (b) isotherms for the adsorption at different temperatures.
Table 4: Langmuir, Freundlich and D-R isotherm model parameters.
Langmuir Freundlich Dubinin-Radushkevich
Temp.
(K) qe
(mg.g-1)
b
(L.mg-1)
R2 RL KF 1/n R2 qm
(mg.g-1)
KDR
(10-5 mol2.J-2)
E
(kJ.mol-1)
Thermodynamic Parameters
The thermodynamic parameters such as change in standard free energy (ΔG°), enthalpy (ΔH°) and en-tropy (ΔS°) of adsorption were determined and the results are given in Table 5. The ΔG° values creased in absolute value when the temperature in-creased, showing that the adsorption was more spontaneous at higher temperatures. The negative values of ΔG° indicate the degree of spontaneity of the adsorption process. The positive ΔH° value (32.0059 kJ.mol-1) characterizes an endothermic process and may be due to the removal of water molecules from the dye solution. This dehydration process requires energy and this process could super-sede the energy released by the ions to attach to the surface of the biosorbent; this explains the endo-thermic behavior (Shah et al., 2009). The positive value of the change in entropy (ΔS°) reflects the increased randomness at the solid/solution interface during the adsorption of RBBR on the macrophyte surface.
Table 5: Thermodynamic parameters.
ΔG° (kJ.mol-1)
ΔH°
(kJ.mol-1)
ΔS°
(kJ.mol-1) 15 °C
(288 K) 30 °C (303 K)
40 °C (313 K)
50 °C (323 K)
32.00 0.18 -20.24 -22.96 -24.78 -26.59
CONCLUSION
The present work shows that the macrophyte
Salvinia natans is an effective biosorbent for the
removal of Remazol Brilliant Blue R from aqueous solutions. The amount of dye adsorbed varied with initial solution pH, dye concentration, biomass dos-age, time of contact and temperature. With an in-crease in temperature, the amount of dye uptake increased, indicating that biosorption of RBBR onto
Salvinia natans is an endothermic process.
Further-more, the biosorption process achieved better results under acid conditions due to electrostatic forces. At 40 °C, and pH 1.0, Salvinia natans exhibited a maximum uptake of 60.86 mg of RBBR per gram of macrophyte. The sorption data were found to follow pseudo-second order kinetics and equilibrium data fitted well to the Langmuir isotherm equation, en-suring a homogeneous biosorption process. The Dubinin-Radushkevich E value confirmed that the sorption takes place by a physical process. Thermo-dynamic parameters showed the spontaneity of the process and its endothermic character. The results
indicated that Salvinia natans is a promising low-cost technology bioadsorbent for the removal of waste dyes.
NOMENCLATURE
b Langmuir constant L/g
C0 initial concentration of dye in the fluid phase
E sorption energy J/mol
Kf and n Freundlich coefficients
m mass of adsorbent g
qeq concentration of dye in the solid fase
mg/g
qm maximum adsorbed capacity mg/g q (t) concentration of dye in the solid
phase
mg/g
R ideal gas constant T temperature V volume solution
Greek Letters
β Dubinin-Raduscshkevich constant
ε Polanyi potential
ACKNOWLEDGEMENTS
The authors acknowledge the financial support received from CNPq and Foundation for Research Support of São Paulo State, FAPESP, for this research.
REFERENCES
Aksu, Z. and Donmez, G., A comparative study on the biosorption characteristics of some yeasts for Remazol Blue reactive dye. Chemosphere, 50, 1075 (2003).
Aksu, Z. and Tezer, S., Biosorption of reactive dyes on the green alga Chlorella vulgaris. Process Biochem., 40, 1347 (2005).
Al-Ghouti, M., Al-Degs, Y., Khraisheh, M. A. M. and Allen, S., Mechanisms and chemistry of dye adsorption on manganese oxides-modified diato-mite. J. Environ. Manage, 90, 3527 (2009). Araujo, F. V. F., Yokoyama, L., Teixeira, L. A. C.,
Campos, J. C., Heterogeneous fenton process us-ing the mineral hematite for the discolouration of a reactive dye solution. Braz. J. Chem. Eng., 28(4), 605-616 (2011).
sorption on green alga Caulerpa scalpelliformis. J. Hazard. Mater., 142, 68 (2007).
Argun, M. E., Dursun, S., Ozdemir, C. and Karatas, M., Heavy metal adsorption by modified oak saw-dust: Thermodynamics and kinetics. J. Hazard. Mater., 141, 77 (2007).
Bangash, F. K. and Alam, S., Adsorption of acid blue 1 on activated carbon produced from the wood of
Ailanthus altissima. Braz. J. Chem. Eng., 26(2), 275
(2009).
Cerqueira, A., Russo, C. and Marques, M. R. C., Electroflocculation for textile wastewater treat-ment. Braz. J. Chem. Eng., 26(4), 659-668 (2009). Chen, R. and McKeever, S. W. S., Theory of Ther-moluminescence and Related Phenomena. World Sci. Publishers, Singapore (1997).
Ergene, A., Ada, K., Tan, S. and Katırcıoglu, H., Removal of Remazol Brilliant Blue R dye from aqueous solutions by adsorption onto immobi-lized Scenedesmus quadricauda: Equilibrium and kinetic modeling studies. Desalination, 249, 1308 (2009).
Forgacs, E., Cserháti, T. and Oros, G., Removal of syntetic dyes from wastewaters: Review. Environ. Inter., 30, 953 (2004).
Guaratini, C. C. I. and Zanoni, M. V. B., Corantes têxteis. Revista Quimi. Nova, 23, 71 (2000). (In Portuguese).
Ho, Y. S. and McKay, G., Pseudo-second order model for sorption processes. Process Biochem., 34 451 (1999).
Iqbal, M. and Saeed, A., Biosorption of reactive dye by loofa sponge-immobilized fungal biomass of
Phanerochaete chrysosporium. Process Biochem.,
42, 1160 (2007).
Kannan, K. and Sundram, M. M., Kinetics and mechanism of removal of methylene blue by adsorption on various carbons - a comparative study. Dyes Pigm., 51, 25-40 (2001).
Kumar, K. V., Sivanesan, S. and Ramamurthi, V., Adsorption of malachite green onto Pithophora sp., a fresh water algae: Equilibrium and kinetic model-ing. Process Biochem., 40, 2865 (2005).
Lagergren, S., About the theory of so-called adsorp-tion of soluble substances. Kungliga Svenska Vetenskapsakademiens, Handlingar, 24(4), 1-39 (1898).
Low, K. S., Lee, C. K. and Tan, K. K., Biosorption of basic dyes by water hyacinth roots. Bioresour. Technol., 52, 79 (1995).
Mafra, M. R., Igarashi-Mafra, L., Zuim, D. R., Vasques, É. C., Ferreira, M. A., Adsorption of re-mazol brilliant blue on an orange peel adsorbent. Braz. J. Chem. Eng., 30(3), 657-665 (2013).
McKay, G., El Geundi, M. and Nassar, M. M., Equi-librium studies during the removal of dyestuffs from aqueous solutions using Bagasse Pith. Water Res., 21, 1513 (1987).
Moreira, R. F. P. M., Soares, J. L., José, H. J., and Rodrigues, A. E., The removal of reactive dyes using high-ash char. Braz. J. Chem. Eng., 18(3), 327-336 (2001).
Ncibi, M. C., Ben Hamissa, A. M., Fathallah, A., Kortas, M. H., Baklouti, T., Mahjoub, B. and Seffen, M., Biosorptive uptake of methylene blue using Mediterranean green alga Enteromorpha spp. J. Hazard. Mater., 170, 1050 (2009).
Pelosi, B. T., Lima, L. K. S., Vieira, M. G. A., Acid orange 7 dye biosorption by Salvinia natans bio-mass. Chemical Engineering Transactions, 32, 1051-1056 (2013).
Piccin, J. S., Dotto, G. L. and Pinto, L. A. A., Ad-sorption isotherms and thermochemical data of FD&C Red n° 40 binding by Chitosan. Braz. J. Chem. Eng., 28(2), 295-304 (2011).
Polman, J. K. and Breckenridge, C. R., Biomass-mediated binding and recovery of textile dyes from waste effluents. Text. Chem. Color., 28, 31-35 (1996).
Saygideger, S., Gulnaz, O., Istifli, E. S. and Yucel, N., Adsorption of Cd(II), Cu(II) and Ni(II) ions
by Lemna minor L.: Effect of physicochemical
environment. J. Hazard. Mater., 126, 96 (2005). Schimmel, D., Fagnani, K. C., Oliveira dos Santos, J.
B., Barros, M. A. S. D., da Silva, E. A., Adsorp-tion of turquoise blue QG reactive bye commer-cial activated carbon in batch reactor: Kinetic and equilibrium studies. Braz. J. Chem. Eng., 27(2), 289-298 (2010).
Shah, B. A., Shah, A. V. and Singh, R. R., Sorption isotherms and kinetics of chromium uptake from wastewaters using natural sorbent material. Int. J. Environ. Sci. Technol., 6, 77 (2009).
Silva, G. L., Silva, V. L., Vieira, M. G. A., Silva, M. G. C., Solophenyl navy blue dye removal from smectite clay in porous bed column. Adsorption Science & Technology, 27, 861-875 (2010). Sivaraj, R., Namasivayam, C. and Kadirvelu, K.,
Orange peel as an adsorbent in the removal of acid violet 17 (acid dye) from aqueous solutions. Waste Manage., 21, 105 (2001).
Souza, M. C. P, Lenzi G. G., Colpini L. M. S., Jorge L. M. M., Santos O. A. A., Photocatalytic discol-oration of reactive blue 5g dye in the presence of mixed oxides and with the addition of iron and silver. Braz. J. Chem. Eng., 28(3), 393-402 (2011). Srinivasan, A. and Viraraghavan, T., Decolorization
Environ. Manage., 91, 1915 (2010).
Vieira, M. G. A., Almeida Neto, A. F., Carlos da Silva, M. G., Nóbrega, C. C. and Melo Filho, A. A., Characterization and use of in natura and cal-cined rice husks for biosorption of heavy metals ions from Aqueous effluents. Braz. J. Chem. Eng., 29, No. 03, 619-634 (2012).
Vieira, M. G. A., Almeida Neto, A. F., Silva, M. G. C., Carneiro, C. N., Melo Filho, A. A., Adsorp-tion of lead and copper ions from aqueous effluents on rice husk ash in dynamic system.
Braz. J. Chem. Eng., 31(2) (2014).
Weber, W. J. and Morris, J. C., Advances in Water Pollution Research: Removal of Biologically Re-sistant Pollutants from Waste Waters by Adsorp-tion, In: Proceedings of International Conference on Water Pollution Symposium. Pergamon Press, Oxford, 2, 231 (1962).
Won, S. W., Choi, S .B. and Yun, Y. S., Interaction be-tween protonated waste biomass of
Corynebacte-rium glutamicum and anionic dye reactive Red 4.