0103 - 5053 $6.00+0.00
Article
*e-mail: [email protected]
A Physico-Chemical Study of the Cationic Surfactants Adsorption on Montmorillonite
Petr Praus* and Martina Turicová
Department of Analytical Chemistry and Material Testing, VSB-Technical University Ostrava, 17. listopadu 15, 708 33 Ostrava, Czech Republic
O objetivo deste trabalho é o estudo da adsorção de brometo de cetiltilmetilamônio (CTA) e de cloreto de cetilpiridínio (CP) em argilas do tipo montorilonita (MMT) ricas em sódio. Um método isotacoforético (ITP) específico foi desenvolvido visando à determinação rápida e simultânea dos surfatantes catiônicos (CS) adsorvidos. A fim de reduzir os limites de detecção, o método isotacoforético foi conjugado com a técnica de eletroforese capilar. Para determinar o arranjo dos surfatantes catiônicos (CS) adsorvidos na superfície das argilas foi efetuada a avaliação do balanço molar entre os surfatantes e os cátions metálicos juntamente com as isotermas de adsorção. A maior adsorção do CP comparada a do CTA pode ser entendida não só pela ação das forças eletrostáticas, mas também por outras interações, tais como, interação hidrofóbica cauda-cauda e/ou interações entre anéis piridínicos formando bicamadas incompletas e/ou monocamadas condensadas, respectivamente.
The adsorption of cetyltrimethylammonium (CTA) bromide and cetylpyridinium (CP) chloride on Na+-rich montmorillonite (MMT) was studied. An ad hoc isotachophoretic (ITP) method was developed for the simultaneous and rapid determination of the cationic surfactants (CSs) adsorbed. In order to decrease the detection limits, ITP was on-line coupled with capillary zone electrophoresis. Adsorption data were analysed by their fitting with adsorption isotherms. The adsorption of CP is well described by the Langmuir isotherm. It indicates the monolayer arrangement of CP on the MMT surface. In case of the CTA data, the best fitting Langmuir-Freundlich model with the power constant r<1 was found. It can be explained by the CTA interactions because of its intercalation into the MMT interlayer space.
Keywords: adsorption isotherms, montmorillonite, cetyltrimethylammonium,
cetylpyridinium, capillary isotachophoresis
Introduction
Phyllosilicates are layered silicates in which the SiO4
tetrahedra are linked together in infinite two-dimensional
sheets and are condensed with layers of AlO6 or MgO
octahedra in the ratio 2:1 or 1:1. The negatively charged
layers attract positive cations (e.g. Na+, K+, Ca2+, Mg2+)
which can hold the layers together. Their large cation exchange capacities enable them to adsorb heavy metals
and also to be modified with quaternary salts1 including
cationic surfactants.2 One of the exceptional properties of
such prepared organo-phyllosilicates is their ability to sorb hydrophobic organic contaminants, such as chlorinated
phenols,3,4 perchlorethylene, naphtalene and
phenanthrene,5-7 aniline,8phenol9 etc. The retention of
inorganic oxyanions, such as chromate, nitrate, and
arsenate, on organo-kaolinite10 and organo-clinoptilolite11
has been studied recently, as well.
The usual methods for the determination of cationic
surfactants are ion-association titration,12 extraction
spectrometry,13high performance liquid chromatography
with reversed14,15 and ion-pair normal phase,16 and also
capillary zone electrophoresis (CZE).17-24 The application
of capillary isotachophoresis for the separation of C8-C20 cationic surfactants has been already reported by Tribet
et al.25,26 and Praus.27
The aim of this work was to study the CSs adsorption on montmorillonite. Cetyltrimethylammonium bromide and cetylpyridinium chloride, chosen as the typical cationic surfactants, were determined by an ITP method developed for this purpose. The prepared montmorillonite samples modified with the CSs will be used as sorbents for the retention of toxic compounds
Experimental
Reagents
The used chemicals were of the analytical reagent grade: ammonium acetate, lithium nitrate, glacial acetic acid, ethanol 96% (all from Lachema, Czech Republic),
β-alanine (Serva, Germany), cetyltrimethylammonium
bromide and cetylpyridinium chloride (Sigma, USA). Twice distilled and deionised water by a mixed-bed ion-exchanger (Watrex, Czech Republic) was used for the preparation of all solutions. The certified reference
materials of metal ions in the concentrations of 1 g L-1
were purchased from Analytica (Czech Republic).
Apparatus
An isotachophoretic analyzer EA 102 (Villa-Labeco, Slovakia) in the column-coupling configuration was employed. The capillaries were made from a fluorinated ethylene-propylene copolymer (FEP): a pre-separation
capillary 90 × 0.8 mm I.D. and an analytical capillary 200
× 0.3 mm I.D. Both capillaries were equipped with contact
conductivity detectors and, in addition, analytical capillary was equipped with an UV detector. The driving current in
the pre-separation capillary was set at 200 µA and reduced
at 100 µA prior to detection. In the analytical capillary the
driving current was kept at 25 µA in all experiments.
Samples were injected through a 30 µL sampling loop.
The pH values of the operational systems were measured with a pH metre WTW InoLab (Weilheim, Germany). An UV-Vis spectrometer Lambda 25 (Perkin Elmer, USA) was used for the determination of CP.
Intercalation of montmorillonite with CTA and CP
A Na+-rich Montmorillonite type Wyoming
(Al2.90Mg0.59Fe3+
0.49Ti0.01)3.99(Si7.92Al0.08)8.0O20(OH)4 with
exchanged capacity of 0.9 mequiv. g-1 was used for the
adsorption of CTA and CP. These cationic surfactants were dissolved in a 50:50 (v/v) mixture of water and ethanol, MMT was added and this suspension was shaken vigorously for 2 hours. The suspension was centrifuged for 20 minutes and the supernatant was analysed. The adsorption experiments
were performed at the laboratory temperature of 22 ± 2 oC.
Analysis of equilibrium data
Adsorption data were fitted using several adsorption isotherms describing the monolayer adsorption: Langmuir, Freundlich, and Langmuir-Freundlich (Sips). Non-linear
regressions were performed by the Gauss-Newton method. The best fitting model was chosen according the statistical regression criteria: regression coefficient (R), Akaike information criterion (AIC) and mean error of prediction (MEP).
Langmuir isotherm
The Langmuir isotherm was theoretically derived supposing that the adsorption takes place on fixed homogenous absorption sites of equal energy forming a monolayer surface coverage, with no interactions between molecules adsorbed. The Langmuir model can be described by the equation
(1)
where a (mmol g-1) and c
e (mmol L-1) are the equilibrium
concentration of adsorbate on a adsorbent surface and the adsorbate concentration in solution, respectively. The constant k is the equilibrium constant which represents
the affinity between adsorbate and adsorbent and am is
the maximum amount adsorbed on surface.
Freundlich isotherm
The Freudlich isotherm is strictly the empirical model. The adsorbent concentration is a power function of the adsorbate concentration as follows:
(2)
where K and p are the Freundlich and the power constant, respectively. In spite of the Langmuir model it does not show a saturation of adsorbent surface. The sorbed amount increases indefinitely with the concentration in solution.
It was found by Halsey29 that the Freundlich isotherms
holds for the heterogenous surface when adsorption energy
is reciprocal to logΘ, where Θ is a/am (a degree of surface
coverage).
Langmuir-Freundlich (Sips) isotherm
The Langmuir-Freundlich isotherm is simple
generalization of both isotherms. It was derived by Sips30
in 1950 who considered adsorption energy ranging from
0 to ∞. It holds for this isotherm:
r e
r e m
) kc ( 1
) kc ( a a
+
where the symbols are the same as in the Langmuir isotherm and r is the power constant. As this equation has three fitting constants it much better describes the adsorption including adsorption binding interactions
among adsorbing compounds.31 For independent
non-interacting adsorption sites corresponding to the Langmuir model, the value r is 1. When r>1, positive cooperativity is assumed, while when 0<r<1 negative adsorption cooperativity can be expected.
Data processing
Isotachopherograms and electropherograms were recorded and evaluated by using the programme ITPPro32 (KasComp, Ltd., Slovakia). The non-linear regression and
all statistical calculations made at the α= 0.05 significance
level were performed by the program QC.Expert 2.5 (Trilobyte Statistical Software, Czech Republic).
Results and Discussion
ITP method development
Composition of the ITP electrolytes (Table 1) was
adopted from the previous work.27 Ethanol (EtOH) has
been found to avoid the CTA micellization in its
concentrations up to 2 mmol L-1 caused by the ITP
concentration effect. The initial series of ITP experiments were performed in leading (LE) and terminating (TE) electrolytes containing 40% (v/v) of EtOH. No CTA and CP micelles were recorded but this amount of EtOH did not prevent the surfactant adsorption on capillary surface which was indicated by the low repeatability of ITP measurements. Therefore, the EtOH content was increased at cca 50% and under these conditions no adsorption of both surfactants was observed.
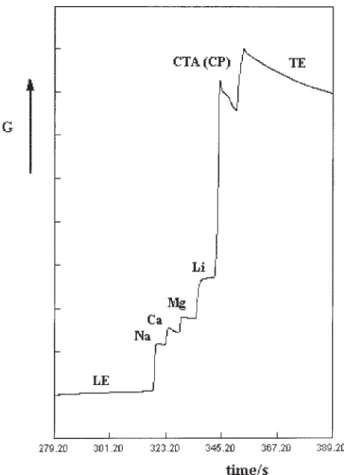
This leading electrolyte enables the separation of not only CTA or CP but also of the metal cations, such as
Na+, Ca2+, Mg2+ and Li+ (Figure 1). Lithium was used as
an internal standard. Ethanol acts as a suitable medium for the separation of these metals without using any
complex forming additives.32 The only exception is K+
which makes a mixed zone with NH4+. It could be
theoretically determined from the leading zone prolongation but, unfortunately, precision of this procedure was poor. From Figure 1 it also follows that the CTA and CP mobilities are very close. Because of the thermal zone distortion resulting from the reduced
ion mobilities in ethanolic electrolytes,33 the driving
current was reduced at 100 µA prior to detection. Thus,
one ITP run takes about 5.5-7 minutes.
ITP method validation
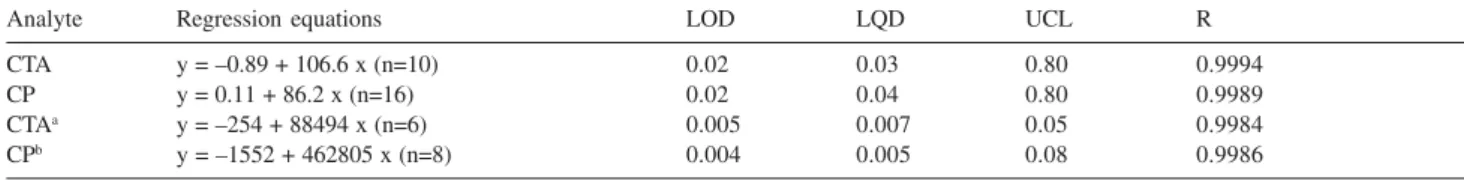
The ITP method was validated before its application. The calibration equations and some another validation parameters are summarised in Table 2. The limits of detection (LOD) and quantification (LOQ) were estimated from the calculated standard deviations of the blanks linearly extrapolated from calibration data. In order to reduce the LODs and LOQs of both the surfactants, ITP was on-line coupled with CZE performed in an analytical capillary.
In this separation mode (ITP-CZE), isotachophoreticaly migrating compounds are stacked in sharp zones, transferred into the CZE capillary where are destacked and detected. Advantages of the ITP-CZE combination are the high separation capacity of ITP and the high separation efficiency and sensitivity of Table 1. Electrolyte systems used for the ITP and ITP-CZE separations
Parameter Leading electrolyte Terminating electrolyte
Cation Ammonium β-alanine
Concentration 5 mmol L-1 5 mmol L-1
Counter ion Acetate Acetate
Concentration 2.8 mmol L-1 2.8 mmol L-1 Solvent Water-ethanol (50:50) Water-ethanol (50:50)
CZE.34-37 The ITP-CZE system was realized by filling
the pre-separation and analytical capillaries with leading and terminating electrolytes, respectively. The ITP-CZE determination of the low CTA concentrations was limited by the presence of a close migrating impurity originated from the terminating electrolyte. On the other hand, the CP separation was disturbed by
no compounds if an UV detection at λ=259 nm (a
maximum of the CP absorption band) was applied. Therefore, the ITP-CZE system was used only for the analyses of the low concentrations of CP. A typical ITP-CZE record is demonstrated in Figure 2.
Precision and accuracy of ITP and ITP-CZE are summarized in Table 3. The inter-day precision calculated from the analyses performed during one week (n=7) were up to RSD= 2.80% for all separands. As no certified reference material (CRM) of cationic surfactants was available, the accuracy of the CTA and CP determinations were expressed as their recovery from spiked tap water. The ITP and ITP-CZE results of the CP analyses were
also confirmed by UV spectrometry at λ=259 nm. These
results indicate that the both ITP and ITP-CZE method are acceptable for the determination of the CSs and the metal ions at this adsorption study.
Adsorption of the cationic surfactants on montmorillonite
All adsorption (batch) experiments were performed in water-methanol (50:50, v/v) solutions to avoid micellization of the cationic surfactants. In order to understand adsorption mechanisms, the adsorption isotherms were constructed. These equilibrium data were analysed by their fitting with the isotherm models described above. The non-linear regression results are given in Table 4.
According to the R and AI criteria, the Langmuir-Freundlich isotherm is the most suitable model characterizing the adsorption of CTA on MMT (Figure 3). In the case of CP, all regression criteria show that both Langmuir and Langmuir-Freundlich models are potential for the experimental data smoothing. In addition, the power constant r is statistically equal 1 (see the r confidence interval) which means that the Langmuir-Freundlich can be replaced by the simpler Langmuir one. The evaluation of the best fitting isotherms could elucidate how the cationic surfactants are adsorbed on the montmorillonite surface.
CP was adsorbed in agreement with the Langmuir model which was theoretically derived supposing no interactions between compounds forming monolayers on solids. On the other hand, the adsorption of CTA is better described by the Langmuir-Freundlich isotherm Table 3. Intra-day precision and accuracy of the ITP and ITP-CZE me-thods
Analyte Added Found Recovery/(%) n RSD/(%)
CTA 0.20 0.197 98.65 7 4.45
0.40 0.395 98.75 6 2.91
0.60 0.580 96.62 7 2.21
CP 0.20 0.204 101.95 6 1.10
0.40 0.415 103.65 7 1.05
0.60 0.591 98.08 8 2.12
CP (ITP-CZE) 0.010 0.0096 95.60 5 3.19
0.050 0.0496 99.14 7 3.43
Note: RSD, relative standard deviation, all concentration units are given in mmol L-1.
Table 2. ITP calibration parameters
Analyte Regression equations LOD LQD UCL R
CTA y = –0.89 + 106.6 x (n=10) 0.02 0.03 0.80 0.9994
CP y = 0.11 + 86.2 x (n=16) 0.02 0.04 0.80 0.9989
CTAa y = –254 + 88494 x (n=6) 0.005 0.007 0.05 0.9984
CPb y = –1552 + 462805 x (n=8) 0.004 0.005 0.08 0.9986
Note: n-number of repeated analyses, y-zone length (s), x-concentration, UCL-upper calibration limit, R-regression coefficient,athe conductivity and bUV detection in the analytical capillary of ITP-CZE. All concentration units are given in mmol L-1.
with r<1 which supposes some types of interactions between adsorbing molecules. Such interactions can be ascribed to the forces among cationic surfactant intercalated into the MMT interfacial space. Thus the significant interactions of CTA would be explained by its significant intercalation.
Intercalation of montmorillonite with CTA and CP has been already modelled by means of molecular
dynamic simulations.38,39 Both CTA and CP were
suggested to be arranged within interlamellar space in a liquid like disordered monolayer. The stronger intercalation of CTA was predicted as well as confirmed
experimentally.39 Also in our recent work40 we have
found that the basal spacings d001 of the MMT saturated
with CTA exhibited the higher basal spacing (d001=1.75)
than in the case of CP (d001=1.66).
These isotherm analyses results also imply that both CP and CTA are arranged in their monolayers on the
external MMT surface. It agrees with our concept40 based
on molar balance between the surfactants adsorbed and the metal ions desorbed from MMT saturated with CP and CTA. Unlike CTA monolayers created by means of ion-exchange mechanisms, the CP monolayers could be additionally formed via interactions of the pyridinium headgroups, such as the induced interactions between
pyridinium rings and polar silicate face and the π-π
interactions between neighbouring pyridinium rings. In order to confirm this idea, the molecular simulations of the cationic surfactants adsorption on the external MMT surface will be tested in the near future.
Conclusions
In this paper, the physico-chemical study of the CTA and CP adsorption on montmorillonite was carried out. For this purpose, the ITP and ITP-CZE methods were developed and validated. Using the ethanolic electrolytes, ITP was found to be an effective separation technique for the analyses of CTA and CP in a very short time.
The adsorption equilibrium data were fitted with the common adsorption isotherms, such as Langmuir, Freundlich, and Langmuir-Freundlich ones. The CP and CTA adsorption was best described by the Langmuir and Langmuir-Freundlich models, respectively. These results indicate the monolayer arrangement of the both surfactants on the MMT external surface. Additionally, the CTA significant interactions (the power constant r<1) can be explained by its intercalation which takes Figure 3. Adsorption data fitting with the Langmuir and
Langmuir-Freundlich isotherms.
0.0 0.2 0.4 0.6 0.8 1.0 1.2 1.4
0.1 0.2 0.3 0.4 0.5 0.6 0.7
CP, Langmuir isotherm
CTA, Langmuir-Freundlich isotherm CTA CP
A
ds
or
be
d/
de
sor
be
d
conc
./
(m
equi
v.
g
-1 )
Equilibrium CSs concentration/(mmol L-1
) Table 4. Results of the adsorption isotherms fitting
Adsorption models - adsorption of CTA (n=11)
Parameter Langmuir Freundlich Langmuir-Freundlich
am 00.5288 ± 0.0251 0.5514 ± 0.0462 00.5564 ± 0.0452
k 100.5 ± 46.3 — 100.1 ± 47.1
p/r — 9.326 ± 4.253 00.7008 ± 0.2680
R 0.9579 0.8824 0.9769
MEP 0.0021 0.0034 0.0118
AIC –76.68 –65.80 –81.16
Adsorption models - adsorption of CP (n=12)
Parameter Langmuir Freundlich Langmuir-Freundlich
am 00.6408 ± 0.0231 0.6769 ± 0.0608 00.6574 ± 0.0372
k 139.6 ± 33.1 — 131.5 ± 37.6
p/r — 7.866 ± 2.652 00.8137 ± 0.2503
R 0.9842 0.9147 0.9868
MEP 0.0011 0.0054 0.0014
place in higher extent than in the case of CP. The results of this physico-chemical study will be completed by molecular simulations in the future research.
Acknowledgment
This work was supported by the Ministry of Education, Youth and Sport of the Czech Republic (MSM 6198910016).
References
1. Stevens, J.J.; Anderson, S.J.; Clays Clay Miner.1996,44, 132.
2. Srinivasan, K.R.; Fogler, H.S.; Clays Clay Miner.1990,38, 277.
3. Boyd, S.A.; Sun, S.; Lee, J.F.; Mortland, M.M.; Clay. Clay.
Miner.1988,36, 125.
4. Michot, L.J.; Pinnavaia, T.J.; Clays Clay Miner.1991,39, 634.
5. Burris, D.R.; Antworth, C.P.J.J.; J. Contam. Hydrol.1992,10,
325.
6. Lee, S.Y.; Kim, S.J.; Chung, S.Y.; Jeong, C.H.; Chemosphere
2004,55, 781.
7. El-Nahhal, Y.Z.; Safi, J.M.; J. Colloid Interface Sci.,2004,269,
265.
8. Li, Z.; Burt, T.; Bowman, Z.S.; Environ. Sci. Technol.2000, 34, 3756.
9. Jiang, J.Q.; Cooper, C.; Ouki, S; Chemosphere2002,47, 711.
10. Li, Z.; Bowman, R.S.; Water Res.2001,35, 3771.
11. Li, Z.; Bowman, R.S.; Environ. Sci. Technol.1997,31, 2407. 12. Sakai, T.; Teshima, N.; Takatori, I.; Anal. Sci. 2003,19, 1323.
13. Li, S.; Zhao, S.; Anal. Chim. Acta2004,501, 99.
14. Heinig, K.; Vogt, C.; Gerhard, W.; J. Chromatogr., A1996,745,
281.
15. Harrison, Ch.R.; Lucy, Ch.; J. Chromatogr., A2002,956, 237.
16. Norberg, J.; Thordarson, E.; Mathiasson, L.; Jönsson, Å.; J.
Chromatogr., A2000,869, 523.
17. Herrero-Martínez, J.M.; Simó-Alfonso, E.F.; Mongay-Fernández, C.; Ramis-Ramos, G.; J. Chromatogr., A2000,895, 227.
18. Heinig, K.; Vogt, C.; Gerhard, W.; Fresenius J. Anal. Chem.
1997,358, 500.
19. Kharitonova, K.; Rudnev, A.; Ivanova, N.; Progr. Colloid.
Polym. Sci.2004,125, 184.
20. Piera, E.; Erra, P.; Infante, M.R.; J. Chromatogr. A1997,757, 275.
21. Schöftner, R.; Buchberger, W.; Malissa H.; J. Chromatogr. A
2001,920, 333.
22. Öztenkin, N.; Erim, F.B.; J. Pharm. Biomed. Anal.2005,37,
1121.
23. Capote, F.P.; de Castro, M.D.L.; Electrophoresis2005,26, 2283. 24. Taylor, R.B.; Toasaksiri, S.; Reid, R.G.; J. Chromatogr. A1998,
798, 335.
25. Tribet, C.; Gabouriaud, R.; Gareil, P.; Electrochim. Acta1992,
37, 2769.
26. Tribet, C.; Gabouriaud, R.; Gareil, P.; J. Chromatogr.1992,
609, 381.
27. Praus, P.; Talanta2005,65, 281.
28. Zhu, L.; Tian, S.; Shi, Y.; Clays Clay Miner.2005,53, 123.
29. Halsey, G.; Advan. Catal. Relat. Subj.1952,4, 259.
30. Sips, R.; J. Chem. Phys,1950,18, 1024.
31. Sharma, S.; Agarwal, G.P.; Anal. Biochem.2001,288, 126.
32. Valášková, I.; Havránek, E.; J. Chromatogr. A1999,836, 201. 33. Everaerts, F.M.; Beckers, J.L.; Verheggen, Th.P.E.M.;
Isotachophoresis, Elsevier: Amsterdam, 1976.
34. Kaniansky, D.; Marák, J.; J. Chromatogr.1990,498, 191.
35. KÌivánková, L.; Gebauer, P.; Thormann, W.; Mosher, R.; Boek
P.; J. Chromatogr.1993,638, 119.
36. KÌivánková, L.; Gebauer, P.; Boek, P.; J. Chromatogr., A1995,
716, 35.
37. Kaniansky, D.; Marák, J.; Laštinec, J.; Reijenga, J.C.; Onuska, F.I.; J. Microcol. Sep.1999,11, 141.
38. Hackett, E.;Manias, E.; Giannelis, E.P.; J. Chem. Phys.1998,
108, 7410.
39. Pospíšil, M.; japková, P.; M©Ìínská, D.; Malá, Z.; imoník,
J.;J. Colloid Interface Sci. 2001,236, 127.
40. Praus, P.; Turicová, M.; tudentová, S.; Ritz, M.; J. Colloid
Interface Sci.2006,304, 29.