ABSTRACT: The crop load level of an apple (Malus × domestica Borkh.) tree impacts fruit yield and quality parameters, tree vigor and biennial bearing. The optimal crop load is that which al-lows for consistent annual cropping and fruit quality acceptable to the market. We evaluated the effect of crop load on yield and fruit quality of two low-chill apples cv. ‘Caricia’ and ‘Eva’, growing in a mild winter area. During 2010 and 2011 crop load was manually adjusted from 2 or 3 to 17 fruits cm−2 of trunk cross-sectional area (TCSA). Fruit yield was positively related to crop load in both cultivars but mean fruit weight diminished as the crop load increased. For both cultivars, the production of non-commercial and small-sized fruit increased, whereas production of middle-sized fruit diminished as the fruit load increased. Shoot length was not affected by crop load in ‘Eva’ whereas it was reduced in ‘Caricia’. Red skin color (RSC %) had a quadratic response to crop load in ‘Caricia’. On the other hand, the RSC % of ‘Eva’ fruit was adjusted to a negative loga-rithmic model as an effect of crop load increment. No biennial bearing was observed in either cultivar. This research study suggests that the maximum limit of crop load for both cultivars is 7 fruits cm−2 of TCSA, and the lower limit of crop load was 3 fruits cm−2 of TCSA for ‘Eva’ and 5 fruits cm−2 of TCSA for ‘Caricia’.
Keywords: Malus domestica, crop load, hand thinning, trunk cross-sectional area, fruit quality
Introduction
Under adequate chilling accumulation, suitable conditions for foraging of pollinating insects, and good agro-technical practices, fruit trees usually produce a larger number of fruits than they can support for high-quality fruit yield (Stover, 2000). For high-yield apple (Malus domestica) cultivars, this means that all flowers of an inflorescence may set fruits and some of them will have poor fresh commercial quality. Therefore, fruit thinning is an agronomical practice widely used to re-duce crop load in order to obtain consistent high yield and quality (Dennis Jr., 2000; Link, 2000; Wertheim, 2000). However, a major difficulty of thinning is to find the optimal thinning intensity.
For the fresh market, the main fruit quality attri-butes that affect consumers’ preferences are appearance, including both fruit size and skin fruit color, and eat-ing quality (Iglesias et al., 2008, 2012). All of these fruit quality attributes are negatively affected by increased crop load, and therefore the economic value of the crop (Embree et al., 2007; Link, 2000; Meland, 2009; Treder, 2008, 2010; Wright et al., 2006). A sub-optimal crop load will result in low yields and increased tree vigor (Inglese et al., 2002).
Whereas crop loads above the optimal level will result in low quality fruit (e.g.: small size, poor red cov-erage, low flesh firmness), and biennial cropping in some varieties such as ‘Honeycrisp’, ‘Fuji’ or ‘Elstar’ (Embree et al., 2007; Hampson and Kemp, 2003). The optimal crop load is that which delivers consistent annual crop-ping and fruit quality acceptable to the market.
Two low-chill cultivars, ‘Eva’ and ‘Caricia’, are widely grown varieties in the mild winter areas of America, Africa and Asia (Pommer and Barbosa, 2009).
Numerous studies have been published on the yield be-havior of these cultivars in areas where there is a lack of chilling (Chagas et al., 2012), as well as on their re-sponse to artificial dormancy release (Cruz Jr. and Ayub, 2002; Roberto et al., 2006). However, no studies have been published on the optimal crop load that will de-liver regular annual cropping and fresh marketable fruit quality. Furthermore, apple cultivars that are growing in chill-deficient areas may fail to produce high qual-ity fruits because the temperature regime can affect bud break, fruit set, fruit growth and ripening (Hauagge and Cummins, 2001).
The objective of this study was to determine the optimal crop load for obtaining high yield, good fruit quality, and moderate vegetative growth, without pro-ducing biennial bearing, in the ‘Eva’ and ‘Caricia’ apple cultivars.
Materials and Methods
Plant material
Three experiments were carried out in 2010 and 2011, using Apple trees (Malus × domestica Borkh) grafted onto ‘M.9 EMLA’ rootstocks. The cultivars cho-sen were ‘Eva’ (IAPAR-75 ‘Anna’ × ‘Gala’) and ‘Caricia’ (IAPAR-77 ‘Anna’ × ‘Prima’), well adapted to regions with 100 to 500 CU (chilling units according to the UTAH model). Both cultivars originate from an apple breeding program at IAPAR, a government research in-stitution in Brazil, and released in 1995 (Hauagge and Cummins, 2001). ‘Eva’ has a middle-sized and bicol-ored fruit (resembles ‘Gala’) that is harvested in late December (early season) under our climatic conditions. The tree has a compact growth, semi-spur habit, and high fruit set even on one year old wood (Hauagge and 1National University of Littoral/Faculty of Agricultural
Sciences − Dept. of Vegetal Production − Kreder 2805 − 3080 − Esperanza, Santa Fe − Argentina.
2National Scientific and Technical Research Council (CONICET) − Rivadavia 1917 − República Argentina − Argentina.
*Corresponding author <[email protected]>
Edited by: Luís Guilherme de Lima Ferreira Guido
Crop loading studies on ‘Caricia’ and ‘Eva’ apples grown in a mild winter area
Damián César Castro1,2*, Norma Álvarez1, Paola Gabriel1, Norma Micheloud1, Marcela Buyatti1, Norberto Gariglio1
Received August 06, 2014
Cummins, 2001). ‘Caricia’ resembles ‘Prima’ but is larger and redder and has an uneven ripening, the tree is vigorous and with a spur growth habit (Hauagge and Cummins, 2001). The mean harvest date of this culti-var is early January (early season), under our climatic conditions.
The trees were planted 4 × 2 m apart (1,250 trees ha−1) during the year 2006 in a commercial orchard located near Santa Fe, Argentina (31º32’58” S.; 60º40’36” O; 18 m a.s.l.); trained as horizontal palmette system with east-west orientation, and supplied with supplementary drip irrigation. Chilling hour accumulation (< 7.0 ºC) was 336 in 2010, and 342 during 2011.
Experiments 1 (year 2010) and 2 (year 2011)
In both experiments, crop load was adjusted by hand thinning to obtain different crop load treatments, from 3 to 17 fruits cm−2 of TCSA (trunk cross sectional area) for ‘Eva’, and from 2 to 12 fruits per unit of TCSA for ‘Caricia’ (Tables 1 and 2). For both cultivars one tree per crop load level was used. Before hand thinning, the TCSA of each tree was calculated from a circumference measurement taken 20 cm above the graft union. Fruit thinning was performed at stage 72 of the BBCH scale (Meier et al., 1994), which corresponds to fruit with an average equatorial diameter of 20 mm (about 30 days after full bloom).
We evaluated the relationship between crop load and percentage of red skin color (RSC %), mean fruit weight (g) and total yield (kg per tree). We also evaluated the relationship between crop load and yield (kg per tree) of fruits in three size categories (Noncommercial
fruits: < 61 mm of equatorial diameter. Small-sized fruits: 61-70 mm of equatorial diameter. Middle-sized fruits: 70-80 mm of equatorial diameter). None of the cultivars produce fruit with an average caliber greater than 80 mm. Noncommercial fruits cannot be sold in the fresh market and must be directed to industry, with lower prices. Small-sized fruits sell at intermediate prices and middle-sized fruits are sold at higher prices in the fresh market if the RSC exceeds 40 % from bicolored cultivars such as ‘Eva’ and 70 % from red cultivars such as ‘Caricia’.
RSC was quantified visually using a rating scale (0 %, 25 %, 50 %, 75 %, and 100 %) based on the average of over-color covering fruit surface. For both cultivars fruit maturity was determined by a starch index ranging from 1 (immature) to 9 (over mature) according to the starch-iodine chart published by Bouzo and Gariglio (2013). Thus, the starch index for ‘Caricia’ fruits at harvest was 5.0 ± 2.0 and for ‘Eva’ fruits was 8.5 ± 0.6. Furthermore, the mean fruit firmness of ‘Caricia’ fruits was 81.5 N and of ‘Eva’ fruits was 77.2 N at harvest. This means that ‘Caricia’ fruits were mature and ‘Eva’ fruits were over-maturing at harvest.
Forty-eight trees of each variety were used in a completely randomized statistical design (CRD), with one replication per crop load level. The experimental unit was a single tree and the experiment was repeated during 2010 and 2011 using the same crop load inter-val. According to Montgomery and Runger (2003), any regression model can be fitted using 'n' pairs of observa-tions. In our experiments each of these pairs were com-posed of crop load (of a given tree) as an independent
Table 1 − Effect of crop load on average fruit weight, diameter, shape, red skin color, total yield, yield of noncommercial fruits, yield of small-sized fruits and yield of middle-small-sized fruits for ‘Caricia’ apple. Data from experiments 1 and 2 are shown pooled because there were no significant differences between years. (TCSA: trunk cross-sectional area. RSC: Red skin color. MSE: Mean square error. CL: crop load).
Crop load Fruit weight Fruit mean diameter Fruit shape RSC Total Yield commercial fruitsYield of non- Yield of small-sized fruits Yield of middle-sized fruits Fruits cm−2 TCSA g mm % kg per tree
---2 146.9 72.4 0.82 56 15.5 1.4 5.5 9.1
3 139.3 71.1 0.85 62 16.9 1.6 6.4 7.6
4 133.8 70.2 0.83 67 18.5 1.9 7.5 6.5
5 129.6 69.5 0.84 70 20.3 2.2 8.8 5.7
6 126.2 69.0 0.88 73 22.2 2.6 10.4 5.0
7 123.3 68.5 0.82 74 24.3 3.0 12.2 4.4
8 120.8 68.1 0.80 73 26.6 3.5 14.3 3.9
9 118.6 67.7 0.84 72 29.1 4.1 16.8 3.5
10 116.6 67.4 0.85 70 31.8 4.7 19.7 3.1
11 114.8 67.1 0.84 66 34.8 5.5 23.1 2.8
12 113.2 66.8 0.87 61 38.1 6.4 27.1 2.4
p-value 0.001 0.001 0.15 0.01 0.001 0.01 0.001 0.04
Model a+b*Log(CL) a+b*Log(CL) NS a+b*CL+c*CL2 a*exp(b*CL) a*exp(b*CL) a*exp(b*CL) a+b*Log(CL)
a 159.93 74.56 - 0.4058 12.93 1.05 3.97 11.64
b -43.34 -7.2 - 0.0899 0.09 0.15 0.16 -8.52
c - - - -0.0061 - - -
-R2 0.59 0.55 - 0.55 0.56 0.45 0.53 0.28
variable and each evaluated parameter as dependent variables, as reported by Elfving and Schechter (1993), Reginato et al. (2007) and Volz (1988).
Non-linear and linear regression models were se-lected by the minimization of the mean squared error, Bayesian (BIC) and Akaike (AIC) information criteria. The models were fitted using Infostat software (InfoS-tat S(InfoS-tatistical Software version 2013). Normality and homoscedasticity were tested graphically (Q-Q plot, and residuals vs. predictors plot, respectively). The threshold level of significance was p ≤ 0.05.
Experiment 3
During the year 2011, an additional group of trees (40 trees) of each variety was manually thinned to obtain crop load treatments of 2, 3, 4, 5 and 7 fruits cm−2 of TCSA.
In this trial, vegetative growth was evaluated by measuring the length (cm) of the vegetative shoots for each treatment at 30 and 60 days before fruit harvest, and 60 days after harvest. Fifteen vegetative shoots per tree randomly selected at 1.5 m above soil surface from both sides of the canopy, were measured. Return to bloom of each treatment was evaluated the following spring by de-termining initial fruit set (number of fruitlets cm−2 TCSA) on each individual tree before natural fruit drop.
A sample of ten fruits selected randomly from both sides of the canopy and from each tree at harvest was used to measure fruit firmness (N) and soluble solid
content (ºBrix) (internal fruit quality). Fruit firmness was determined using a handheld pressure gauge with an 11mm probe (McCormick Fruit Tech FT 327, Yakima, USA) and soluble solids content was determined with a portable thermo-compensated refractometer. For both cultivars the maturity of fruits was determined by the starch index ranging from 1 (immature) to 9 (over ma-ture) as reported by Bouzo and Gariglio (2013).
The experiment was a 2 × 5 factorial in a CRD. The experimental unit was a single tree and eight rep-lications per combination were used. Shoot length, re-turn to bloom and internal fruit quality were analyzed with general linear models (GLM) adjusted by the lme function of the nlme package (R Core Team 2014), using InfoStat’s interface (InfoStat Statistical Software version 2013). The threshold level of significance was p ≤ 0.05.
Where GLMs were significant, mean separation was performed using the Di Rienzo, Guzmán and Casanoves (DGC) test (Di Rienzo et al., 2002). Normality and homoscedasticity were tested graphically (Q-Q plot, and residuals vs. predictors plot, respectively). Variance structure was modeled using either the varIdent function or the varexp function of the nlme package of R. Since shoot length data is longitudinal and does not meet the independence assumption, the correlation between successive measurements of shoot growth was modeled using the corCompSymm compound symmetry function of the R nlme package.
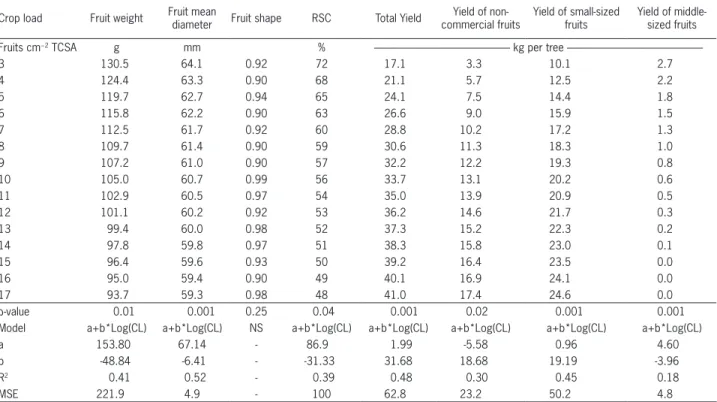
Table 2 − Effect of crop load on average fruit weight, diameter, shape, red skin color, total yield, yield of non-commercial fruits, yield of small-sized fruits and yield of middle-small-sized fruits for ‘Eva’ apple. Data from experiments 1 and 2 are shown pooled because there were no significant differences between years. (TCSA: trunk cross-sectional area. RSC: red skin color. MSE: mean square error. CL: crop load)
Crop load Fruit weight Fruit mean diameter Fruit shape RSC Total Yield commercial fruits Yield of non- Yield of small-sized fruits Yield of middle-sized fruits
Fruits cm−2 TCSA g mm % kg per tree
---3 130.5 64.1 0.92 72 17.1 3.3 10.1 2.7
4 124.4 63.3 0.90 68 21.1 5.7 12.5 2.2
5 119.7 62.7 0.94 65 24.1 7.5 14.4 1.8
6 115.8 62.2 0.90 63 26.6 9.0 15.9 1.5
7 112.5 61.7 0.92 60 28.8 10.2 17.2 1.3
8 109.7 61.4 0.90 59 30.6 11.3 18.3 1.0
9 107.2 61.0 0.90 57 32.2 12.2 19.3 0.8
10 105.0 60.7 0.99 56 33.7 13.1 20.2 0.6
11 102.9 60.5 0.97 54 35.0 13.9 20.9 0.5
12 101.1 60.2 0.92 53 36.2 14.6 21.7 0.3
13 99.4 60.0 0.98 52 37.3 15.2 22.3 0.2
14 97.8 59.8 0.97 51 38.3 15.8 23.0 0.1
15 96.4 59.6 0.93 50 39.2 16.4 23.5 0.0
16 95.0 59.4 0.90 49 40.1 16.9 24.1 0.0
17 93.7 59.3 0.98 48 41.0 17.4 24.6 0.0
p-value 0.01 0.001 0.25 0.04 0.001 0.02 0.001 0.001
Model a+b*Log(CL) a+b*Log(CL) NS a+b*Log(CL) a+b*Log(CL) a+b*Log(CL) a+b*Log(CL) a+b*Log(CL)
a 153.80 67.14 - 86.9 1.99 -5.58 0.96 4.60
b -48.84 -6.41 - -31.33 31.68 18.68 19.19 -3.96
R2 0.41 0.52 - 0.39 0.48 0.30 0.45 0.18
commercial fruits remained relatively low and stable (11 to 16 %) in the same crop load range. In ‘Eva’, in contrast, the marked decrease in the percentage of middle-sized fruits under increasing crop load (from 17 to 3 %) was largely compensated by an increase in the percentage of non-commercial fruits (21 to 38 %), whereas small-sized fruits remained at about 60 %.
Total fruit Yield
Fruit yield increased with rise in crop load (p ≤ 0.05), although there were differences between both cul-tivars (Tables 1 and 2). The relationship between both variables was modeled with a logarithmic function for ‘Eva’ (Table 2), and with an exponential function for ‘Caricia’ (Table 1). In the range of 3-12 fruits cm−2 TCSA, the yield of ‘Eva’ was, on average, 10 % higher than that of ‘Caricia’ (Tables 1 and 2). Both cultivars increased their yield with crop load in the range of 3 to 9 fruits cm−2 TCSA, although this increase was much higher in ‘Eva’ than for ‘Caricia’ (Tables 1 and 2). Since the minimum fruit diameter for fresh marketing in Argen-tina is 61 mm, the adjustment of crop load in order to obtain the greatest potential fruit size for ‘Eva’ would result in a theoretical loss of 15.5 kg per tree (Table 2).
Red skin coverage (RSC %)
The RSC % was affected (p ≤ 0.05) by crop load for ‘Caricia’ and ‘Eva’ fruits (Table 1 and 2). For ‘Caricia’, RSC % presented a quadratic response to crop load increase. Thus, RSC % had a maximum value of 75 % at 7 fruits cm−2 TCSA (Table 1) and no significant differences between extreme crop loads were found. For ‘Eva’ the RSC % exhibited a negative logarithmic response to increases in crop load, and was higher than 40 % between 3 and 17 fruits cm−2 TCSA (Table 2).
Internal fruit quality
No effect of crop load or cultivar on fruit firmness was found (p > 0.05) (Table 3). Fruit soluble solid content was higher (p = 0.001; r2 = 0.71) for ‘Eva’ than for ‘Caricia’ (14.3 vs. 13.3 %). The starch pattern index was lower for ‘Caricia’ than for ‘Eva’ (p = 0.001; r2 = 0.58) indicating that the maturity was advanced for the latter (Table 3).
Shoot length
For the ‘Caricia’ variety, the length of current sea-son vegetative shoots varied with the crop load. An in-teraction between the effect of crop load and the effect of the lenght of the growing season (p = 0.001; r2 = 0.60) was also found. Sixty days before harvest, shoot length was unaffected by crop load (Figure 1A). None-theless, shoot length decreased due to the effect of crop load in the two later measurements, and mainly when crop load was above 5 fruits cm−2 of TCSA (Figure 1A). Shoot length decreased by about 40 % at 5 fruits cm−2 compared to the lower fruit load treatments (Figure 1A). The length of current season vegetative shoots of ‘Eva’
Results
Fruit size (weight and diameter) and shape
Fruit size decreased as crop load increased for both varieties (Tables 1 and 2) and only the effect of cul-tivar was sifnificant (p < 0.05) on fruit weight and mean fruit diameter. The relationship between fruit weight and crop load was adjusted to a decreasing logarithmic model. Since the relationship between both variables was similar in 2010 and 2011 (p > 0.05), data for experi-ments 1 and 2 were pooled for each cultivar. For ‘Cari-cia’ moderate fruit mass was obtained up to 7 fruits cm−2 TCSA (Table 1). Fruit mass of ‘Eva’ was lower than for ‘Caricia’, and in the first cultivar, fruit weight was very low with crop loads up to 5-6 fruits cm−2 TCSA (Table 2).
As was found with mean fruit weight, the relationship between mean fruit diameter and crop load was adjusted to a decreasing logarithmic model (Tables 1 and 2). Mean fruit diameter of ‘Caricia’ was greater than 61 mm throughout the crop load range (3-12 fruits cm−2 TCSA) (Table 1). In contrast, for ‘Eva’ the mean fruit diameter was less than 61 mm when crop load was over 9 fruits cm−2 TCSA (Table 2). Thus, the threshold crop load required to produce fresh marketable fruits in ‘Eva’ was in the range of 7 to 9 fruits cm−2 TCSA. On the contrary, diameter was not a constraint for fresh fruit marketing of ‘Caricia’ apples in the range of crop load tested.
Fruit shape was unaffected by crop load for both cultivars (p > 0.05) (Tables 1 and 2). However, ‘Eva’ fruits were lengthened (fruit shape ≥ 0.90) and ‘Caricia’ fruits were irregular (0.90 ≥ fruit shape ≥ 0.80).
Yield of non-commercial, small- and middle-sized fruits as related to crop load
For both cultivars, the number of non-commercial and small-sized fruits increased, whereas the number of middle-sized fruits diminished with the increase of crop load (Tables 1 and 2). The yield of non-commercial fruits of ‘Eva’ increased from 3 to 14.6 kg per tree when crop load was increased from 3 to 12 fruits cm−2 TCSA (Table 2). ‘Caricia’, in contrast, had a smaller increase in non-commercial fruit production (from 1.6 to 6.4 kg per tree) in the same crop load range (Table 1).
Production of small-sized fruits increased more markedly in ‘Eva’ (Table 2) than in ‘Caricia’ (Table 1) as crop load was raised from 3 to 8 fruits cm−2 TCSA. Production of middle-sized fruits was less sensitive to increases in crop load in ‘Eva’ than in ‘Caricia’. Yield of middle-sized apples in ‘Eva’ decreased by 1.7 kg per tree, whereas in ‘Caricia’ it decreased by 3.6 kg per tree under increasing crop loads in the range of 2-12 fruits cm−2 TCSA.
non-trees was not affected by crop load (2 to 7 fruits cm−2 TCSA) in any of the sampling dates (p > 0.05); therefore, shoot length varied only with the length of the growing season within a given crop load range (p = 0.03; r2 = 0.50) (Figure 1B).
Return to bloom
Neither flowering intensity nor initial fruit set in the following growing season were affected by crop load (p > 0.05). However, initial fruit set was higher for ‘Eva’ than for ‘Caricia’ (Table 3).
Discussion
Fruit size, yield of the three fruit size categories, and total fruit yield were all affected by crop load, although there were differences between cultivars. Most studies on apples have found negative correlation between mean fruit weight and crop load (Elfving and Schechter, 1993; Embree et al., 2007; Wright et al., 2006). This is due to the fact that fruit size is mainly determined by the number of cells per fruit and their subsequent enlargement (Harada et al., 2005), and both factors are affected by the competition for carbon between developing fruits as crop load increases (Ho, 1992). In the Argentinean apple fresh market, only fruits with diameter up to 61 mm can be sold (SENASA, 1983). However, middle-sized fruits (70-80 mm in diameter) are the most in demand and thus attract the highest prices.
For ‘Eva’ a crop load in excess of 7 fruits cm−2 TCSA will produce a large amount of non-commercial fruits, and reduce crop profitability. On the other hand, the average diameter is not a limitation for marketing
of ‘Caricia’ fruits, although a crop load higher than 7 fruits cm−2 TCSA will reduce the amount of middle-sized fruits. The different effects of crop load on yield distribution of the three fruit size categories observed for both varieties can be explained in terms of a genotype effect (Link, 2000; Volz, 1988).
In our study, mean fruit size of ‘Caricia’ was greater than for ‘Eva’ regardless of crop load, which suggests a greater genetic potential for fruit size of the first cultivar, and this difference has also been reported previously (Chagas et al., 2012). On the other hand, the adjustment
Table 3 − Effect of crop load treatment on fruit starch pattern index, fruit firmness, fruit soluble solid content and return to bloom. Data from experiment 3.
Cultivar loadCrop 1
Starch Pattern Index2
Fruit
Firmness (N) Soluble solid content (%) Return to bloom3
Caricia
Eva
2 5.9 b 80.6 13.2 b 8.7 b
3 5.6 b 81.9 13.3 b 8.4 b
4 6.1 b 81.0 13.2 b 9.0 b
5 5.9 b 79.3 13.2 b 9.7 b
7 5.8 b 79.6 13.4 b 10.2 b
2 7.6 a 79.3 14.3 a 15.9 a
3 8.1 a 79.7 14.2 a 16.1 a
4 8.3 a 79.5 14.3 a 16.0 a
5 8.8 a 79.0 14.4 a 17.3 a
7 7.7 a 79.2 14.4 a 16.5 a
Cultivar effect (C) *** NS *** *
Crop load effect
(CL) NS NS NS NS
C × CL effect NS NS NS NS
1expressed as fruit cm−2of trunk cross-sectional area (TCSA); 2Iodine starch test (1-9), where 1 = immature and 9 = over mature; 3Initial fruit set in the following season, expressed as fruitlets cm−2of (TCSA) before natural fruit drop; *indicate significant at p = 0.05; NS, and ***indicate not significant or significant at p = 0.001; Different letters in the same column represent differences (p < 0.05; Di Rienzo, Guzmán and Casanoves (DGC) test).
Figure 1 − Effect of crop load (x axis) and the time of the growing season on the vegetative shoot length (y axis) of ‘Caricia’ and ‘Eva’ apples. A - correspond to cv. ‘Caricia’. B - correspond to cv. ‘Eva’. Dissimilar letters indicate difference (p < 0.05) by Di Rienzo,
of regression models (e.g.: exponential, logarithmic, etc.) between cultivars of total yield, non-commercial and small-sized fruit production curves indicates a significant cultivar × crop load interaction effect on these variables, in agreement with the data reported by Link (2000).
Changes in non-commercial and small-sized fruit production in response to increasing crop load observed in ‘Caricia’ are consistent with reports for other cultivars which bear moderately large to large fruits, such as ‘El-star’, ‘Golden Delicious’ and ‘Jonagold’ (Link, 2000). In contrast, the increases in the production of non-commer-cial fruits observed for ‘Eva’ with the increase of crop load was similar to that reported for the ‘Gala’ cultivar (Volz, 1988), which is prone to bearing small fruits (Igle-sias et al., 2008).
Despite their different fruit-size responses to in-creasing crop loads, both varieties produced a higher proportion of middle-sized fruits under conditions of higher fruit thinning intensity. However, this effect re-sulted from the reduction in the number of small fruits caused by fruit thinning rather than from a direct stimu-lus to fruit growth of the remaining fruits. These results are similar to those previously observed in medium to high-chilling cultivars (Embree et al., 2007; Link, 2000; Treder, 2008, 2010; Volz, 1988) and provide further sup-port to the hypothesis that the total fruit yield of apple trees is affected more by the number of fruits than by mean fruit weight (Forshey and Elfving, 1989; Elfving and Schechter, 1993).
Increased crop load leads to higher photoassimi-lates being partitioned in fruits than in vegetative or-gans, although the amount of nutrients and dry matter allocated to each individual fruit decreases (Marcelis, 1996). This fact accounts for both the increase in the total fruit yield per tree and the decrease in the mean fruit size with increases in crop load. Thus, higher total fruit yield under increased crop load is due to an in-crease in fruit number and to the greater sink capacity of fruits compared to roots, trunk, and vegetative shoots (Ho, 1992; Inglese et al., 2002).
The higher sink capacity of fruits also explains why increasing crop load had a negative effect on the shoot growth of ‘Caricia’ trees in our study. Previous studies on apples have also found a decrease in veg-etative growth as crop load increases, an effect which extended even into subsequent growing seasons (Byers, 2003; Embree et al., 2007; Wright et al., 2006). However, in our work, ‘Caricia’ shoots were never shorter than those of ‘Eva’, even under the highest crop load treat-ments (Figure 1). Consequently, none of the crop load treatments between 2 to 7 fruits cm−2 of TCSA compro-mised shoot growth of either cultivar.
The behavior of the vegetative growth of ‘Eva’ in relation to crop load increments could be related to its higher vigor and productivity than ‘Caricia’ (Hauagge and Cummins, 2001). The vegetative behavior of apple trees in our work might be a consequence of the early harvesting time in late summer (beginning of January in
the Southern Hemisphere) and the warm autumn tem-perature conditions, resulting in a very long growing sea-son which extends up to 100 days after harvest.
The percentage of red-over color of the fruit skin was relatively low in both cultivars (≈ 60-70 %), regard-less of crop load treatment. This might be explained by the fact that both cultivars are hybrids of ‘Gala’, which is characterized by poor red color development (Iglesias and Echevería, 2009; Iglesias et al., 2008). Moreover, the occurrence of high temperatures during fruit ripening in our study could have affected the development of ade-quate red coloration (Jackson, 2001). However we found significant differences in RSC % response to increasing crop load between cultivars.
The RSC % of ‘Eva’ fruits decreases continuously between crop load extremes, but the RSC % of ‘Caricia’ fruits decreases with increasing crop loads levels above 7 fruits cm−2 of TCSA. This decline in the proportion of red skin coloration found in our study agrees with previ-ous results for other cultivars such as ‘Honeycrisp’ (Em-bree et al., 2007; Wright et al., 2006), ‘Elstar’, ‘Jonagold’ and ‘Golden Delicious’ (Link, 2000).
This effect has been attributed to the decrease in the amount of photoassimilates available to individual fruits with the increase of competition between devel-oping fruits at high values of crop load. Nevertheless, to obtain high crop load levels in our study, more inflo-rescences with two, three or even four fruits were left in a given tree. Thus, in these inflorescences the fruits could have provided shade to each other resulting in a lower RSC %. On the other hand, the great shoot length 30 days before harvest between 2 to 4 fruits cm−2 of TCSA, and its subsequent decline above 4 fruits cm−2 of TCSA in ‘Caricia’, could explain the increase of RSC % between 2 to 6 fruits cm−2 of TCSA.
Anthocyanin levels increase with light exposure, and there is as direct relationship between RSC % and an-thocyanin levels in low and medium coloring ‘Gala’ apple strains (Iglesias and Echevería, 2009; Iglesias et al., 2008). Hence, the shading produced by increased shoot length in our study could have contributed to reducing RSC % of fruit from trees with 2 to 5 fruits cm−2 of TCSA.
Increasing crop load can promote biennial bearing in some apple cultivars. The varieties ‘Honeycrisp’ (Embree et al., 2007) or ‘Elstar’ (Meland, 2009) had a strong yield decrease after a year with a crop load about 8-9 fruits cm−2 of TCSA. However, not all apple cultivars show biennial bearing (Dennis Jr., 2003); ‘Gala’ being one of the cultivars with less tendency forward alternate fruit production (Volz, 1988). In fruit tree crops, alternate production is related to the synthesis of flower-induction inhibitors, mainly located in the seeds of the developing fruits (Stover, 2000). Accord-ing to our results, neither ‘Eva’ nor ‘Caricia’ showed bien-nial bearing, at least when crop load was below 7 fruits cm−2 of TCSA. In addition, we did not observe a decrease in the flowering intensity even under higher crop load treatments (> 7 fruits cm−2 of TCSA), although in these cases, flower intensity was not carefully quantified.
An optimal crop load is one which maximizes fruit yield and at the same time avoids detrimental effects on fruit quality, the following year’s yield, or tree vigor (Link, 2000). The optimal crop load for both cultivars has an up-per limit of 7 fruits cm−2 of TCSA. For ‘Eva’ a crop load above 7 fruits cm−2 of TCSA produced fruits with non-commercial diameter (< 61 mm), low average weight and a large number of unmarketable fruits. However, a crop load between 3 to 7 fruits cm−2 of TCSA produced a high yield, with fruits of good fresh commercial quality and the lowest proportion of non-commercial fruits. For ‘Cari-cia’ a crop load exceeding 7 fruits cm−2 of TCSA produced fruits with RSC < 75 %, as well as a negative effect on the number of middle-sized fruits, and reduced the current vegetative growth. This last fact may negatively affect the longevity of the trees. For this cultivar, a crop load below 5 fruits cm−2 of TCSA resulted in maximum mean fruit sizes, but at the expense of high yield losses.
Factors other than crop load may influence the fruit size, fruit color or yield of small- and middle-sized fruits (Link, 2000; Treder, 2008; Volz, 1988; Wrigth et al., 2006). The factors that can affect these variables include the fol-lowing: pruning intensity, initial fruit set, previous crop load of the trees, mineral nutrition, time of fruit thinning, flower bud quality, and age of the trees. In mild winter areas, the chilling availability of a given season should be included. The factors may influence the degree of cor-relation (r2 values) between crop load and the dependent variables. However, the pattern and the sense of these relationships did not change significantly between years, which are consistent with our results.
Conclusions
The optimal crop load for the low-chill apple culti-vars ‘Eva’ and ‘Caricia’ grown in a mild winter area, and aged between 4 and 5 years, has an upper limit of 7 fruits cm−2 of TCSA. In the range of 5 to 7 fruits cm−2 of TCSA for ‘Caricia’ and 3 to 7 fruits cm−2 of TCSA for ‘Eva’, the trees produced acceptable yields of good-quality fruit, without compromising either vegetative growth or the following year’s production.
Acknowledgments
We thank Eng. Oscar Liverotti of Corporation Central Market of Buenos Aires for information on the marketing of apples in the fresh market in Argentina. Support for this research was provided by the National Agency for Scientific and Technological Promotion through Project PICT Nº 00477, grants program from the National University of Littoral through CAI+D Projects, and by funding from the Secretary of State for Science, Technology and Innovation, dependent on the government of Santa Fe Province.
References
Byers, R.E. 2003. Flower and fruit thinning and vegetative: fruiting balance. p. 409-436. In: Ferree, D.D.; Warrington, I.J., eds. Apples, botany, production and uses. CABI, Wallingford, UK.
Bouzo, C.A.; Gariglio, N.F. 2013. Validation of apple harvest index of low chilling requirements. Agrociencia Uruguay 17: 74-80. (in Spanish, with abstract in English).
Chagas, E.A.; Cardoso Chagas, P.; Pio, R.; Bettiol Neto, J.E.; Sanches, J.; Carmo, S.A.; Cia, P.; Pasqual, M.; Carvalho, A.S. 2012. Production and quality attributes of apple tree cultivars in subtropical conditions at eastern of São Paulo state. Ciência Rural 42: 1764-1769 (in Portuguese, with abstract in English). Cruz Junior, A.O.; Ayub, R.A. 2002. The break of the dormancy
of brids of apple cv. Eva treateds with three concentrations of hydrogen Cyanamide. Revista Brasileira de Fruticultura 24: 576-578 (in Portuguese, with abstract in English).
Dennis Jr., F. 2000. The history of fruit thinning. Plant Growth Regulation 31: 1-16.
Dennis Jr., F. 2003. Flowering, pollination and fruit set and development. p. 153-166. In: Ferree, D.D.; Warrington, I.J., eds. Apples, botany, production and uses. CABI, Wallingford, UK. Di Rienzo, J.A.; Guzmán, A.W.; Casanoves, F. 2002. A Multiple
comparisons method based on the distribution of the root node distance of a binary tree. Journal of Agricultural, Biological, and Environmental Statistics 7: 1-14.
Elfving, D.C.; Schechter, I. 1993. Fruit count, fruit weight and yield relationships in ‘Delicious’ apple trees on nine rootstock. HortScience 28: 793-795.
Embree, C.G.; Myra, M.T.D.; Nichols, D.S.; Wright, A.H. 2007. Effect of blossom density and crop load on growth, fruit quality, and return bloom in Honeycrisp’ apple. HortScience 42: 1622-1625.
Forshey, C.G.; Elfving, D.C. 1989. The relationship between vegetative growth and fruiting in apple trees. Horticultural Review 11: 229-287.
Hampson, C.R.; Kemp, H. 2003. Characteristics of important commercial apple cultivars. p. 61-90. In: Ferree, D.D.; Warrington, I.J., eds. Apples, botany, production and uses. CABI, Wallingford, UK.
Hauagge, R.; Cummins, J.N. 2001. Pome fruit genetic pool for production in warm climates. p. 267-304. In: Erez, A., ed. Temperate fruit crops in warm climates. Kluwer Academic, Dordrecht, The Netherlands.
Ho, L.C. 1992. Fruit growth and sink strength. p. 101-124. In: Marshall, C.; Grace, J., eds. Fruit and seed production: aspects of development, environmental physiology and ecology. Cambridge University Press, Cambridge, UK.
Iglesias, I.; Echeverría, G.; Lopez, M.L. 2012. Fruit color development, anthocyanin content, standard quality, volatile compound emissions and consumer acceptability of several ‘Fuji’ apple strains. Scientia Horticulturae 137: 138-147. Iglesias, I.; Echevería, G. 2009. Does strain affect fruit color
development, anthocyanin content and fruit quality in ‘Gala’ apples?. A comparative study over three seasons. Journal of the American Pomological Society 63: 168-180.
Iglesias, I.; Echeverría, G.; Soria, Y. 2008. Differences in fruit color development, anthocyanin content, fruit quality and consumer acceptability of eight ‘Gala’ apple strains. Scientia Horticulturae 119: 32-40.
Inglese, P.; Caruso, T.; Gugliuzza, G.; Pace, L.S. 2002. Crop load and rootstock influence on dry matter partitioning in trees of early and late ripening peach cultivars. Journal of the American Society of Horticultural Science 127: 825-830.
Jackson, J.E. 2001. Apple production at low latitudes. p. 305-342. In: Erez, A., ed. Temperate fruit crops in warm climates. Kluwer Academic, Dordrecht, The Netherlands.
Link, H. 2000. Significance of flower and fruit thinning on fruit quality. Plan Growth Regulation 31: 17-26.
Marcelis, L.F.M. 1996. Sink strength as a determinant of dry matter partitioning in the whole plant. Journal of Experimental Botany 47: 1281-1291.
Meier, U.; Graf, H.; Hack, M.; Hess, M.; Kennel, W.; Klose, R.; Mappes, D.; Seipp, D.; Stauss, R.; Streif, J.; Boom, T. van den. 1994. Phenological growth stages of pome fruit trees (Malus domestica Borkh. and Pyrus communis L.), stone fruits trees (Prunus species), the currant (Ribes species) and strawberry (Fragaria × ananassa Duch.). Nachrichtenbl Deut Pflanzenschutzd 46: 141-153. (in German, with abstract in English).
Meland, M. 2009. Effects of different crop loads and thinning times on yield, fruit quality, and return to bloom in Malus × domestica Borkh. ‘Elstar’. Journal of Horticultural Science & Biotechnology ISAFRUIT Special Issue: 117-121.
Montgomery, D.C.; Runger, G.C. 2003. Simple linear regression and correlation. p. 372-409. In: Montgomery, D.C.; Runger, G.C., eds. Applied statistics and probability for engineers. John Wiley, Hoboken, NJ, USA.
National Health Service and Food Quality of Argentina [SENASA] 1983. Resolution N° 554/83. Available at: http://www.senasa. gov.ar/Archivos/File/File4374-rx-0554-83.pdf. [Accessed May 1, 2014] (in Spanish).
Pommer, C.V.; Barbosa, W. 2009. The impact of breeding on fruit production in warm climates of Brazil. Revista Brasileira de Fruticultura 31: 612-634.
Reginato, G.H.; Cortázar, V.G.; Robinson, T.L. 2007. Predicted crop value for nectarines and cling peaches of different harvest season as a function of crop load. HortScience 42: 239-245. Roberto, S.R.; Kagueyama, M.H.; Santos, C.E. 2006. Shooting
induction of 'Eva' apple under low incidence of cold winter. Revista Brasileira de Fruticultura 28: 128-130. (In Portuguese, with abstract in English).
Stover, E. 2000. Relationship of flowering intensity and cropping in fruit species. HortTechnology 10: 729-732.
Treder, W. 2008. Relationship between yield, crop density coefficient and average fruit weight of ‘Gala’ apple. Journal of Fruit and Ornamental Plant Research 16: 53-63.
Treder, W. 2010. Crop loading studies with ‘Jonagold’ apple tree. Journal of Fruit and Ornamental Plant Research 18: 59-69. Volz, R.K. 1988. Regulation and estimation of crop load on ‘Gala’
apple trees. New Zealand Journal of Experimental Agriculture 16: 47-53.
Wertheim, S.J. 2000. Developments in the chemical thinning of apple and pear. Plant Growth Regulation31: 85-100.