Isabel Cristina Martins de FreitasI
Suzana Alves de MoraesII
I Programa de Pós-Graduação em Enfermagem e Saúde Pública. Escola de Enfermagem de Ribeirão Preto (EERP). Universidade de São Paulo (USP). Ribeirão Preto, SP, Brasil
II Departamento Materno-Infantil e Saúde Pública. EERP-USP. Ribeirão Preto, SP, Brasil
Correspondence:
Suzana Alves de Moraes Av. dos Bandeirantes, 3900 14040-902 Ribeirão Preto, SP, Brasil E-mail: [email protected]
Received: 12/5/2009 Approved: 8/11/2010
Article available from: www.scielo.br/rsp
Economic profi le of Ribeirão
Preto population: application
of the National Economic
Indicator
ABSTRACT
The study aimed to apply the National Economic Indicator on data from a cross-sectional population-based study (nw =2,197) in the city of Ribeirão Preto, Southeastern Brazil, in 2006. Compared to Brazil, the indicator presented a concentration around the last fi ve deciles and was similar to that of the municipality of São Paulo, also in Southeastern Brazil. Differences were observed concerning the gender of the head of the family, showing more unfavourable conditions to families headed by women. Easy calculation and application along with the possibility of comparison with other Brazilian cities confi rm that this indicator is a practical tool that can be applied to population-based studies in the evaluation of socioeconomic level.
DESCRIPTORS: Economic Indexes. Income. Socioeconomic Factors.
Socioeconomic Analysis. Social Conditions. Cross-Sectional Studies.
INTRODUCTION
The scientifi c production about social inequalities and health in Latin America and the Caribbean presented a fast growth between 1971 and 2000.1 Countries
like Argentina, Brazil, Chile and Mexico were responsible for this growth, even though the major part of this production was concentrated on conceptual or cluster studies.
A large part of the epidemiological studies has used socioeconomic indicators like: income, level of schooling, household density, among others, individually or grouped together. However, this strategy has not always been successful concerning the construction or strengthening of the “theory” of social deter-minants in health, independently of the underlying theoretical conception. Such determinants have a clustered nature, as exemplifi ed in the historical series study conducted by Jacinto et al,4 which showed the impact of
employ-ment, average income and illiteracy rate on the general mortality rates from 1981 to 2000. Based on static and dynamic models, the authors concluded that high employment rates are related to lower mortality rates, and that 1 percent increases in the employment rates promoted, on average, a 38% decrease in general mortality in the studied period.
Some methodological proposals were developed in Brazil in the last three decades3,5 with the purpose of investigating the relationship between the social
Barros & Victora2 haverecently proposed the National
Economic Indicator (IEN), derived from information on consumer goods and level of schooling of the head of the family, enabling the calculation of the respec-tive reference values for Brazil, macro-regions, states and capitals. Their fi ndings seem to refl ect, in a reli-able way, the socioeconomic profi le of these regions, resulting in one more option for the socioeconomic classifi cation of the population, in population-based epidemiological studies.
In this perspective, the present study aimed to apply the economic indicator to the municipality of Ribeirão Preto and identify socioeconomic differences according to the gender of the head of the family.
METHODS
The data were extracted from a population-based cross-sectional study carried out in the municipality of Ribeirão Preto, Southeastern Brazil, in 2006, whose proposal was to investigate the prevalence of diabetes mellitus and obesity in adults aged 30 years and older, living in an urban area of the municipality (“Risk factors for overweight, obesity and diabetes mellitus in the municipality of Ribeirão Preto, SP, 2006 – OBEDIARP Project”). Cluster sampling was carried out in three stages: 81 census tracts (IBGE-2000a),
1,671 households and 1,205 individuals were drawn in the fi rst, second and third stages, respectively. The census tract was considered the primary sampling unit.6
The sample of participants, representative of age strata in each gender, was composed of 930 adults living in the municipality. The response rate of the OBEDIARP Project was 78%, and the losses were distributed in the following way: 6.7% due to changes of address, 0.6% due to deaths and 14% were caused by refusals. Pregnant and puerperal women up to the sixth month were excluded from the study (0.7%).
The variability introduced in the second and third sampling fractions was considered, and sampling weights6 were attributed in order to correct the
non-response rate and the number of eligible individuals in each household, thus originating a weighted sample of 2,197 participants.
The study’s variables were: family income in Reais; level of schooling of the head of the family, in complete years; gender of the head of the family; total number of bedrooms in the household; total number of toilets; number of TV sets; number of cars; presence in the household of: radio, refrigerator/freezer, video cassette recorder/DVD player, washing machine, microwave oven, telephone line, personal computer and air conditioner.
a Instituto Brasileiro de Geografi a e Estatística. Censo Demográfi co 2000. Rio de Janeiro; 2000.
The composition of the economic indicator of Ribeirão Preto (IERP) followed the proposal of Barros & Victora2 for the construction of the IEN, derived from
information of the Population Census carried out in 2000. These authors used principal component analysis to select variables related to domestic goods, household size and level of schooling of the head of the family. A set of 13 variables was retained in the fi rst model, being responsible for 38% of the total variability. To each one of the 13 variables, a coeffi cient was generated from the calculus:
The IEN was equivalent to the result of the summation of products of the codes attributed to the categories of variables by the respective coeffi cients.
For the comparison of the economic profi le of Ribeirão Preto with other Brazilian regions and municipalities, the reference values of the IENdeciles2 estimated for
Brazil as a whole and for the municipality of São Paulo, also in Southeastern Brazil, were applied to the IERP. The IERP was calculated for 2,180 participants (missing values for level of schooling of the head of the family nw=17), being subsequently classifi ed according to the deciles of the distribution.
In a subsample of the study (nw=1125) to which the information of the gender of the head of the family was available (the study participant was also the head of the family), the distribution of the IERP was stratifi ed for this information.
To evaluate the consistency of the indicator as a proxy of the socioeconomic level of the study’s population, Pearson correlations were calculated between the IERP and the logarithms of total family income and per capita family income.
All the analyses took into consideration the sampling design effect6 and were run in the Stata software,
version 8.2.
The OBEDIARP Project was approved by the Research Ethics Committee of the Escola de Enfermagem de Ribeirão Preto (no. 0528/2005, April 2005). All the participants signed an informed consent document.
RESULTS
638.69;1,013.58) and 51.5% were considered heads of families. Regarding the IERP indicator, the estimated mean was 620.9, ranging from 131 to 1,086. The IERP cut-offs estimated in deciles (percentile 10=324.0, percentile 20=396.8, percentile 30=478.0, percentile 40=531.6, percentile 50=596.0, percentile 60=663.0, percentile 70=738.8 , percentile 80=807.4 and percentile 90=919.8) were higher than those found for the national indicator and for the municipality of São Paulo.
Figure 1 shows the percentage distribution of the IERP deciles applying the Brazil and the municipality of São Paulo cut-offs. Compared to the country, the IERP distribution was more concentrated around the last fi ve deciles. When compared to the municipality of São Paulo, the distribution, although concentrated slightly to the right, was quite similar, indicating that the respective cut-offs can be used in an interchangeable way.
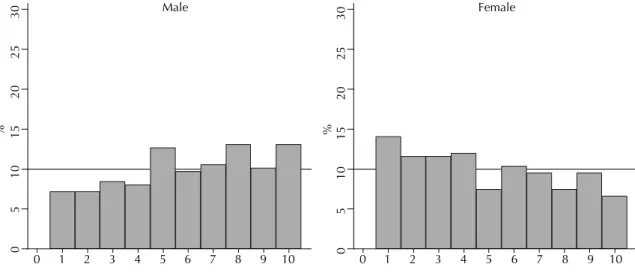
Figure 2 displays the distribution of the IERP deciles, according to the gender of the head of the family: 49.6%
of males and 50.4% of females. The percentage distribu-tions of the deciles were symmetrically opposed and families headed by women presented a concentration around the fi rst fi ve deciles, that is, worse socioeco-nomic conditions.
The Pearson correlation between the IERP indicator and the total family income logarithm was 0.75 (p<0.01), and 0.62 (p<0.01) considering the per capita family income logarithm.
DISCUSSION
The economic profi le of the population of Ribeirão Preto according to the IERP corresponds to good socio-economic conditions and places it in an outstanding position in the economic scenario of the state of São Paulo. The IERP presented consistency with the family income of the studied population and also when compared to other regions of Brazil.
0
5
10
15
20
25
30
%
0 1 2 3 4 5 6 7 8 9 10
Brazil
0
5
10
15
20
25
30
%
0 1 2 3 4 5 6 7 8 9 10
São Paulo
Figure 1. Economic indicator of Ribeirão Preto in deciles, according to Brazil and the municipality of São Paulo cut-offs. Ribeirão Preto, Southeastern Brazil, 2006
0
5
10
15
20
25
30
0
5
10
15
20
25
30
%
0 1 2 3 4 5 6 7 8 9 10 0 1 2 3 4 5 6 7 8 9 10
Male Female
%
Barros & Victora2 applied the IEN in a cross-sectional
study carried out in Porto Alegre, Southern Brazil, with approximately 3000 individuals assisted by Family Health Program(PSF). In the comparison between the quintiles estimated to the population assisted by PSF and the reference values of the city of Porto Alegre, a concentration to the left was observed, mainly in the fi rst two quintiles, depicting that approximately 40% of the sample was concentrated below the fi rst quintile of Porto Alegre’s cut-off.
Data from Brazilian National Household Survey (PNAD, 2008)b revealed that the average income of
the Brazilian households increased by 2.8% when compared to that of 2007. This information shows that there has been a slight improvement in the life condition of the poorer population and in the access to consumer goods.
Preliminary results of a study carried out by Instituto de Pesquisa Econômica Aplicada (IPEA)c based on
data from PNAD 2007, pointed out that the women are being more and more considered heads of families in the Brazilian households. The proportion of families headed by women increased from 24.9% in 1997 to 33% in 2007. In the Southeast region, only 16.2% of these fami-lies were classifi ed in the class of per capita monthly family income above two minimum salaries and 23.5% in the class up to ½ minimum salary, compared to 23.9% and 12.1% of the families headed by men, respectively. Despite the reduction in the number of children and the increasing schooling rates and participation in the job
market presented by women, the households headed by them had a reduced consumption capacity compared to the families headed by men.
The results of the present study showed that an indicator based on consumer goods and on the level of schooling of the head of the family seems to have a good discrimi-natory power in the evaluation of socioeconomic level, even in populations living in areas of high economic performance, as in the case of Ribeirão Preto.
The good performance of the IERP indicator in the discrimination of different socioeconomic strata allows its utilization as an independent variable in association studies in the municipality of Ribeirão Preto.
One of the limitations that can be pointed out regarding the use of this indicator refers to its composition. Its application is restricted to populations of urban areas, in view of their peculiarities concerning the acquisition of consumer goods and the heterogeneity of schooling levels; therefore, it is not directly applicable to popula-tions that live in rural areas.
On the other hand, the reduced number of variables in the composition of this indicator, the viability of its utilization, as well as the possibility of inter-regional comparisons, in view of the availability of the refer-ence distributions of the IEN, make this indicator be an alternative in the evaluation of socioeconomic level in epidemiological studies considering individual or clustered research unit.
b Instituto de Pesquisa Econômica Aplicada. PNAD 2008: Primeiras Análises: educação, gênero e migração. Brasília; 2009[cited 2009 Jul 10]. (Comunicado da Presidência, 32). Available from: http://www.ipea.gov.br/sites/000/2/comunicado_presidencia/09_10_07_ComunicaPresi_32_ PNAD2008_educacao.pdf
1. Almeida-Filho N, Kawachi I, Pellegrini Filho A, Dachs NW. Research on Health Inequalities in Latin América and the Caribbean: Bibliometric Analysis (1971-2000)
and Descriptive Content Analysis (1971-1995). Am J
Public Health. 2003;93(12):2037-43. DOI:10.2105/
AJPH.93.12.2037
2. Barros AJD, Victora C. Indicador econômico para o
Brasil baseado no censo demográfi co de 2000. Rev
Saude Publica. 2005;39(4):523-9. DOI:10.1590/
S0034-89102005000400002
3. Barros MBA. A utilização do conceito de classe social nos estudos dos perfi s epidemiológicos: uma proposta.
Rev Saude Publica. 1986;20(4):269-73. DOI:10.1590/
S0034-89101986000400001
4. Jacinto PA, Tejada CAO, Sousa TRV. Efeitos das condições macroeconômicas sobre a saúde no Brasil.
Rev Saude Publica. 2010;44(2):310-7. DOI:10.1590/
S0034-89102010000200011
5. Lombardi C, Bronfman M, Facchini LA, Victora CG, Barros FC, Beria IV, et al. Operacionalização do conceito de classe social em estudos epidemiológicos.
Rev Saude Publica. 1988;22(4):253-65. DOI:10.1590/
S0034-89101988000400001
6. Silva NN. Amostragem Probabilística: um curso introdutório. São Paulo: EDUSP; 2001. REFERENCES
Research fi nanced by Conselho Nacional de Desenvolvimento Científi co e Tecnológico (CNPq) (Announcement CT-30, Process no.: 505622/2004-1).
Study presented in the 18th World Epidemiology Congress and 7th Brazilian Epidemiology Congress, in Porto Alegre, Southern Brazil 2008.