Appetite-related hormone levels in obese
women with and without binge
eating behavior
Hormônios reguladores do apetite em
mulheres obesas com e sem
compulsão alimentar
Paula Paraguassú BRANDÃO1
Érica Patrícia GARCIA-SOUZA¹ Fabiana Alves NEVES¹
Mário José dos Santos PEREIRA¹ Rosely SICHIERI2
Aníbal Sanchez MOURA¹
A B S T R A C T
Objective
The aim of this study was to evaluate serum levels of appetite-related hormones (peptide YY3-36, total ghrelin, leptin and insulin) before and after consumption of a meal in obese women with and without binge eating episodes and normal weight women.
Methods
Twenty-five women aged 32-50 years were invited to participate in this study, including 9 normal weight women without binge eating episodes (20-25kg/m2, group 1), 9 obese women with binge eating episodes
(u30kg/m2, group 2), and 7 obese women without binge eating episodes (group 3). Four blood samples were
collected from each participant, one being 60 minutes before and three being 15, 45 and 90 minutes after a meal. The composition of the meal was 55% carbohydrates, 15% protein and 30% lipids.
Results
Group 3 presented increased HOMA-IR (M=2.5, SD=1.04) when compared with group 1 (M=1.5, SD=0.53) and group 2 (M=1.8, SD=0.58), p=0.04. Body mass index (p<0.0001), leptin (p<0.0001) and insulin (p=0.01) were higher in group 3 than in the other groups before and after the meal. Additionally, total ghrelin (p=0.003)
1Universidade do Estado do Rio de Janeiro, Instituto de Biologia, Departamento de Ciências Fisiológicas, Laboratório de Fisiologia da Nutrição e do Desenvolvimento. Av. 28 de Setembro 87, Fundos, Vl. Isabel, 20551-030, Rio de Janeiro, RJ, Brasil. Correspondência para/Correspondence to: A.S. MOURA. E-mail: <[email protected]>.
and PYY3-36 (p=0.02) levels were lower in group 2 than in the other groups before and after the meal. After adjustment for body mass index, only the lower PYY3-36 level of group 2 remained statistically different from the other groups (p=0.01).
Conclusion
Our study suggests that lower levels of PYY 3-36 are associated with binge eating in obese women.
Indexing terms: Ghrelin. Insulin. Obesity. PYY 3-36. Binge-eating disorder.
R E S U M O
Objetivo
O objetivo deste estudo foi avaliar, antes e após a refeição, as concentrações séricas de hormônios ligados ao controle do apetite (peptídeo YY3-36, grelina total, leptina e insulina) em mulheres obesas com e sem episódios de compulsão alimentar e compará-las às mulheres de peso normal.
Métodos
Vinte e cinco mulheres com idade entre 32 e 50 anos foram convidadas a participar deste estudo, incluindo 9 mulheres com peso normal (20-25kg/m2) sem episódios de compulsão alimentar (grupo 1), 9 mulheres obesas (u30 kg/m2) com episódios de compulsão alimentar (grupo 2) e 7 mulheres obesas sem episódios de compulsão alimentar (grupo 3). Foram coletadas quatro amostras de sangue pós-prandiais a 60 minutos (1 hora antes), bem como 15, 45 e 90 minutos após uma refeição composta de 55% de carboidratos, 15% de proteínas e 30% de lipídeos.
Resultados
O maior HOMA-IR foi observado no grupo 3 (M=2,5, DP=1,04) quando comparado ao grupo 1 (M=1,5, DP=0,53) e ao grupo 2 (M=1,8, DP=0,58), p=0,04. O índice de massa corporal (p<0,0001), a leptina (p<0,0001) e a insulina (p=0,01) foram maiores no grupo 3 antes e após a refeição. A grelina total (p=0,003) e o PYY3-36 (p=0,02) foram menores no grupo 2 antes e após a refeição. Após o ajuste do índice de massa corporal, apenas a baixa concentração de PYY3-36 no grupo 2 manteve-se estatisticamente diferente entre os grupos (p=0,01).
Conclusão
Este estudo sugere que níveis baixos do PYY-3-36 estejam associados à compulsão alimentar em mulheres obesas.
Termos de indexação: Grelina. Insulina.Obesidade. PYY 3-36. Transtorno de compulsão alimentar.
I N T R O D U C T I O N
Binge Eating Disorder (BED) is considered an important risk factor for obesity and also for the discontinuation of obesity treatment1. According
to the fourth edition of the Diagnostic and Statistical Manual of Mental Disorders (DSM-IV)2,
Binge Eating (BE) is characterized by consuming large amounts of food within a limited period of time while being less capable of controlling the episodes.
Although the prevalence of BED diagnoses in the general population is low, isolated episodes of BE are more commonly observed in overweight
individuals3, affecting between 30% and 70% of
the overweight population4. In a population-based
study conducted in the city of Rio de Janeiro, 20.6% of the women reported having had BE episodes in the past 6 months and 11.5% presented regular BE episodes (twice a week or more). Also, there was a statistically significant association between binge eating episodes and Body Mass Index (BMI) and self-rated health5,6. In
this context, Binge Eating Episodes (BEE) are commonly reported by obese individuals seeking weight-loss treatment3.
glucose metabolism7,8. It has been hypothesized
that people with BEE have different hormonal mechanisms that control hunger and satiety in eating behavior when compared with non-binge eaters9,10. Accordingly, there are a number of
potential mechanisms by which eating disorders could affect appetite, and thus, it is important to understand how hormones (such as insulin, ghrelin, leptin and PYY3-36) modulate eating behavior8,9. Likewise, it has been suggested that
changes in the level or action of hormones over time leads to a disrupted ability of maintaining normal eating behavior10.
The hormone insulin has a central role in regulating energy and glucose metabolism in the body11. With its anabolic effects, insulin increases
glucose uptake and decreases blood glucose, acting as an appetite stimulant. Insulin also interferes with the secretion of entero-hormones, such as glucagon-like peptide (GLP-1), which acts by inhibiting gastric emptying and thus promotes a longer sensation of being full12. Increased insulin
and leptin levels are positively correlated with higher body mass indices and the presence of increased abdominal fat, evidenced by increased waist circumference13. Although leptin is a
circulating signal that reduces appetite, in general, obese people have high circulating levels of leptin but do not really feel satiety after eating14. This
lack of satiety is likely the result of desensitization to leptin, a phenomenon often referred to as leptin resistance. This phenomenon occurs by at least two distinct mechanisms: saturable transport of leptin across the blood-brain barrier and abnormalities in the extent of leptin receptor activation and/or signal transduction15.
In addition to insulin and leptin, gut-derived peptides, such as ghrelin and peptide YY3-36 (PYY3-36) also have an important role in the modulation of food intake. Ghrelin, a novel acylated 28-amino acid peptide, also stimulates food intake, and when injected, it strongly stimulates food intake. In humans, ghrelin peaks before meals, suggesting its role as a hunger signal16. Ghrelin inhibits insulin release, elevates
blood glucose, stimulates food intake, and increases adiposity17.
In contrast to ghrelin action, recent work has shown that PYY3-36 in physiological levels inhibits appetite in the fasted state. Differently, obese people have low serum levels of PYY3-36, suggesting that this peptide deficiency may contribute to the pathogenesis of obesity18. In fact,
serum levels of the hormone PYY3-36 were found to be significantly lower in obese patients from the binge group than in those of the non-binge groups.
Thus, the aim of this study was to evaluate serum levels of the hormones that are linked with the control of hunger and satiety (PYY3-36, total ghrelin, leptin and insulin) both before and after consumption of a meal in obese women that have or not BEE, and to compare these values with those of Normal Weight Women (NWW). The hypothesis is that there would be significant differences in the selected appetite hormones (peptide YY3-36, total ghrelin, leptin and insulin) between NWW and obese binge eaters and non-binge eaters in both the fasting preprandial state and in the postprandial state.
M E T H O D S
Subjects and design
Women without any evidence of disease and not taking any medications, aged 30 to 50 years, who visited the gynecology room of Piquet Carneiro Policlinic at the Universidade do Estado do Rio de Janeiro (UERJ) in 2007, were invited to participate in this study by telephone calls and letters. In the first visit, all participants answered a questionnaire on BEE and compensatory weight loss methods and were measured and weighed for BMI determination5. The questions were
formulated based on the Structured Clinical Interview for DSM-IV-SCID-I/P, using the diagnoses of BN and BED as references5.
were classified as binge eaters if they scored 18 or more points on the BES1,19. Women with the
following diagnoses were excluded: hypothyroidism, hyperthyroidism, diabetes, hypertension and polycystic ovary syndrome. Women who were pregnant, breastfeeding or menopausal were also excluded. After determining BMI and presence of BEE, 60 women (20 for each group) were invited to participate in the study and were assigned to one of the following groups: normal weight without BEE (BMI of 20-25kg/m2), obese with BEE (BMI u30kg/m2) and
obese without BEE.
All individuals signed an informed consent form in the first visit and were invited to return to the clinic in one week (second visit) in order to answer a 24-hour dietary recall and to receive dietary counseling. Only 34 individuals that met the inclusion criteria returned, and of those, 25 completed the protocol and composed the 3 groups of study: 9 normal weight without BEE (group 1), 9 obese with BEE (group 2) and 7 obese without BEE (group 3). All participants fasted for 12 hours and abstained from exercise and drinking alcohol for 24 hours prior to their third visit (experimental session). The study was done at Piquet Carneiro Policlinic at the Universidade Estadual do Rio de Janeiro after the participants signed the informed consent form. This study was approved by the Universidade do Estado do Rio de Janeiro Ethics Committee, protocol number 034/2005.
Nutritional counseling was based on the energy and nutrient requirements of each group. They were calculated according to the recommended daily intake20 in order to maintain
body weight. Energy requirement was estimated by the Food and Agriculture Organization (FAO) and World Health Organization (WHO) equations to be 2,129 kcal per day for the normal weight group, 2,453 kcal per day for the obese BEE group and 2,518 kcal per day for the obese non-BEE group21. All participants received nutritional
counseling for a diet composed of six meals per day consisting of 55% carbohydrates, 15% protein and 30% fats to be eaten over the month prior
to the day of the experiment. On the day of the experiment, they received identical portions of the same foods according to their needs, and they started the meal at the same time. For breakfast, all patients had 200 grams of a meal containing: bread, white cheese and milk with coffee sweetened with a sucralose-based sweetener. At lunch, each subject was offered a meal containing 500 grams of rice, beans, grilled chicken breast, lettuce, tomato and onion.
Each group participated in an experimental session (third visit) starting at 8:00 in the morning. Eating speed was quantified by dividing the amount of food ingested at breakfast and lunch (grams) by the amount of time spent to eat both meals (minutes). The amount of time spent consuming the meals (minutes) was evaluated when the participants ate breakfast (200 grams) and lunch (500 grams). Blood samples were collected during fasting and at the following times: -60 minutes (1 hour before lunch) and 15, 45 and 90 minutes after lunch. Vacuum tubes containing the anticoagulant Ethylenediaminete-Traacetic Acid (EDTA) were used during blood collection to obtain plasma blood samples. Upon arrival at the laboratory, samples were immediately centrifuged at 3000 rpm for 10 minutes at 4°C. They were then divided into aliquots for blood glucose determination. The samples were stored at -70°C for later evaluation of hormone levels.
Determining blood glucose and hormone levels
measured by Radioimmunoassay (RIA) using commercial kits (Linco Research, St Charles, MO). Homeostasis Model Assessment of Insulin Resistance Index (HOMA-IR) was obtained by fasting plasma glucose (mg/dL) and fasting insulin (PIU/mL) levels22. Fasting glucose levels were
considered normal when glucose = 70-99mg/dL and HOMA-IR22 was considered normal when
<2.5.
Data analysis
Statistical analysis were conducted using the Software Statistical Analysis System (SAS) version 9.1. Baseline differences were assessed using Analysis of Variance (ANOVA). Analysis of repeated measurements was conducted using mixed effects (procedure proc mixed in SAS), testing the differences between groups and over time. These models for analysis of mixed effects sought to find a pattern of behavior using repeated measures over time and included an estimation of effects common to individuals of the same group. Due to the differences in BMI (particularly between obese binge eaters and non-binge eaters), differences were also adjusted for BMI.
R E S U L T S
The age of the participants ranged from 32 to 50 years; 52% were white, 28% had
completed higher education and all of them had completed four years of college. Group 3 had higher BMI values (p<0.0001) than the other groups, as a consequence of higher weight values (p<0.0001) and lower height values (p=0.04) (Table 1).
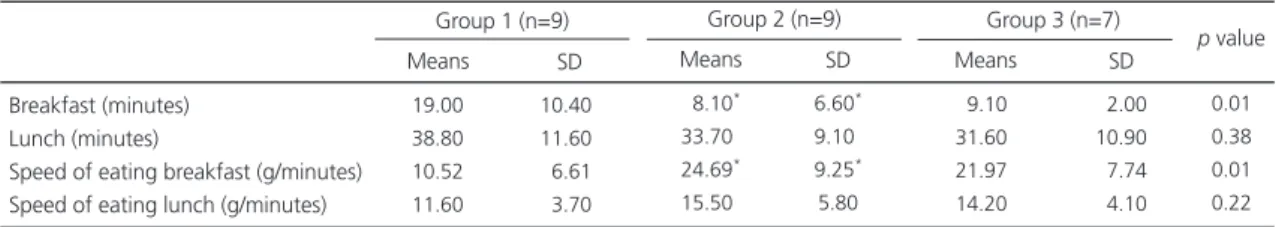
The amount of food consumed (in grams) during breakfast (200g) and lunch (500g) on the experimental day was the same for all groups (p>0.05), but the ratio between the amount of food ingested and the time taken to consume it (referred to as eating speed) was greater in groups 2 and 3 during breakfast than in group 1 (Table 2).
Fasting plasma glucose (mg/dL) and fasting insulin (PIU/mL) measurements obtained by HOMA-IR were expressed as Mean (M), Standard Deviation (SD). Fasting insulin level was higher in group 3 than in the other groups (group 1: M=63.4, SD=18.0; group 2: M=75.1, SD=13.3; group 3: M=100.7, SD=35.6; p=0.01). Fasting plasma glucose did not vary among the groups before breakfast (group 1: M=97.6, SD=14.4; group 2: M=98.4, SD=20.3; group 3: M=102.6, SD=16.7; p>0.05). A significant increase in HOMA-IR was observed in group 3 when compared with the other groups (group 1: M=1.5, SD=0.53; group 2: M=1.8, SD= 0.58; group 3: M=2.5, SD=1.04; p=0.04).
In order to explore whether the differing levels of PYY3-36, insulin, ghrelin and leptin in
Table 1. Anthropometric characteristics and Binge Eating Scale scores of the Piquet Carneiro Policlinic participants in 2007. Rio de Ja-neiro (RJ), Brazil.
Weight (kg) Height (m) BMI (kg/m2)
Waist circumference (cm) Hip circumference (cm) Waist to hip ratio BES scores 057.70 156.10 023.60 077.60 099.50 000.77 005.80 5.00 4.60 1.00 4.00 5.90 0.10 3.30 <0.0001 <0.0400 <0.0001 <0.0001 <0.0001 <0.0600 <0.0001 Means SD
Group 1 (n=9)
084.90*
162.30*
032.30*
095.80*
113.90*
000.82*
025.60*
4.70 4.50 2.10 6.30 4.10 0.10 8.10 Means SD
Group 2 (n=9)
088.60*
159.40*
034.90*
097.70*
117.90*
000.83*
009.20*
7.50 4.80 3.90 7.60 7.70 0.05 3.40 Means SD
Group 3 (n=7)
p value
Notes: Group 1: normal weight women; Group 2: obese, female binge eaters; Group 3: obese, female non-binge eaters. One-way ANOVA followed by Bonferroni Test: *p value<0.05, statistically different group. Reference values: BES u17 = normal; 18-26 = moderate;
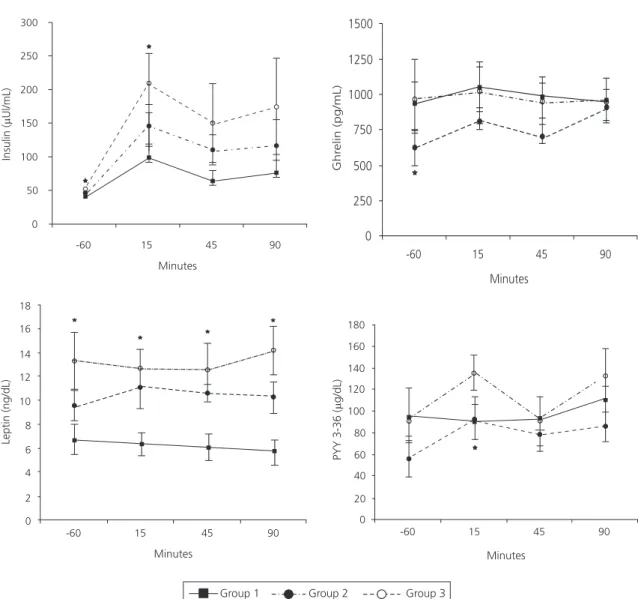
the participants from each group could be accounted for by differences in BMI values, the models were adjusted for BMI and treated as a continuous variable. Before adjustment for BMI, there were significantly higher levels of plasma insulin in group 3 than in the other groups over time (p<0.0001). Group 3 had higher insulin levels when compared with group 1 and group 2 (p=0.01) before adjustment for BMI. Plasma insulin levels of all groups increased soon after the ingestion of lunch and decreased thereafter; however, group 3 had higher insulin levels one hour before lunch (p=0.002) and 15 minutes after lunch (p=0.01) than the other groups before adjustment for BMI (Figure 1). When plasma insulin levels were adjusted for BMI, group 3 still had higher levels than the other groups over time (p<0.0001). However, there was no statistical difference in insulin levels among groups after adjustment for BMI.
Compared with the other groups before adjustment for BMI, plasma leptin levels were higher in group 3 over time (p<0.0001); however, levels over time were not significantly different (p=0.90) among the groups. Group 3 had higher leptin levels one hour before lunch (p=0.002) as well as 15 (p=0.0005), 45 (p=0.0005) and 90 minutes after lunch (p<0.0001) than the other groups before adjustment for BMI (Figure 1). When the values of leptin were adjusted for BMI, the statistical differences among the groups (p=0.30) and over time (p=0.95) disappeared.
Total ghrelin levels were lower in group 2 after food intake (p=0.003) than in groups 1 and
Table 2. Eating speed of the Piquet Carneiro Policlinic participants in 2007. Rio de Janeiro (RJ), Brazil.
Breakfast (minutes) Lunch (minutes)
Speed of eating breakfast (g/minutes) Speed of eating lunch (g/minutes)
19.00 38.80 10.52 11.60
10.40 11.60
06.61
03.70
0
0.01 0.38 0.01 0.22
Means SD
Group 1 (n=9)
08.10*
33.70*
24.69*
15.50*
6.60*
9.10*
9.25*
5.80
Means SD
Group 2 (n=9)
09.10 31.60 21.97 14.20
02.00 10.90
07.74
04.10
Means SD
Group 3 (n=7)
p value
Notes: Group 1: normal weight women; Group 2: obese, female binge eaters; Group 3: obese, female non-binge eaters. One-way ANOVA followed by Bonferroni Test: *p value<0.05, statistically different group. SD: standard deviation; BES: binge eating scale; BMI: body mass index.
3 before adjustment for BMI. After lunch, all groups had similar ghrelin behavior over time (p=0.35). After the post-hoc test, the statistical difference before adjustment for BMI was observed only one hour before food intake (p=0.04). After adjustment for BMI, the difference in ghrelin levels became insignificant (p=0.30) among the groups, and values over time remained similar (p=0.35).
PYY3-36 values before adjustment for BMI increased over time in all groups (p=0.03), and the PYY3-36 levels were lower in group 2 after lunch (p=0.02) than in groups 1 and 3. Before adjustment for BMI, after a post hoc test, PYY3-36 level in group 2 was lower only 15 minutes after lunch when compared with the other groups, p=0.04 (Figure 1). After adjustment for BMI, levels of PYY3-36 decreased in group 2. These differences remained statistically significant over time (p=0.01), and the difference increased among groups (p=0.01).
D I S C U S S I O N
The present study compared appetite-related hormones in obese women with and without BEE with normal weight women allowing hormonal differences related specifically to BE behavior to be evaluated. As previously described, BE is frequently associated with obesity in women19. The amount of food consumed during
2. Lower stature in obese women26 has previously
been associated with higher adiposity (as indicated by BMI values) and greater waist circumference. Because of the higher BMI of group 3, hormones that can be influenced by BMI and are associated with energy balance and adiposity, such as leptin, total ghrelin, PYY 3-36 and insulin, were adjusted for BMI.
For leptin and insulin, our data is in agreement with the findings of others where the
Figure 1. Appetite-related hormone levels in group 1 (solid line, n=9, normal weight women) versus group 2 (black broken line, n=9, obese, female binge eaters) and group 3 (white broken line, n=7, obese, female non-binge eaters) before and after lunch. Participants visited the Piquet Carneiro Policlinic in 2007. Rio de Janeiro (RJ), Brazil.
Note: Differences before adjustment for BMI in leptin (ng/dL) (p<0.0001) and insulin (PIU/mL) (p=0.01) were higher in group 3; Total ghrelin (pg/mL) (p=0.003) and PYY3-36 (Pg/dL) (p=0.02) levels were lower in group 2. Only PYY3-36 (p=0.01) levels remained statistically different between the groups after adjustment for body mass index. *Statistical difference after pos hoc test in different times before and after the meal.
obese individuals may differ from that of normal weight individuals. Eating frequency and type of nutrients in the meal are associated with metabolic changes23,24 and glycemic homeostasis25. Therefore,
the same food was offered on the experimental day to the participants, and also the same quantity of food, in order to avoid acute release of any appetite-related hormone.
In our study, the mean height of the women in group 3 was smaller than that of group
0 50 100 150 200 250 300
-60 15 45 90
Minutes
0 250 500 750 1000 1250 1500
-60 15 45 90
Minutes
Ghr
elin (pg/mL)
0 2 4 6 8 10 12 14 16 18
-60 15 45 90
Minutes
Leptin (ng/dL)
0 20 40 60 80 100 120 140 160 180
-60 15 45 90
Minutes
results indicate that serum leptin levels of groups 2 and 3 do not differ, and being overweight is significantly related to obesity-related insulin resistance7,27. After adjustment for BMI, there was
no difference in leptin and insulin level among the groups. These data suggest that differences in insulin and leptin levels before adjustment may be influenced by differences in BMI and adiposity. The multiple effects of insulin and leptin on energy homeostasis depend upon interaction with key hypothalamic nuclei and peptides that regulate energy balance. In normal weight individuals, leptin and insulin increase the expression of the anorexic peptide D-MSH and decrease the expression of AgRP, thereby inducing a decrease in food intake and an increase in energy expenditure13,28. On the other hand, the higher
adiposity observed in groups 2 and 3 had greater leptin release, which may create a proinflammatory environment that decreases insulin sensitivity. In our study, group 2 did not present insulin resistance.
Gut-derived peptides, such as ghrelin and PYY3-36, that regulate the initiation and termination of meals could potentially play a role in the altered eating behavior of patients with eating disorders16,18. In normal weight individuals,
ghrelin decreases the expression of the anorexic peptide D-MSH and increases the expression of AgRP in the hypothalamus, thus inducing an increase in food intake and decrease in energy expenditure, unlike insulin, PYY3-36, and leptin29.
The anti-satiety properties of ghrelin may be due to its biological effects of increasing gastrointestinal motility and decreasing insulin release30,31. In
adults, plasma ghrelin levels increase before a meal and decrease within 1 hour of eating32.
In normal weight, non-binge eaters, studies have shown that ghrelin is associated with increased hunger and stimulation of food intake and low ghrelin levels during fasting. However, studies on eating disorders show that binge-eaters have low ghrelin levels and increased hunger during fasting and non-fasting states, and thus
these features could be associated with abnormal eating behavior30,31.
Ghrelin levels were also significantly lower in both normal weight and obese binge eaters as well as in obese non-binge female eaters in a study conducted in Italy10. In addition, our results were
in accordance with Geliebter et al.18, whose
findings showed that lower plasma ghrelin levels exist in obese binge eaters before and after a meal when compared with obese non-binge eaters. Low plasma ghrelin in obese binge eaters as well as in obese non-binge eaters when compared with normal weight participants may represent a secondary change that aims to counteract their positive energy imbalance18.
The data of the present study suggests that there is a hormonal change in a specific subgroup of the obese group. These participants may be characterized as experiencing less satiety than others within the obesity group. Thus, the reduced serum levels of PYY3-36 found specifically in group 2 may be a manifestation of a particular hormonal abnormality in these patients. Regardless of the existing controversies in the literature about the prominence of one hormone or the other, mainly surrounding the effect of ghrelin on PYY3-36 in this process, the data presented here is in agreement with the findings of other studies in which an association between PYY3-36 reduction and obesity was established18,33.
For instance, it has recently been shown that low serum levels of PYY3-36 stimulate food intake and adipogenesis, and that in obese non-binge eaters, the lower level of PYY3-36 leads to a higher energy intake and a feeling of hunger33.
Even in normal and obese patients receiving PYY3-36 two hours before the intake of a meal and after a rest period of 120 minutes, those who received the peptide ate on average one-third less than those in the control group18.
Finally, another study has demonstrated that the occurrence of gastric distension caused by the ingestion of a liquid diet could change the levels34 of PYY3-36. In the present study, there
consumed by each group. This may reduce the possible influence of different gastric distensions and PYY3-36 levels among the groups. A recent study indicated that significant differences in both pre- and selected postprandial levels of leptin, ghrelin, adiponectin and insulin exist between normal weight and severely obese women35.
Nevertheless, the present data did not allow ruling out the hypothesis that once individuals become binge eaters, the binge eating behavior may change the appetite-related hormones and contribute to new energy imbalance and weight gain patterns. Understanding the relationship between appetite-related hormones across obesity and eating disorders, such as binge eating, may provide insight for prospective trials, which might be instrumental in understanding the pathophysiology involved, and perhaps, in developing treatments for overweight and obese individuals. The most relevant finding of this study was the lower PYY3-36 levels before and after lunch of group 2 compared with group 3, in accordance with the initial hypothesis that obese individuals with and without eating disorders release different amounts of appetite-related hormones. Thus, the present data shows that, in binge eaters, the satiation process cannot be explained by the same pathway presented by normal weight individuals without eating disorders. More studies are needed for the development of future therapies and new dietary advice that prevents and treats obesity and eating disorders.
C O N C L U S I O N
In conclusion, the difference in food intake speed found by comparing groups 2 and 3 cannot be explained by the same mechanism. As hypothesized, there were significant differences in selected appetite hormones between normal weight and obese binge eaters and non-binge eaters in the preprandial and postprandial states, as indicated by lower PYY3-36 levels in group 2.
Improving our understanding of the biochemical mechanisms accounting for the different levels of appetite-related hormones in individuals with different weights and with or without eating disorders should aid in the development of future therapies to prevent and treat obesity.
A C K N O W L E D G M E N T S
The authors thank the Brazilian National Council of Research, Ministry of Science and Technology and Ministry of Health for sponsoring the study (MCT/CNPq/MS#402168/2005-4).
C O N T R I B U T I O N S
P.P. BRANDÃO, R. SICHIERI and A.S. MOURA established the methods, including measurements, questionnaires and procedures. P.P. BRANDÃO, E.P. GARCIA-SOUZA, F.A. NEVES and M.J.S. PEREIRA were involved in blood collection and hormone measurements. P.P BRANDÃO, E.P. GARCIA-SOUZA, R.SICHIERI and A.S. MOURA participated in the writing of the paper, provided comments on the drafts and approved the final version.
R E F E R E N C E S
1. Gormally J, Black S, Daston S, Rardin D. The assessment of binge eating severity among obese persons. Addict Behav. 1982; 7(1):47-55. doi: 10.1 016/0306-4603(82)90024-7.
2. Diagnostic and statistical manual of mental disorders. 4th ed. Washington (DC): American
Psychiatric Association; 1994 [cited 2008 Apr. 23]. Available from: <http://www.psych.org/MainMenu/ Research/DSMIV/DSMIVTR.aspx>.
3. Siqueira KS, Appolinario JC, Sichieri R. Relationship between binge-eating episodes and self-perception of body weight in a nonclinical sample of five Brazilian cities. Rev Bras Psiquiatr. 2005; 27(4): 290-294. doi: 10.1590/S1516-44462005000400 007.
4. de Zwaan M. Binge eating disorder and obesity. Int J Obes Relat Metab Disord. 2001; 25(1):S51-S55. doi: 10.1038/sj.ijo.0801699.
in a Brazilian probability sample of midlife women. Int J Eat Disord. 2008; 41(5):471-478. doi:10.1002/ eat.20530.
6. Freitas SR, Lopes CS, Appolinario JC, Coutinho W. The assessment of binge eating disorder in obese women: a comparison of the binge eating scale with the structured clinical interview for the DSM-IV. Eat Behav. 2006; 7(3):282-89. doi: 10.10 16/j.eatbeh.2005.09.002.
7. Iacobellis G, Leonetti F. Epicardial adipose tissue and insulin resistance in obese subjects. J Clin Endocrinol Metab. 2005; 90(11):6300-2. doi:10.1 210/jc.2005-1087.
8. Pimentel GD, Mota JF, Oyama LM. Oxintomodulina e obesidade. Rev Nutr. 2009; 22(5): 121-9. doi: 10.15 90/S1415-52732009000500013.
9. Jimerson DC, Wolfe BE. Neuropeptides in eating disorders. CNS Spectr [Internet]. 2004 [cited May 25]; 9(7):516-22. Available from: <http://www. ncbi.nlm.nih.gov/pubmed/15208511>.
10. Monteleone P, DiLieto A, Castaldo E, Maj M. Leptin functioning in eating disorders. CNS Spectr [Internet]. 2004 [cited 2008 May 12]; 9(7):523-9. Available from: <http://www.ncbi.nlm.nih.gov/ pubmed/15208512>.
11. Schwartz MW, Morton GJ. Obesity: keeping hunger at bay. Nature. 2002; 418(6898):595-7. doi:10.10 38/418595a.
12. Monteleone P, Di Lieto A, Tortorella A, Longobardi N, Maj M. Circulating leptin in patients with anorexia nervosa, bulimia nervosa or binge-eating disorder: relationship to body weight, eating patterns, psychopathology and endocrine changes. Psychiatry Res. 2000; 94(2):121-9. doi:10.1016/S01 65-1781(00)00144-X.
13. Barrios Ospino Y, Diaz N, Meertens L, Naddaf G, Solano L, Fernandez M, et al. Relation between leptin serun with weight and body fat distribution in postmenopausal women. Nutr Hosp. 2010; 25(1):80-84. doi:10.3305/nh.2010.25.1.4273. 14. Magkos F, Fabbrini E, Mohammed BS, Patterson
BW, Klein S. Increased whole-body adiposity without a concomitant increase in liver fat is not associated with augmented metabolic dysfunction. Obesity. 2010; 18(8):1510-5. doi: 10.1038/oby.20 10.90.
15. Cambuli VM, Musiu MC, Incani M, Paderi M, Serpe R, Marras V, et al. Assessment of adiponectin and leptin as biomarkers of positive metabolic outcomes after lifestyle intervention in overweight and obese children. J Clin Endocrinol Metab. 2008; 93(8): 3051-7. doi:10.1210/jc.2008-0476.
16. Kojima S, Nakahara T, Nagai N, Muranaga T, Tanaka M, Yasuhara D, et al. Altered ghrelin and peptide
YY responses to meals in bulimia nervosa. Clin Endocrinol (Oxford). 2005; 62(1):74-8. doi: 10.1111/ j.1 365-2265.2004.02176.x.
17. Tschop M, Wawarta R, Riepl RL, Friedrich S, Bidlingmaier M, Landgraf R, et al. Post-prandial decrease of circulating human ghrelin levels. J Endocrinol Invest [Internet]. 2001 [cited 2008 May 27]; 24(6):RC19-21. Available from: <http://www. ncbi.nlm.nih.gov/pubmed/11434675>.
18. Geliebter A, Hashim SA, Gluck ME. Appetite-related gut peptides, ghrelin, PYY, and GLP-1 in obese women with and without binge eating disorder (BED). Physiol Behav. 2008; 94(5):696-9. doi:10.10 16/j.physbeh.2008.04.013.
19. Freitas SR, Lopes CS, Coutinho W, Appolinário JC. Translation and adaptation into Portuguese of the Binge-Eating Scale. Rev Bras Psiquiatr. 2001; 23(4): 215-20. doi: 10.1590/S1516-44462001000400 008.
20. National Academy of Sciences. Institute of Medicine. Food and Nutrition Board. Dietary references intakes for energy, carbohydrate, fiber, fat, fatty acids, cholesterol, protein and amino acids. Washington (DC): National Academic Press; 2005 [cited 2008 May 29]. Available from: <http:// www.nap.edu/openbook.php?isbn=030908 5373>.
21. Organización Mundial de la Salud. Necesidades de energía y de proteínas: informe de una Reunión Consultiva Conjunta FAO/OMS/UNU de Expertos. Genebra: Organización Mundial de la Salud; 1985. p.220. [cited 2008 May 15]. Available from: <http:// whqlibdoc.who.int/trs/WHO_TRS_724_%28part 1%29_spa.pdf>.
22. Matthews DR, Hosker JP, Rudenski AS, Naylor BA, Treacher DF, Turner RC. Homeostasis model assessment: insulin resistance and beta-cell function from fasting plasma glucose and insulin concentrations in man. Diabetologia. 1985; 28(7): 412-9. doi:10.1007/bf00280883.
23. Boggiano MM, Artiga AI, Pritchett CE, Chandler-Laney PC, Smith ML, Eldridge AJ. High intake of palatable food predicts binge-eating independent of susceptibility to obesity: an animal model of normal weight vs obese binge-eating and obesity with and without binge-eating. Int J Obesity. 2007; 31(9):1357-67. doi:10.1038/sj.ijo.0803614.
24. Kanno P, Rabelo M, Melo GF, Giavoni A. Discre-pâncias na imagem corporal e na dieta de obesos. Rev Nutr. 2008; 21(4):423-30. doi:10.1590/S141 5-52732008000400006.
2003; 19(3): 253-6. doi:10.1016/S0899-9007(02) 00850-X.
26. Velasquez-Melendez G, Silveira EA, Allencastro-Souza P, Kac G. Relationship between sitting-height-to-stature ratio and adiposity in Brazilian women. Am J Hum Biol. 2005; 17(5):646-53. doi: 10.1002/ajhb.20423.
27. Karhunen L, Haffner S, Lappalainen R, Turpeinen A, Miettinen H, Uusitupa M. Serum leptin and short-term regulation of eating in obese women. Clin Sci (Lond) [Internet]. 1997 [ cited 2008 May 21]; 92(6): 573-578. Available from: <http://www. ncbi.nlm.nih.gov/pubmed/9205417>.
28. Stefanyk LE, Dyck DJ. The interaction between adipokines, diet and exercise on muscle insulin sensitivity. Curr Opin Clin Nutr Metab Care. 2010; 13(3):255-9. doi: 10.1097/MCO.0b013e328338 236e.
29. Murphy KG, Bloom SR. Gut hormones in the control of appetite. Exp Physiol. 2004; 89(5): 507-16. doi: 10.1113/expphysiol.2004.027789 30. Beckman LM, Beckman TR, Earthman CP. Changes
in gastrointestinal hormones and leptin after Roux-en-Y gastric bypass procedure: a review. J Am Diet Assoc. 2009; 110(4):571-84. doi:10.1016/j.jada.2 009.12.023.
31. Poykko SM, Kellokoski E, Horkko S, Kauma H, Kesaniemi YA, Ukkola O. Low plasma ghrelin is associated with insulin resistance, hypertension,
and the prevalence of type 2 diabetes. Diabetes. 2003; 52(10):2546-53. doi: 10.2337/diabetes.52.1 0.2546.
32. Holdstock C, Engstrom BE, Ohrvall M, Lind L, Sundbom M, Karlsson FA. Ghrelin and adipose tissue regulatory peptides: effect of gastric bypass surgery in obese humans. J Clin Endocrinol Metab. 2003; 88(7):3177-3183. doi:10.1210/jc.2002-02 1734.
33. Batterham RL, Cohen MA, Ellis SM, Le Roux CW, Withers DJ, Frost GS, et al. Inhibition of food intake in obese subjects by peptide YY3-36. N Engl J Med. 2003; 349 (10):941-8. doi: 10.1056/NEJMoa030 204.
34. Vazquez Roque MI, Camilleri M, Stephens DA, Jensen MD, Burton DD, Baxter KL, et al. Gastric sensorimotor functions and hormone profile in normal weight, overweight, and obese people. Gastroenterology. 2006; 131(6):1717-24. doi:10.1 053/j.gastro.2006.10.025.
35. Carlson JJ, Turpin AA, Wiebke G, Hunt SC, Adams TD. Pre and post-prandial appetite hormone levels in normal weight and severely obese women. Nutr Metab (Lond). 2009; 6(32):1-8. doi:10.1186/174 3-7075-6-32.
Received on: 6/7/2010