Abstract
Objective: To conduct an evaluation of an educational program based on the health promotion model (HPM) and stages of change to improve physical activity (PA) behavior among Iranian adolescents.
Methods: This was a group randomized controlled trial with 165 participants in two groups (intervention/ control). Data were collected using self-reported questionnaires based upon HPM constructs (beneits and barriers of action, self-eficacy, activity-related affect, interpersonal inluences, and situational inluences). The stages of change scale was used to select eligible participants (were placed on precontemplation, contemplation, or preparation stages) and to assess the trend. After collecting baseline data, the intervention was administered to the participants and follow-up data was collected 3 months after intervention.
Results: In all, 88 males and 77 females with a mean age of 13.99±0.4 participated in the study. The differences in all HPM constructs, except activity-related affect and social inluences, were signiicant (p < 0.01) between baseline and follow-up measurements. Adolescents in the intervention as compared to the control group were placed in action (70%) or preparation (30%) stages at follow-up. Multiple regression analysis revealed that competing preferences, social norms, role models, (p < 0.001), and commitment to action plan can signiicantly predict PA behavior. The model accounted for 22.5% of the variance in PA.
Conclusions: The results suggest that educational interventions based on stages of change can have important implications for improving PA among adolescents in more constructs of HPM.
J Pediatr (Rio J). 2012;88(5):430-8: Health behavior, physical activity, health education, adolescent.
Original article
Copyright © by Sociedade Brasileira de Pediatria430
Introduction
Physical inactivity has been identiied as the fourth
leading risk factor for global mortality causing an estimated
3.2 million deaths around the world annually.1 Patterns
of activity in adulthood are often established during
adolescence,2 and involvement in regular physical activity
(PA) by adolescents provides psychological and physiological
beneits for them.3,4 Studies have shown the adolescents
with higher levels of PA have more healthy diets and normal
weight.5,6 In addition, it reduces both the deterioration of
mobility-related activities7 and the development of secondary
health problems later in life.8
According to the World Health Organization (WHO) recommendation for PA, children and youth aged 5-17 should accumulate at least 60 minutes of moderate- to
A model-based educational intervention
to increase physical activity among Iranian adolescents
Hormoz Sanaeinasab,1 Mohsen Saffari,1 Amir H. Pakpour,2 Mojtaba Nazeri,3 Crystal N. Piper4
1. Assistant professor, Health Education Department, School of Health, Baqiyatallah University of Medical Sciences, Tehran, Iran. 2. Assistant professor, Department of Public Health, Qazvin University of Medical Sciences, Qazvin, Iran.
3. Msc. Health Education Department, School of Health, Baqiyatallah University of Medical Sciences, Tehran, Iran.
4. PhD. Department of Public Health Sciences, College of Health and Human Services, University of North Carolina at Charlotte, Charlotte, North Carolina 28223, USA.
No conflicts of interest declared concerning the publication of this article. Financial support: Baqiyatallah University of Medical Sciences.
Suggested citation: Sanaeinasab H, Saffari M, Pakpour AH, Nazeri M, Piper CN. A model-based educational intervention to increase physical activity among Iranian adolescents. J Pediatr (Rio J). 2012;88(5):430-8.
Manuscript submitted Mar 5 2012, accepted for publication Jun 6 2012.
vigorous-intensity PA daily.9 In Iran, many young people
do not meet the current recommendation. For example, data from the CASPIAN Study indicates that only about
25% of Iranian adolescents engage in suficient moderate-
to vigorous-intensity PA per day.10 Also the prevalence of
overweight and obese children has increased considerably
in recent decades, affecting about one third of youth.11
Therefore, effective interventions to increase PA are needed to prevent disease and improve health in adolescents.
Theory-based interventions have been associated with larger and longer-term effects than those without
an explicit basis in theory.12,13 Moreover, applications of
theory or model-based interventions present an opportunity
to test whether an intervention successfully modiies the
hypothesized determinants, and if these changes mediate
behavior change effects.14
The stages of change construct from the Transtheoretical Model (TTM) allows persons to be assessed for their readiness
to change a particular behavior such as PA.14,15
Another model to address health behaviors is the health promotion model (HPM). The model formulated by Pender
includes three groups of inluencing factors: individual characteristics and experiences, behavior-speciic cognitions
and affect, and immediate behavioral contingencies.16 The
set of behavior-speciic variables which develops a core of the intervention can be modiied through educational actions. These six variables are: perceived beneits of action, perceived barriers to action, perceived self-eficacy, activity-related affect, interpersonal inluences, and situational inluences.17 “Measuring changes in these variables is
essential to determine if such changes actually result from
the intervention.”18
Therefore, we hypothesized that designing a health education program based on stage of change (SOG) and HPM might affect the PA behavior among adolescents. The present study introduces the development and preliminary test of an educational intervention that used health behavior theoretical bases to enhance PA in adolescents.
Methods
Overall, 165 adolescents aged 13-15 years old were recruited by a cluster-randomized design from all high schools in Khoramabad city. The size of sample was calculated using Cohen tables for sample size estimation
(effect size = 0.3, power = 0.8 and α = 0.05).19 This
grouped controlled educational intervention was conducted from October 2010 to February 2011. We approached four randomized selected high schools in Khoramabad city to solicit their participation in the intervention aimed at enhancing PA. All four high schools agreed to participate in the study. By simple random allocation, two schools were assigned to the control group and the remaining two became the intervention group.
Consenting participants were only included in the study after meeting the following inclusion and exclusion
criteria. The inclusion criteria were: they had no limitations
or restrictions that would prohibit them from engaging in moderate PA as measured by the Physical Activity Readiness
Questionnaire,20 and they consented to participate in
the study. Also a parent or legal guardian of participants signed the informed consent document. The participants should be in the precontemplation, contemplation or in the preparation stages of change. The exclusion criteria
were as follows: planning to leave the geographic area,
having a friend or relative enrolled in the trial (by asking
the participants to answer the question: “Do you have any
friend or relatives at ‘name of the school’?”), and being on the action or maintenance level of the stages of change. The study was approved by the Institutional Review Board at the Baqiyatallah University of Medical Sciences.
Data were collected within individual school settings. Both intervention and control groups’ data were assessed at baseline and at the 5-month follow-up (3 months after the intervention).
Baseline data were collected in October 2010. After this, the intervention schools participated in the educational program, while the control schools continued with their regular school programs. The education program lasted about 2 months (October and November). Subsequent follow-up data collection took place in late February 2011. Data collectors checked for incorrectly completed questionnaires
(i.e., pages or items not illed in), and invited participants
to correct their mistakes or complete the missing items. At baseline, participants in all conditions completed the following measures. All scales except demographics were completed by participants at follow-up.
Demographic variables include: age, grade, gender,
and parents’ education and job ascertained by a one-sheet questionnaire.
Stage of changes scale
This was developed by Kearney et al.21 and has two
questions. In the irst question, participants were asked whether they believed they did suficient sports or PA on a
two-point scale (yes/no). Those who answered “no” were asked to select one of the three options regarding their intention to engage in sports or PA in the future. Those answering “yes” chose between two options that identify action or maintenance stages.
Children’s exercise self-eficacy survey
This was adopted from Garcia et al. study.22 The adopted
scale included eight items with a four-point modiied Likert
Children’s perceived beneits/barriers to exercise questionnaire
The original scale has been developed by Garcia et al.22 The measure contained a nine-item beneits and
10-item barriers subscales using a four-item Likert-type response format. The modiied version of the scale having eight items concerning perceived beneits was used in
our study.23
Interpersonal variables scale
The interpersonal variables scale consisted of three
subscales and was irst developed by Garcia et al.22 and
then modiied in another study.23 The exercise models,
exercise norms, and social support subscales have 12, four, and 24 items, respectively.
Physical activity enjoyment scale
This scale was developed based on Robbins et al.24 For
this study the measure was used to assess activity-related affect (i.e. affections such as hate, discomfort, enjoyment,
etc.). The scale consisted of a four-point Likert scale.
Exercise preference proile
This preference scale was used for measuring immediate
competing demands and preferences. It was developed
by Pender et al.25 The scale has nine items and each
item contains two choices, A and B, and the participant must choose the one they like best (sedentary or active behaviors).
Situational inluences options
This is a self-report questionnaire with 11 items that
was developed by Pender et al.25 The scale asks participants
questions such as, “Which places can you go to play or exercise?” For each item there are two options (Yes or No). “Yes” responses receive 1 and “No” receive 0.
Planning for exercise scale
This scale included 11 items that each had three options (never = 1, sometimes = 2, and often = 3). The scale was
developed by Pender et al.25 and is a measure of commitment
to a plan of action.
Child/adolescent activity log
This log was used to assess PA. The scale was
developed by Garcia et al.26 and was modiied in another
related study.23 The scale has 20 items that requires
participants to recall the activities they participated in the previous day, and the number of minutes spent on each activity.
Weekly physical activity scale
This was developed by researchers and was used to measure the time of PA during the preceding week. This scale requests participants to recall the time (number of minutes per day) that they spent on activities such as jogging, cycling, and other exercises on a weekly basis
whichled to arapid heartbeatandsweating.
The Farsi versions of all scales, except situational
inluences, were available. The backward-forward translation
technique was used to translate the scale. The scale was
then sent to ive experts on health education, and test
development, and their recommendations were used to modify the scale. Thereafter, it was pilot-tested on 25 adolescents, and their viewpoints and understanding of
the items were addressed to assist in developing the inal scales. The internal consistency coeficient for all scales
ranged from 0.76 to 0.85.
After determining the stages of change in the education group by self-reported questionnaires, participants were divided into groups of from six to nine according to their stage
of change. The methods used to incorporate education were:
lecture, focus group discussion, slide presentation, colloquy, video presentation, role playing, and demonstration.
All intervention-adolescents participated in 10 interactive sessions (1-1.5 hours each) over 2 months. Interactive sessions were identical in content at all training sites for the intervention group. Sessions were held in small groups led by a researcher.
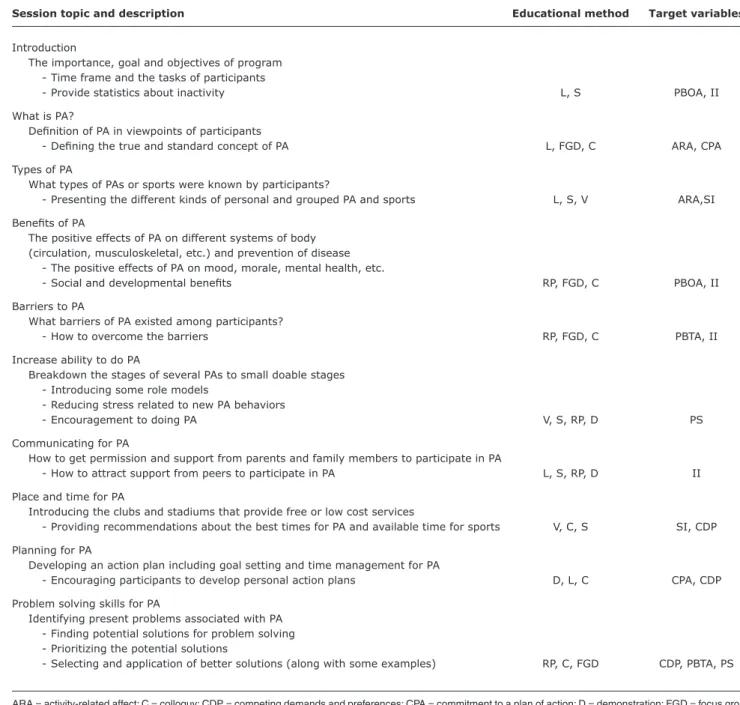
Education was based on the SOG and the HPM. It attempted to seek the viewpoints of participants about personal and environmental obstacles toward PA by performing interpersonal consulting or group discussions. The education program is described in Table 1.
In addition, a 2-hour family workshop was scheduled shortly after randomization was conducted to provide a general introduction to the program goals, and featured tips on how parents could provide support to their children. Families who did not attend were mailed copies.
After each session the content of educational material was provided to participants as either a pamphlet or hand-out, and they were asked to review it at home. Also, adolescents were asked to keep a self-monitoring diary as part of their homework in which they documented, in detail, their daily physical activities.
In order to reinforce social support and role modeling, an exercise program included two football and footrace competitions was held, and participants and their parents were invited to be present at those events.
Data were analyzed using the SPSS software for Windows,
version 17 (SPSS Inc., Chicago, IL). Paired t test was used to assess pre- and post-differences in participant outcomes.
Independent t test was used to evaluate differences between
Table 1 - The curriculum of physical activity course based on interventional health promotion model constructs and used educational methods
Session topic and description Educational method Target variables
Introduction
The importance, goal and objectives of program - Time frame and the tasks of participants
- Provide statistics about inactivity L, S PBOA, II
What is PA?
Deinition of PA in viewpoints of participants
- Deining the true and standard concept of PA L, FGD, C ARA, CPA
Types of PA
What types of PAs or sports were known by participants?
- Presenting the different kinds of personal and grouped PA and sports L, S, V ARA,SI Beneits of PA
The positive effects of PA on different systems of body (circulation, musculoskeletal, etc.) and prevention of disease - The positive effects of PA on mood, morale, mental health, etc.
- Social and developmental beneits RP, FGD, C PBOA, II
Barriers to PA
What barriers of PA existed among participants?
- How to overcome the barriers RP, FGD, C PBTA, II
Increase ability to do PA
Breakdown the stages of several PAs to small doable stages - Introducing some role models
- Reducing stress related to new PA behaviors
- Encouragement to doing PA V, S, RP, D PS
Communicating for PA
How to get permission and support from parents and family members to participate in PA
- How to attract support from peers to participate in PA L, S, RP, D II
Place and time for PA
Introducing the clubs and stadiums that provide free or low cost services
- Providing recommendations about the best times for PA and available time for sports V, C, S SI, CDP
Planning for PA
Developing an action plan including goal setting and time management for PA
- Encouraging participants to develop personal action plans D, L, C CPA, CDP
Problem solving skills for PA
Identifying present problems associated with PA - Finding potential solutions for problem solving - Prioritizing the potential solutions
- Selecting and application of better solutions (along with some examples) RP, C, FGD CDP, PBTA, PS
ARA = activity-related affect; C = colloquy; CDP = competing demands and preferences; CPA = commitment to a plan of action; D = demonstration; FGD = focus group discussion; II = interpersonal influences; L = lecture; PA = physical activity; PBOA = perceived benefits of action; PBTA = perceived barriers to action;
PS = perceived self-efficacy; RP = role playing; S = slide; SI = situational influences; V = video. Categorical variables were assessed using either the
chi-square test or Fisher’s exact test, depending upon expected cell frequencies. One-way ANOVA’s compared mean scores between the intervention and control groups, and between males and females. The Pearson correlation test was used to assess relationships between the constructs of HPM and PA. Moreover, a linear multiple regression was performed to address how variables predict PA. In the regression model, the time of weekly PA was considered as
a dependent variable. In all analysis, statistical signiicance
was set at a two-tailed p-value (p = 0.05).
Results
The sample consisted of 88 males and 77 females. Ages ranged from 13 to 15 years with a mean age of 13.99 years
(SD= 0.475). Of the participants, 10 persons (6%) were
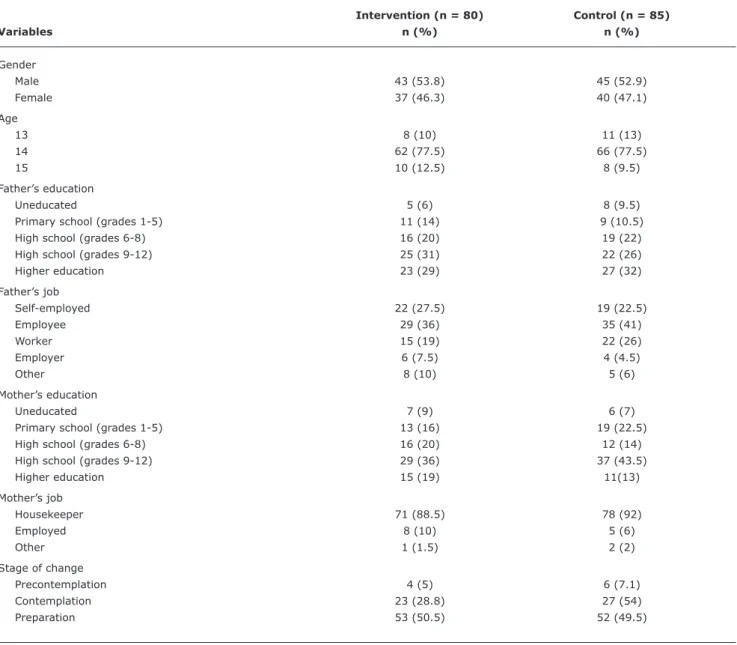
Table 2 - Demographic characteristics of intervention and control groups
Intervention (n = 80) Control (n = 85)
Variables n (%) n (%)
Gender
Male 43 (53.8) 45 (52.9)
Female 37 (46.3) 40 (47.1)
Age
13 8 (10) 11 (13)
14 62 (77.5) 66 (77.5)
15 10 (12.5) 8 (9.5)
Father’s education
Uneducated 5 (6) 8 (9.5)
Primary school (grades 1-5) 11 (14) 9 (10.5)
High school (grades 6-8) 16 (20) 19 (22)
High school (grades 9-12) 25 (31) 22 (26)
Higher education 23 (29) 27 (32)
Father’s job
Self-employed 22 (27.5) 19 (22.5)
Employee 29 (36) 35 (41)
Worker 15 (19) 22 (26)
Employer 6 (7.5) 4 (4.5)
Other 8 (10) 5 (6)
Mother’s education
Uneducated 7 (9) 6 (7)
Primary school (grades 1-5) 13 (16) 19 (22.5)
High school (grades 6-8) 16 (20) 12 (14)
High school (grades 9-12) 29 (36) 37 (43.5)
Higher education 15 (19) 11(13)
Mother’s job
Housekeeper 71 (88.5) 78 (92)
Employed 8 (10) 5 (6)
Other 1 (1.5) 2 (2)
Stage of change
Precontemplation 4 (5) 6 (7.1)
Contemplation 23 (28.8) 27 (54)
Preparation 53 (50.5) 52 (49.5)
All comparisons are non-significant at p < 0.05.
placed in the preparation stage of change (n = 105, 63.6%) before intervention (Table 2).
Results showed that the constructs such as barriers of PA, commitment to action plan, competing demand and preferences, and role models’ component of interpersonal
inluences had a correlation at p < 0.01 to PA. The beneits of PA, social support component of interpersonal inluences, and situational inluences at p < 0.05 were correlated to
time of weekly PA. The direction of the above correlations, except barriers of PA and competing demands, were positive (data not shown).
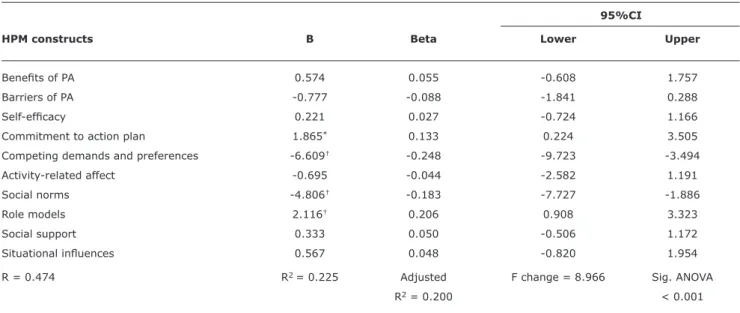
Multiple regression analysis revealed that competing demands and preferences, social norms, role models
(p < 0.001), and commitment to action plan (p < 0.05)
can predict the time of weekly PA among participants.
The R2 value of the regression model indicated a 22.5%
variance in PA (Table 3). The ANOVA table showed the regression model predicts the outcome variable
signiicantly (p < 0.001).
Three months after the intervention, a majority of individuals reported being in the action stage (44.4%), while there was no one in the precontemplation or contemplation stages among people in the intervention group. The number of people in the control group across the SOG did not
signiicantly change at follow-up, compared to baseline,
Table 3 - Multivariate regression analyses of weekly physical activity behavior against health promotion model constructs
B = standardized regression coefficients; Beta = unstandardized regression coefficients; 95%CI = 95% confidence interval; HPM = health promotion model; PA = physical activity; Sig. = Significance level.
* p < 0.05. † p < 0.001.
95%CI
HPM constructs B Beta Lower Upper
Beneits of PA 0.574 0.055 -0.608 1.757
Barriers of PA -0.777 -0.088 -1.841 0.288
Self-eficacy 0.221 0.027 -0.724 1.166
Commitment to action plan 1.865* 0.133 0.224 3.505
Competing demands and preferences -6.609† -0.248 -9.723 -3.494
Activity-related affect -0.695 -0.044 -2.582 1.191
Social norms -4.806† -0.183 -7.727 -1.886
Role models 2.116† 0.206 0.908 3.323
Social support 0.333 0.050 -0.506 1.172
Situational inluences 0.567 0.048 -0.820 1.954
R = 0.474 R2 = 0.225 Adjusted F change = 8.966 Sig. ANOVA
R2 = 0.200 < 0.001
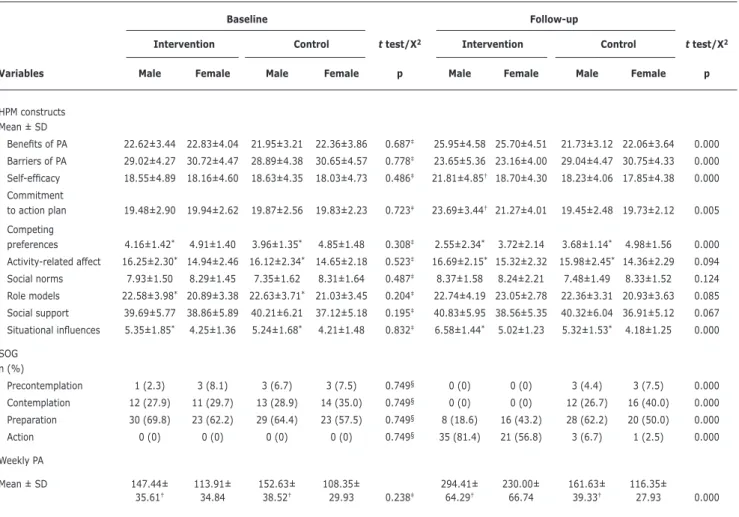
The time of weekly PA increased from 131.93±38.68 to 264.62±72.61 among participants of the intervention group (thought to be considerable), while the mean changes of
PA in the control group was not signiicant. There was a signiicant difference between girls and boys in terms of weekly PA (p < 0.001), in both the intervention and control
groups (either in baseline or follow-up). Also, as could be seen in the last table, a comparable number of boys and girls was in preparation stage at baseline (30 vs. 23), but the number of girls that were found to be in preparation stage showed a considerable difference to the boys at follow-up (16 vs. 8) among the participants of the intervention group. Other changes are presented in Table 4.
Discussion
This educational intervention found that education has a noticeable impact on enhancing most HPM constructs and SOG as related to PA both in girls and boys.
In recent years, several studies have reported that model- or theory-based interventions can be effective in promoting proper PA among adolescents. In a theory-based study, the difference in time of daily moderate-to-vigorous physical activities (MVPA) among the intervention group, as compared to the control group, increased from 18 min
at post-test to 33 min at the 3 month follow-up.27 In our
study this time was approximately 19 min daily between baseline to the 5 month follow-up.
Using the health promotion model for PA has a practical
beneit, because the model has been practiced in other
studies that have found signiicant results in its application for
PA.16,17,22,23,26 But more studies in this regard have focused
on predicting the power of the model and its application in the form of an intervention. For example, in a study it is
revealed that social support, modeling, self-eficacy, and perceived beneits and barriers to performing PA directly and indirectly inluence the behavior of PA in Taiwanese
adolescents.16 The hypothesized model, that was a revised
version of the model, explained 25% of the variance in PA.
This was about 30% in another study.17 In our study, the
variance of PA explained by the model was approximately 22.5% and therefore consistent with other research.
In a similar study, inclusion of only the adolescents
from the preparation stage was reported as a limitation.28
Moreover, not all constructs of the HPM were measured, and the intervention was performed only with girls. We attempted to overcome such limitations in our study.
Many studies have shown that using the SOG for staging
participants can improve interventions.28-30 The indings of
this study support the SOG’s application in this population, as most constructs of the HPM to PA differed across stages before and after intervention, and changes were in the direction predicted by theory. However, there was no
signiicant change observed for activity-related affect, or for the components of interpersonal inluences.
Pender et al., in the manual of the HPM, suggest that helping to plan enjoyable activities can be used for
intervention toward improving the activity-related affect.29
Table 4 - Changes of health promotion model constructs and stage of change in terms of gender for intervention and control groups
Baseline Follow-up
Intervention Control t test/X2 Intervention Control t test/X2
Variables Male Female Male Female p Male Female Male Female p
HPM constructs Mean ± SD
Beneits of PA 22.62±3.44 22.83±4.04 21.95±3.21 22.36±3.86 0.687‡ 25.95±4.58 25.70±4.51 21.73±3.12 22.06±3.64 0.000
Barriers of PA 29.02±4.27 30.72±4.47 28.89±4.38 30.65±4.57 0.778‡ 23.65±5.36 23.16±4.00 29.04±4.47 30.75±4.33 0.000
Self-eficacy 18.55±4.89 18.16±4.60 18.63±4.35 18.03±4.73 0.486‡ 21.81±4.85† 18.70±4.30 18.23±4.06 17.85±4.38 0.000
Commitment
to action plan 19.48±2.90 19.94±2.62 19.87±2.56 19.83±2.23 0.723‡ 23.69±3.44† 21.27±4.01 19.45±2.48 19.73±2.12 0.005
Competing
preferences 4.16±1.42* 4.91±1.40 3.96±1.35* 4.85±1.48 0.308‡ 2.55±2.34* 3.72±2.14 3.68±1.14* 4.98±1.56 0.000
Activity-related affect 16.25±2.30* 14.94±2.46 16.12±2.34* 14.65±2.18 0.523‡ 16.69±2.15* 15.32±2.32 15.98±2.45* 14.36±2.29 0.094
Social norms 7.93±1.50 8.29±1.45 7.35±1.62 8.31±1.64 0.487‡ 8.37±1.58 8.24±2.21 7.48±1.49 8.33±1.52 0.124
Role models 22.58±3.98* 20.89±3.38 22.63±3.71* 21.03±3.45 0.204‡ 22.74±4.19 23.05±2.78 22.36±3.31 20.93±3.63 0.085
Social support 39.69±5.77 38.86±5.89 40.21±6.21 37.12±5.18 0.195‡ 40.83±5.95 38.56±5.35 40.32±6.04 36.91±5.12 0.067
Situational inluences 5.35±1.85* 4.25±1.36 5.24±1.68* 4.21±1.48 0.832‡ 6.58±1.44* 5.02±1.23 5.32±1.53* 4.18±1.25 0.000
SOG n (%)
Precontemplation 1 (2.3) 3 (8.1) 3 (6.7) 3 (7.5) 0.749§ 0 (0) 0 (0) 3 (4.4) 3 (7.5) 0.000
Contemplation 12 (27.9) 11 (29.7) 13 (28.9) 14 (35.0) 0.749§ 0 (0) 0 (0) 12 (26.7) 16 (40.0) 0.000
Preparation 30 (69.8) 23 (62.2) 29 (64.4) 23 (57.5) 0.749§ 8 (18.6) 16 (43.2) 28 (62.2) 20 (50.0) 0.000
Action 0 (0) 0 (0) 0 (0) 0 (0) 0.749§ 35 (81.4) 21 (56.8) 3 (6.7) 1 (2.5) 0.000
Weekly PA
Mean ± SD 147.44± 113.91± 152.63± 108.35± 294.41± 230.00± 161.63± 116.35±
35.61† 34.84 38.52† 29.93 0.238‡ 64.29† 66.74 39.33† 27.93 0.000
HPM = health promotion model; PA = physical activity; SD = standard deviation; SOG = stage of change. *p-value is significant at 0.01.
† p-value is significant at 0.001 between genders in each group (intervention/control).
‡ t test. § X2.
Also, we attempted to help adolescents identify enjoyable activities they might consider when goal setting for PA. But perhaps these measurements have not been enough, or else other issues should be addressed in order to
suficiently improve the construct. In Interventions to
address interpersonal inluences, Pender also recommends that solutions for social norms, social support and role
models are: “Encourage family and friends to increase
expectations of activity, help clients use social support by asking family and friends to be active with him/her or provide support to do so,” and to “plan increased
interaction with persons who are physically active.”25
To address these recommendations, we administered
activities such as describing the importance, beneits,
and overcoming the barriers of PA for peers and families, as well as proper communications for generating social support. However, it seems that interventions focusing
on inluencing interpersonal relations need more time,
and also need to be modiied, to meet special cultural and individual characteristics of people. This inding is
consistent to Taymoori et al.28
Another inding of our study was that different levels
of PA, competing preferences, activity-related affect, role
models, and situational inluences between boys and girls
was observed. This is not surprising, for other studies have found gender differences that may be affecting time
spent on PA,5 demands and preferences,31 affects and
emotions,32 and modeling for PA.33 But a point related to
differences concerning situational inluences between males
and females is that in Iran, as a developing country, there are culture-based differences (such as unequal options for girls compared to boys) that may be impacting upon PA between the two sexes.
The associations between the constructs of the HPM toward PA, and also the predictive power of the regression
References
1. World Health Organization (WHO). Physical inactivity: a global public health problem. http://www.who.int/topics/physical_ activity/en/. Access: 20/01/2012.
2. Wilks DC, Besson H, Lindroos AK, Ekelund U. Objectively measured physical activity and obesity prevention in children, adolescents
and adults: a systematic review of prospective studies.Obes Rev.
2011;12:e119-29.
3. Petronyte G, Zaborskis A. The inluence of individual and regional factors on association between leisure time physical activity and psychological complaints among adolescents in Europe. Cent Eur J Public Health. 2009;17:215-9.
4. Ghosh A. Association of anthropometric, body composition and physiological measures with physical activity level among the
children and adolescents of Asian Indian origin: the Calcutta
obesity study. J Nutr Health Aging. 2010;14:731-5.
5. Lippo BR, Silva IM, Aca CR, Lira PI, Silva GA, Motta ME. Determinants of physical inactivity among urban adolescents. J Pediatr (Rio J). 2010;86:520-4.
6. Fernandes RA, Christofaro DG, Casonatto J, Kawaguti SS, Ronque ER, Cardoso JR, et al. Cross-sectional association between healthy and unhealthy food habits and leisure physical activity in adolescents. J Pediatr (Rio J). 2011;87:252-6.
the beneit of the HPM application for predicting the variables
related to PA.
Our study has some limitations that should be considered
when interpreting the indings. First, the present study had
a 5-month follow-up. If we could monitor the changes for a longer duration results might be different, and we could then assess the number of adolescents who enter in the maintenance stage. With regard to this fact, that the goal of any health education program is the maintenance of healthy behaviors, other research can address the long-term follow-up.
And secondly, we used self-report questionnaires for assessing the variables of the study. Although these instruments may include recall and bias, experts believe that applying these instruments can result in acceptably
valid data for PA.34
This study provided an opportunity to test a variety of mediators of physical behavior activity and showed that variables such as competing preferences, social norms, and role models can predict the PA behavior among adolescents. The results of this study support the belief that PA, and many variables of the HPM model related to PA, can be improved in adolescents by virtue of participant staging based upon readiness to change and a structured educational program.
Acknowledgements
This study was supported by grants from Baqiyatallah University of Medical Sciences. We thank the school principals, teachers and students for their active participation. Also we are grateful Dr. R Tavakoli and Dr. A Karimi for their technical assistance.
7. Jahnsen R, Villien L, Egeland T, Stanghelle JK, Holm I. Locomotion skills in adults with cerebral palsy. Clin Rehabil. 2004;18:309-16.
8. Press V, Freestone I, George CF. Physical activity: the evidence
of beneit in the prevention of coronary heart disease. QJM.
2003;96:245-51.
9. World Health Organization (WHO). Global recommendations on physical activity for health. http://www.who.int/
dietphysicalactivity/factsheet_recommendations/en/index.html.
Access: 22/01/2012.
10. Kelishadi R, Ardalan G, Gheiratmand R, Gouya MM, Razaghi EM, Delavari A, et al. Association of physical activity and dietary behaviours in relation to the body mass index in a national sample
of Iranian children and adolescents: CASPIAN Study. Bull World
Health Organ. 2007;85:19-26.
11. Moayeri H, Bidad K, Aghamohammadi A, Rabbani A, Anari S, Nazemi L, et al. Overweight and obesity and their associated factors in adolescents in Tehran, Iran, 2004-2005. Eur J Pediatr. 2006;165:489-93.
12. Fitz-Gibbon CT. Researching outcomes of educational interventions. Theory based evaluation is interim measure of implementation.
BMJ. 2002;324:1155.
13. Hillsdon M, Foster C, Thorogood M. Interventions for promoting physical activity. Cochrane Database Syst Rev. 2005;(1):CD003180.
14. Dishman RK, Vandenberg RJ, Motl RW, Nigg CR. Using constructs of the transtheoretical model to predict classes of change in regular
physical activity: a multi-ethnic longitudinal cohort study. Ann
Behav Med. 2010;40:150-63.
15. Hutchison AJ, Breckon JD, Johnston LH. Physical activity behavior
change interventions based on the transtheoretical model: a
systematic review. Health Educ Behav. 2009;36:829-45. 16. Wu TY, Pender N. A panel study of physical activity in Taiwanese
youth: testing the revised health-promotion model. Fam
Community Health. 2005;28:113-24.
17. Wu TY, Pender N. Determinants of physical activity among
Taiwanese adolescents: an application of the health promotion
model. Res Nurs Health. 2002;25:25-36.
18. Pender NJ, Murdaugh CL, Parsons MA. Health promotion in nursing practice. 5th ed. Upper Saddle River, NJ: Pearson/Prentice Hall; 2006.
19. Cohen J. Statistical power analysis in the behavioral sciences. 2nd edition. Hillsdale, NJ: Lawrence Erlbaum Associates, Inc.; 1988.
20. Craig CL, Shields M, Leblanc AG, Tremblay MS. Trends in aerobic
itness among Canadians, 1981 to 2007-2009. Appl Physiol Nutr
Metab. 2012;37:511-9.
21. Kearney JM, de Graaf C, Damkjaer S, Engstrom LM. Stages of change towards physical activity in a nationally representative sample in the European Union. Public Health Nutr. 1999;2:115-24.
22. Garcia AW, Broda MA, Frenn M, Coviak C, Pender NJ, Ronis DL.
Gender and developmental differences in exercise beliefs among youth and prediction of their exercise behavior. J Sch Health. 1995;65:213-9.
23. Taymoori P, Niknami S, Berry T, Ghofranipour F, Kazemnejad A. Application of the health promotion model to predict stages of exercise behaviour in Iranian adolescents. East Mediterr Health J. 2009;15:1215-25.
24. Robbins LB, Pis MB, Pender NJ, Kazanis AS. Exercise self-eficacy,
enjoyment, and feeling states among adolescents. West J Nurs Res. 2004;26:699-721.
25. University of Michigan School of Nursing. Health Promotion Model – Instruments to Measure HPM Behavioral Determinants. 1995. http://deepblue.lib.umich.edu/browse?type=author&order=ASC
&rpp=20&value=Pender%2C+Nola+J. Access: 24/01/2012.
26. Garcia AW, George TR, Coviak C, Antonakos C, Pender NJ. Development of the child/adolescent activity log: a comprehensive
Correspondence Mohsen Saffari
Health Education Department, School of Health, Baqiyatallah University of Medical Sciences West Brazil Street, No.53 - Tehran - Iran Tel.: +98 (21) 8804.0151
Fax: +98 (21) 8860.8499 E-mail: [email protected] 27. Araújo-Soares V, McIntyre T, MacLennan G, Sniehotta FF.
Development and exploratory cluster-randomised opportunistic trial of a theory-based intervention to enhance physical activity among adolescents. Psychol Health. 2009;24:805-22.
28. Taymoori P, Niknami S, Berry T, Lubans D, Ghofranipour F, Kazemnejad A. A school-based randomized controlled trial to improve physical activity among Iranian high school girls. Int J Behav Nutr Phys Act. 2008;5:18.
29. Rye JA, Rye SL, Tessaro I, Cofindaffer J. Perceived barriers to physical activity according to stage of change and body mass index in the West Virginia wisewoman population. Womens Health Issues. 2009;19:126-34.
30. Wilhelm Stanis SA, Schneider IE, Pereira MA. Parks and health: differences in constraints and negotiation strategies for park-based leisure time physical activity by stage of change. J Phys Act Health. 2010;7:273-84.
31. Mayorova T, Stevens F, Scherpbier A, van der Velden L, van der Zee J. Gender-related differences in general practice preferences:
longitudinal evidence from the Netherlands 1982-2001. Health Policy. 2005;72:73-80.
32. Simpson PA, Stroh LK. Gender differences: emotional expression
and feelings of personal inauthenticity. J Appl Psychol. 2004;89:715-21.
33. Wu SY, Pender N, Noureddine S. Gender differences in the psychosocial and cognitive correlates of physical activity among
Taiwanese adolescents: a structural equation modeling approach.
Int J Behav Med. 2003;10:93-105.
34. Chinapaw MJ, Mokkink LB, van Poppel MN, van Mechelen W, Terwee
CB. Physical activity questionnaires for youth: a systematic review