ORIGINAL ARTICLE
einstein. 2010; 8(1 Pt 1):1-4
Birth weight distribution of Hospital Geral do Grajaú
population compared to São Paulo city population
Distribuição do peso ao nascer da população do Hospital Geral do Grajaú comparada à da
população da cidade de São Paulo
José Ricardo Dias Bertagnon1, Jane de Eston Armond2, Cintia Leci Rodrigues3, Viviane de Almeida Jabur4, Gabriela Alba Kuraim5, Neil Ferreira Novo6,Conceição Aparecida de Matos Segre7
ABSTRACT
Objective: To compare the growth curves from a population from a large city suburban hospital with those of the city of São Paulo, São Paulo State, Brazil. Methods: At Hospital Geral do Grajaú, that serves the high pregnancy risk population lacking health facilities, of low education level and smaller number of prenatal visits and great morbidity, a growth curve was built for the newborns, as the Hospital is provided with updated equipment and personnel. The curve was built from the database available containing information on live births during the 2003 to 2007 period and totaling 9,952 newborns, as their weight at birth and gestational age were taken as parameters. The distribution curves of 3%, 10%, 50% and 90% of the Grajaú were compared to those of the city of São Paulo curve. Results: The curves did not significantly differ from those of the São Paulo curve percentiles, as shown by the mean deviation (Z score) calculation, notwithstanding the higher rates for prematurity, low weight, teenager mothers and lack of prenatal visits among the Grajaú population as compared to those of São Paulo. Conclusions: The São Paulo city curve showed to be appropriate for the suburban population despite the existing differences.
Keywords: Infant, newborn/growth & development; Fetal development
RESUMO
Objetivo: Comparar a curva de crescimento intrauterino de uma população que se serve de um hospital da região periférica com a curva de crescimento intrauterino da cidade de São Paulo, Brasil. Métodos: O Hospital Estadual do Grajaú serve a uma população com gestação de alto risco, com falta de recursos de saúde, baixo nível
de escolaridade, poucas consultas de pré-natal e grande morbidade. O hospital que atende a essa população tem recursos e pessoal especializado, o hospital escola de medicina. A curva foi construída por meio de programa de dados confiáveis que contém informações sobre todos os recém-nascidos vivos durante os anos de 2003 a 2007, totalizando 9.952 recém-nascidos, tomando-se os dados de peso e idade gestacional como parâmetros. As curvas de distribuição de peso para os percentis 3, 10, 50 e 90 para os grupos de idade gestacional foram comparados àqueles da curva da cidade de São Paulo. Resultados: As curvas não diferiram significativamente, como demonstrado pelo cálculo do desvio das médias (Z score), não obstante as taxas de prematuridade, baixo peso, mães adolescentes e falta de consultas ao pré-natal fossem significativamente maiores na população do Hospital Estadual do Grajaú do que na população do município de São Paulo. Conclusões: A curva da cidade de São Paulo se mostrou apropriada para aquela população da periferia da cidade, ainda que existam as diferenças epidemiológicas.
Descritores: Recém-nascido/crescimento & desenvolvimento; Desenvolvimento fetal
INTRODUCTION
Birth weight (W) depends on the interaction between the genetic potential and factors that regulate nutrient utilization(1). Newborn (NB) W is closely related to the
duration of gestation, but restrictive or hypertrophic factors may cause abnormal W for gestational age (GA) or be a manifestation of disorders. Lubchenco et
Study carried out at Hospital Estadual do Grajaú Professor Liberato John Alphone Di Dio, São Paulo (SP), Brazil.
1 PhD; Neonatologist of the Hospital Estadual do Grajaú Professor Liberato John Alphonse Di Dio; Full professor at Universidade de Santo Amaro – UNISA, São Paulo (SP), Brazil. 2 PhD; Full professor of Public Health at Universidade de Santo Amaro – UNISA, São Paulo (SP), Brazil.
3 Biomedical scientist at Universidade de Santo Amaro – UNISA, São Paulo (SP), Brazil.
4 Second-year resident in Pediatrics at Universidade de Santo Amaro – UNISA, São Paulo (SP), Brazil. 5 Medical Student of Universidade de Santo Amaro – UNISA, São Paulo (SP), Brazil.
6 PhD; Full professor of Public Health at Universidade de Santo Amaro – UNISA, São Paulo (SP), Brazil.
7 PhD; Professor of the Specialization Course in Neonatology at Instituto Israelita de Ensino e Pesquisa Albert Einstein – IIPAE, São Paulo (SP), Brazil.
Corresponding author:José Ricardo Dias Bertagnon – Rua Francisco Romeiro Sobrinho, 171 – Chácara Santo Antonio – CEP 04710-180 – São Paulo (SP), Brazil – Tel.: 5181-5330 – E-mail: [email protected]
einstein. 2010; 8(1 Pt 1):1-4
2 Bertagnon JRD, Armond JE, Rodrigues CL, Jabur VA, Kuraim GA, Novo NF, Segre CAM
al. prepared an intrauterine growth curve and showed the association of perinatal morbidity and mortality with patterns established by this curve(2-3). Other
authors built curves relating W and GA, observing that it is appropriate to have curves constructed for specific populations(4). In 2008, an intrauterine growth curve for
the city of São Paulo (SP), which comprises different population groups, was published(5). Hospital Estadual
do Grajaú (HEG), placed in the southern region of São Paulo city attends a population lacking other medical services and considered below the poverty line. It is a teaching hospital with interns and residents, nursing training, physiotherapy, among other healthcare professionals, but with technical and personnel resources recommended for good obstetric and neonatal care.
The pregnant women assisted by this hospital include large numbers of teenage mothers, women who do not seek prenatal service, a higher frequency of prematurity and low birth weight(6-7). Therefore, it would be of
practical usefulness to verify the possibility of utilizing the intrauterine growth curves constructed for the São Paulo city population in the HEG population.
OBJECTIVES
To construct a W distribution curve according to GA of the HEG population and to compare it to the existing 2004 curve of the city of São Paulo.
METHODS
In order to characterize the SP and the HEG populations, the SINASC(8) database (from the Portuguese, Sistema
de Informações de Nascidos Vivos), available at the Municipal Secretariat of Health of São Paulo website, was used. From the data of the Live Newborn Registry (DNV, acronym in Portuguese) obtained in this database, we recorded the frequency of NB with W less than 2500 g, NB with less than 37 weeks GA, multiple gestations, mothers younger than 20 years, older than 35 years and pregnant women who had not attended any prenatal visits.
The HEG population was determined by adding all live NB between 2003 and 2007 in order to get a number
sufficient for comparisons, considering there were similarities between the populations and no apparent differences. The population of São Paulo was that of 2004, when the curve was constructed, consisting of 189,990 newborns. The populations were compared by means of the χ2 test(9).
The SINASC categorizes NB into six GA classes: Class 1: < 22 weeks; Class 2: 22 to 27 weeks; Class 3: 28 to 31 weeks; Class 4: 32 to 36 weeks; Class 5: 37 to 41 weeks; Class 6: 42 weeks or more(8). From this
database, the W distribution at each GA category of the live NB from HEG was recorded. The exclusion criteria were: multiple gestation, NB with congenital malformation and those not having the information on W at birth or GA, as well as those with birth W higher or lower than three standard deviations for each GA.
Class 1, NB with GA lower than 22 weeks, were too few for validation and percentile identification, thus being excluded from the sample. With this observation, 9,799 NB were included in the study.
For each GA interval, that is: 22 to 27 weeks, 28 to 31 weeks, 32 to 36 weeks, 37 to 41 weeks and 42 weeks or more, the ordained distribution of birth W was obtained, and the W values corresponding to the 3rd, 10th, 50th and 90th percentiles for each GA class
were identified.
For the city of São Paulo intrauterine growth curve, means and standard deviations of birth W were calculated for each GA class interval(5). The values for
the 3rd, 10th, 50th and 90th percentiles of the HEG curve
were compared to those of the São Paulo distribution curve (normal curve) and verified by the reduced normal distribution, which values would be taken in the reduced curve, according to the “Z” calculation.
Using the Student’s t test for independent samples, the W distribution of SP and HEG populations were compared.
RESULTS
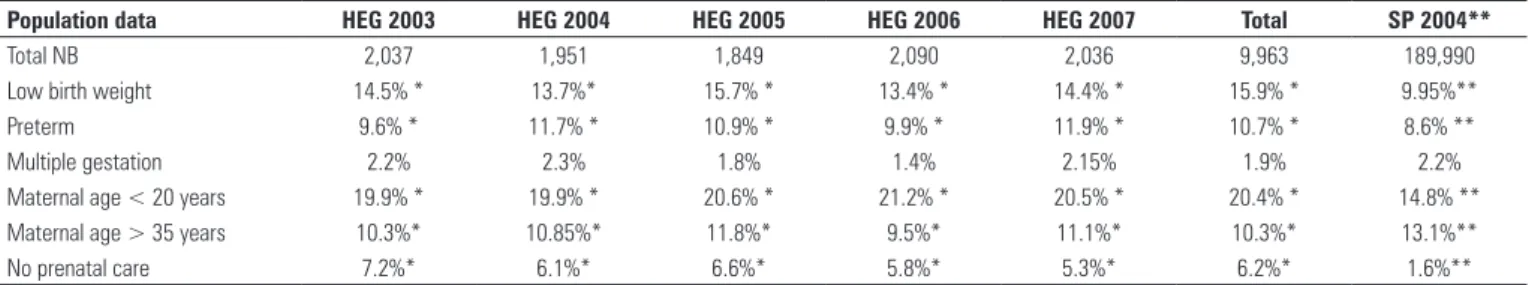
Table 1 shows the frequencies of population characteristics from 2003 to 2007 for the HEG, and 2004 for the population of São Paulo.
Table 1. Frequency of population data in successive years in the HEG, from 2003 to 2007, and in SP, in 2004
Population data HEG 2003 HEG 2004 HEG 2005 HEG 2006 HEG 2007 Total SP 2004**
Total NB 2,037 1,951 1,849 2,090 2,036 9,963 189,990
Low birth weight 14.5% * 13.7%* 15.7% * 13.4% * 14.4% * 15.9% * 9.95%**
Preterm 9.6% * 11.7% * 10.9% * 9.9% * 11.9% * 10.7% * 8.6% **
Multiple gestation 2.2% 2.3% 1.8% 1.4% 2.15% 1.9% 2.2%
Maternal age < 20 years 19.9% * 19.9% * 20.6% * 21.2% * 20.5% * 20.4% * 14.8% **
Maternal age > 35 years 10.3%* 10.85%* 11.8%* 9.5%* 11.1%* 10.3%* 13.1%**
No prenatal care 7.2%* 6.1%* 6.6%* 5.8%* 5.3%* 6.2%* 1.6%**
einstein. 2010; 8(1 Pt 1):1-4
Birth weight distribution of Hospital Geral do Grajaú population compared to São Paulo city population 3
It could be observed that population values of the HEG varied very little in different years from year to year during the studied period, with no significant differences among them. On the other hand, the values of the population of SP were significantly different from those of HEG.
Table 2 shows the birth W values for each GA interval at the different percentiles for the HEG population. The W distribution values (mean and standard deviation) of different GA groups were not significantly different between the two populations, except for the distribution in the group of 37 to 41 weeks, when the mean and standard deviation for São Paulo were 3223.37 ± 415.21 g and, for HEG, were 3159.9 ± 463.4 g.
Table 3 shows the percentiles in the SP curve using the values found in the HEG curve for the 3rd, 10th, 50th
and 90th percentiles by means of the Z score.
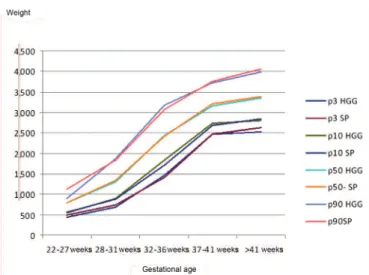
Figure 1 shows the overlap of the curves.
DISCUSSION
The two curves were similar regarding the W distribution for the different GA groups. However, the difference observed between the 37 to 41 week NB should be emphasized, when the mean W of the SP population was higher than that of HEG, probably because the number of individuals in this class in the SP population was higher than 175,000. In all other GA groups, the differences were not significant and, therefore, the SP curve may be reliably used to classify the HEG NB.
The fact that the population of pregnant women using the HEG displays factors linked to intrauterine malnutrition could raise suspicion that the 10th and 3rd
percentiles would have significantly lower limits than the corresponding ones at the SP curve(5), which did not
occur. In fact, fetal nutritional stores and deposits are formed after the 35th week and at accelerated rate, near
the normal end of the pregnancy(10-11). Fetuses with some
degree of growth restriction will show more evidence of such malnutrition in the last weeks of pregnancy. Likewise, the genetic manifestations regarding growth are more evident as the GA increases(11-12). Such factors
somehow explain the different growth curves for the populations of different ethnicities.
It is thus understood that the epidemiological differences between the two populations is not enough for the increase or decrease in proportion of malnourished or over-nourished NB.
Analyzing the epidemiological factors, which were different in both populations, a higher proportion of adolescent mothers was observed at the HEG. Some studies showed a higher frequency of low birth weight among NB of teenage mothers(12-13), but previous
studies carried pout in our institution did not find such associations(14-15).
The higher proportion of older mothers is associated to the NB small for gestational age (SGA), verified in
Figure 1. Comparing the intrauterine growth curves of the HGG and SP –
Overlapping of both curves
Table 3. Z value and respective percentiles of the HEG in the SP curve
GA (weeks) Z Value % in the SP curve of the
3% value of the HEG Z Value
% in the SP curve of the
10% value of the HEG Z Value
% in the SP curve of the
50% value of the HEG Z Value
% in the SP curve of the 90% value of the HEG
22-27 1.7 4.5 1.2 11.5 0.1 47.7 0.7 87.7
28-31 1.7 4.4 1.2 11.3 0.1 49.6 1.4 92.0
32-36 1.9 2.9 1.2 11.7 0.1 49.2 1.4 91.9
37-41 1.8 3.5 1.2 12.9 0.1 44.4 1.3 88.8
>41 1.8 3.5 1.1 10.5 0.2 43.0 1.0 86.2
Table 2. Birth weight at 3rd, 10th, 50th and 90th percentiles of weight distribution per gestational age interval in the HEG population and in SP population(4)
GA (weeks) P3 HEG (g) P3 SP (g) P10 HEG (g) P10 SP (g) P50 HEG (g) P50 SP (g) P90 HEG (g) P90 SP (g)
22-27 434 500 549 558 800 790 900 1,121
28-31 696 740 903 890 1,311 1,350 1,865 1,830
32-36 1,464 1,420 1,833 1,720 2,440 2,425 3,180 3,070
37-41 2,476 2,465 2,733 2,690 3,160 3,205 3,730 3,765
einstein. 2010; 8(1 Pt 1):1-4
4 Bertagnon JRD, Armond JE, Rodrigues CL, Jabur VA, Kuraim GA, Novo NF, Segre CAM
previous studies carried out in this institution and in the international literature(6,14,16).
Twinning is associated with intrauterine
malnutrition(16) and the SP population has a higher
proportion of twinning than the HEG population, although this factor was removed for methodological reasons in the construction of both curves.
Prematurity and low birth weight are more frequent in the HEG population. It has been described that the intrauterine growth curves show differences in NB after 36 weeks of GA associated with socio-economic differences(17).
Premature NB and low birth weight NB are not necessarily malnourished(18). Disorders indicating
pregnancy interruption, thus causing low birth weight or pre-term delivery, such as abruptio placenta or even the specific hypertensive disorder of pregnancy, would not act necessarily during enough time to cause fetal nutritional restriction, increasing the occurrence of small-for-gestational-age NB.
Some studies showed that appropriate pre-natal visits are associated with larger birth weight(19), but despite
the higher number of mothers that does not attend pre-natal care in the HEG, this was not observed.
CONCLUSIONS
The birth weight distribution curve by GA of the city of SP may be used to classify the HEG NB, despite the epidemiological differences found between the two populations.
REFERENCES
1. Hay WW Jr, Catz CS, Grave GD, Yaffe SJ. Workshop summary. Fetal growth: its regulation and disorders. Pediatrics. 1997;99(4):585-91.
2. Lubchenco LO, Hansman C, Dressler M, Boyed E. Intrauterine growth as estimated from live born birth weight data at 24-42 weeks gestation. Pediatrics. 1963;32:793-800.
3. Lubchenco LO, Searls DT, Brazie JV. Neonatal mortality rate: relationship to birth weight and gestational age. J Pediatr. 1972;81(4):814-22.
4. González R, Gómez R, Castro R, Merino P, Kae NJ, Merino OP, et al. Curva nacional de distribución de peso al nacer según edad gestacional. Chile, 1993 a 2000. Rev Med Chile. 2004;132(10):1155-65.
5. Bertagnon JRD, Rodrigues CL, Armand JE, Segre CAM. Intrauterine curve of newborns of the city of São Paulo, Brazil. Einstein. 2008;6(4):408-12. 6. SINASC, Coordenadoria de Saúde da Capela do Socorro. Recém-nascido de
baixo peso. Prefeitura do Município de São Paulo; 1999-2002.
7. Bertagnon JRD, Ruzzante ACD, Santos JCC, Souza LF, Oliveira OCG, Proto RS. Pregnancy in teenagers under 16 years old: perinatal adversities. Einstein. 2005;3(1):6-13.
8. SINASC. Sistema de informação de nascidos vivos. [Internet]. São Paulo Sec Mun Saúde, 1992 [citado 2006 Jul 20]. Disponível em: http://portal.prefeitura. sp.gov.br/secretarias/saude/tabnet/0011
9. Cochran, WG. Some methods for strengthening the common χ2 test.
Biometrics. 1954;10:417-51.
10. Rosso P, Kava R. Effects of food restriction on cardiac out put and blood flow to the utero and placenta in the pregnant rat. J Nutr. 1980;110:2350-4. 11. Winick M. Some speculation on mechanisms involved in the effects of
undernutrition on cellular growth. In: Seminar of malnutrition in early life and subsequent mental development, Jamaica. Nutrition, the nervous system and behavior. Proceedings: DCPAHO; 1972. p. 24 [PAHO, Scientific Publication, 251]. 12. Beiguelman B, Colletto GMDD, Franchi-PintoC, Krieger H. Birth weight of twins:
2. Fetal genetic on birth weight. Genet Mol Biol. 1988;21(1):155-8. 13. Segre CAM, Colletto GM, Bertagnon JRD. Intrauterine growth curves of a
high-income population. Acta Med Auxiol. 2001;33(3):151-7.
14. Chemello CS. Perfil epidemiológico das adolescentes grávidas na cidade de São Marcos, RS [tese]. São Paulo: Faculdade de Saúde Pública da Universidade de São Paulo; 1999.
15. Torres MS, Bertagnon JRDB, Carignani J, Staveropoulos RG. Estudo perinatal das adolescentes no Hospital Geral do Grajaú, São Paulo, SP [abstract]. In: 29o
Congresso Brasileiro de Neonatologia. Florianópolis (SC); 2001.
16. Christian P. Prenatal origins of undernutrition. Nestle Nutr Workshop Ser Pediatr Program. 2009;63:59-73.
17. Segre CAM, Colletto GM, Rielli ST. Intrauterine growth curves of twins: effects of socioeconomic level. Einstein. 2005;3(1):5-8.
18. Segre CAM, Bertagnon JRD. Restrição de crescimento intrauterino. In: Segre CAM, Costa HPF, Lippi UG, editors. Perinatologia. Fundamentos e prática. 2a ed. São Paulo: Sarvier; 2009. p.188-94.