a systematic review and meta-analysis*
Correspondence:
Maria Elizete de Almeida Araújo – Universidade de Brasília, Programa de Pós-Graduação em Ciências da Saúde, Faculdade de Medicina, Campus Universitário Darcy Ribeiro, Conjunto 16, Sala 77, Asa Norte, Brasília-DF, Brasil. CEP: 70910-900
E-mail: [email protected] Maria Elizete de Almeida Araújo1 Marcus Tolentino Silva2
Keitty Regina Cordeiro de Andrade3 Taís Freire Galvão4
Maurício Gomes Pereira5
1Universidade de Brasília, Programa de Pós-Graduação em Ciências da Saúde, Brasília-DF, Brasil
2Universidade Federal do Amazonas, Faculdade de Medicina, Manaus-AM, Brasil
3Universidade de Brasília, Programa de Pós-Graduação em Ciências Médicas, Brasília-DF, Brasil 4Universidade Estadual de Campinas, Faculdade de Ciências Farmacêuticas, Campinas-SP, Brasil 5Universidade de Brasília, Faculdade de Medicina, Brasília-DF, Brasil
Abstract
Objective: to analyze the prevalence of use of health services in Brazil. Methods: systematic review and meta-analysis of population-based cross-sectional studies; MEDLINE, EMBASE, other sources, and microdata of surveys were searched; two researchers selected the studies, extracted the data and assessed methodological quality to include in the meta-analysis.
Results: from 1,979 retrieved references, 27 studies were included; the prevalence of medical visits in the previous year was 71% (confidence interval of 95% [95%CI] = 69; 73%; I2=99%); the proportion of women in each study (p=0.001; R2=25%) and the recall period (p>0.001; R2= 72%) contributed to the heterogeneity; prevalence of dental consultation was 37% (95%CI = 32; 42%; I2=100%), and of hospitalization, 10% (95%CI = 9; 11%; I2=98%), in the last year. Conclusion: more than half of the population had at least one medical visit, about one-third had a dental consultation and a tenth was hospitalized in the previous year.
Keywords: Health Services; Prevalence; Review Literature as Topic; Meta-Analysis as Topic.
doi: 10.5123/S1679-49742017000300016
Introduction
The use of health services is directly associated to the individuals’ needs, services' offer, financial and health professional resources, and to socioeconomic and cultural conditions.1,2 It is important to distinguish
‘use’ from ‘access’ – which is sometimes employed as a synonym for use –, considering the use of the health service by the individual as a proof of access.3 However,
access is related to opportunity, whereas utilization is the demonstration of this opportunity.3
In Brazil, the utilization of health services depends on three types of provision: public, private and supplementary. The public sector is the main provider, funded by the State in the federal, state and municipal levels.4,5 Besides the
services offered directly by the public health system, the private network also performs specific services for the Brazilian National Health System (SUS). The other types – private health insurance and direct disbursement – are also co-funded by the Government, through transfer of public resources – and other types of transfers of resources – to private institutions.4,5
It is essential to monitor the use of health services in order to compare the changes in health status, and help decision makers in the promotion of improvements and rearrangements of health services, either regarding physical facilities, acquisition of equipment and inputs, or to hire human resources.3,4 Studies on this topic have
special relevance, especially in contexts in financial constraints whilst the demand for assistance increases.
The measurement of the health services utilization is also a diagnose tool, used as indirect measure of access. The World Health Organization (WHO) recommends the assessment of the general level of health, the distribution of health among the population, the capacity of response and financial allocation.6 In Brazil, such measures are
conducted through population-based surveys, developed by official institutes or individual researchers.7 The
institutional researches began in 1990 and, nowadays, are the main instrument that guides the development and assessment of public health policies. By using self-reported responses, it is possible to measure the use of health services in all Brazilian regions.8
Currently, there is no summarization of these studies in the country that could enable a comparison between the findings. In this sense, systematic reviews are strategic to summarize the data and project better estimates for decision making in the health area.9
The objective of this study was to estimate the prevalence of health services utilization in Brazil, through a systematic review with meta-analysis of population-based surveys.
Methods
Design and protocol register
We conducted a systematic review with meta-analysis of population-based surveys. The study protocol was recorded in the International Prospective Register of Systematic Reviews (PROSPERO), number CRD42015016648. The report of this systematic review meets Preferred Reporting Items for Systematic Reviews and Meta-Analyses (PRISMA).10
Eligibility criteria
The eligible studies were population-based cross-sectional studies conducted in Brazil which described the prevalence of medical, dental visits, and hospitalizations. There were no restrictions regarding age, sex, health professional, and date of service use. Neither there were limits concerning the language of the study, type or year of publication.
Studies conducted in specific population groups, such as institutionalized people, indigenous and pregnant women, and those restricted to primary health care were excluded.
Information sources and search strategies
We searched for studies in the following bibliographic databases: MEDLINE, Scopus, EMBASE, Latin American and Caribbean Center on Health Sciences Information (LILACS), and Scientific Electronic Library Online (SciELO). We examined the references' list of relevant studies and contacted specialists as needed. Moreover, the following data provided by national surveys were included: National Household Sample Survey (PNAD), National Health Survey (PNS) and National Survey on Dental Health (SB Brasil).
The searches were updated up to January 2017. The strategies for each database are reported in a supplementary file (Supplementary Figure 1).
The measurement of the health services
Studies selection and data extraction
For the studies selection and data extraction, we used the Covidence system.11 After excluding the duplicate
records, two independent researchers (Araújo MEA and Andrade KRC) selected the manuscripts based on the title and abstract, following the pre-defined criteria of inclusion and exclusion. Disagreements were resolved by consensus or by a third researcher (Silva MT).
Then, the full texts were gathered for assessment. References which reported results from a same survey were assessed, so the study included would be the one that presented and most detailed data so the others could be excluded.
The following data were extracted from the studies: author; year; place; sample size; sex; age group; use of health services; and recall period. In cases of disagreement, the decision was taken by consensus. Whenever there was access to microdata, we gathered data from people of 18 years or over and excluded the proxy-respondents. When the data were not available, we contacted the corresponding author of the included study.
Assessment of methodological quality of the studies included
The methodological quality was assessed individually and independently, by the aforementioned researchers. Eight criteria were assessed, based on a previously developed tool:12 (i) random or census sample; (ii)
sample list from a demographic census; (iii) sample size, previously calculated; (iv) outcome measurement by a validated tool; (v) unbiased assessment by trained interviewers; (vi) response rate equal or higher than 70%; (vii) report of 95% confidence interval (95%CI) and analysis of subgroups; and (viii) descriptions of the study subjects. Each fulfilled item received punctuation from 0 to 8. In the present review, the surveys were considered of high quality when they obtained score ≥6.
Data analysis
The primary outcome was the use of health services: medical visit, dental visit and hospitalization. The prevalence of use of health services was calculated for each service, with 95% confidence interval (95%CI), per country region, taking into account the recall periods for each included study. The variable related to the use
of any health service, measured on PNAD 2003 and 2008 and PNS 2013 was not considered.
Single studies were grouped in meta-analysis of random effect, by the method proposed by DerSimonian and Laird.13 The heterogeneity between the studies was
analyzed by the fixed effect model of inverse variance; and the magnitude of inconsistency, estimated by the I-squared statistics (I2).14 We investigated heterogeneity
by meta-regressions, using Knapp and Hartung test, which evaluated the effect of the following variables: proportion of women; recall period; year of data collection; and region of study. The small-study effect was assessed through the visual check of the funnel graph and Egger test.15
All the analyses were performed at Stata platform (version 14.0). The commands ‘metaprop’ and ‘metareg’ were used.16
Results
Studies selection
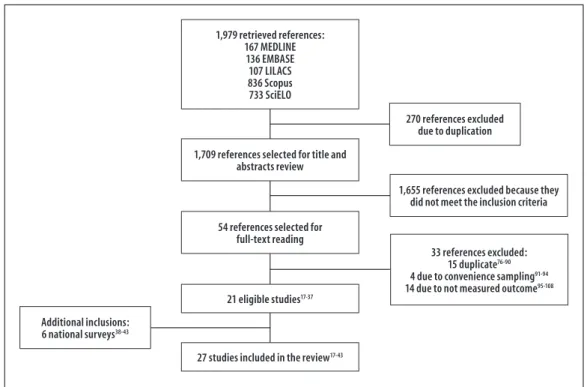
The search strategy found 1,979 records, of which 270 were duplicate. After screening the titles and abstracts, 54 manuscripts were selected for full text reading. Of those, 21 studies met the eligibility criteria17-37 and six institutional surveys
were identified and included: PNAD 1998, 2003 and 2008; PNS 2013; and SB Brasil 2003 and 2010.38-43
Thus, there was a total of 27 researches for meta-analysis.17-43 The selection process is detailed in
Figure 1.
Most surveys had data collection from 2000 to 2010, and 11 of them were published between 2011 and 2014.17,28,29,31-36,42,43 Seven researches had
national coverage,31,38-43 ten investigated data from
the Northeast region,18,22,23,27,28,35,38,39,41,43 15 from
the South17,20,21,24-26,29,30,33,34,37-39,41,43 six from the
Southeast19,32,38,39,41,43 five from the Midwest36,38,39,41,43
and four from the North.38,39,41,43
Most of the 702,878 people included in the 27 researches were women (58%). Three studies did not provide data on sex.18,28,42 Most studies were about
the adults’ health, whilst some restricted their target-population to elderly19,20,32,34 and children.22
Methodological quality of the studies
All the studies used probabilistic and complex sampling procedures, based on the calculation of the sample size. The outcomes – use of health services – were assessed by trained interviewers. All the surveys collected self-reported information about the use of health services. Proportions of response rate higher than 70% were informed in 17 of the 27 studies. Five single surveys did not inform refusals or losses.18,27,28,35,37 Twenty studies were considered of high
methodological quality, with average global score of 6.6. No study was excluded due to the methodological quality. The critical evaluation of the individual quality can be found in the Supplementary Table 1.
Prevalence of use of health services
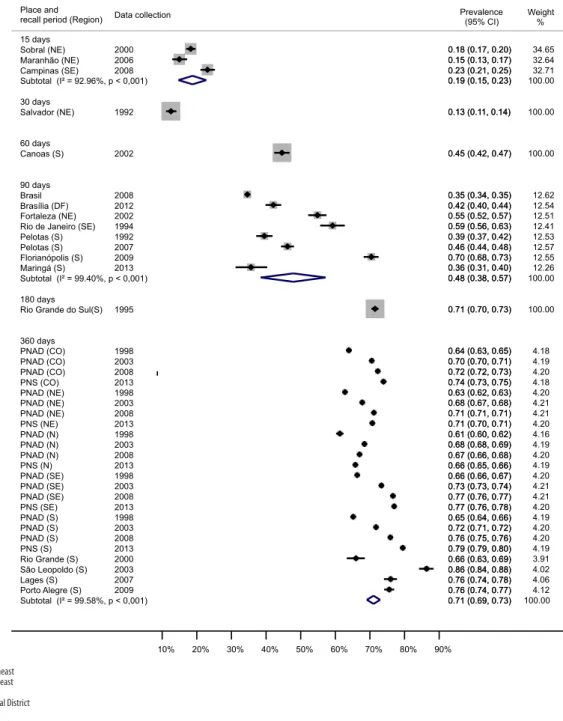
Figure 2 presents the prevalences of medical visits found in the 18 studies,17-20,22-25,27,29-34,36,37,44 in the three
PNAD and PNS,38,39,41,43 stratified by region, covering
549,999 interviewed individuals. Forty-eight per cent (95%CI=39 to 57; I2=99%) of the interviewed
individuals reported having been to the doctor in the previous 90 days. Those studies were of local coverage and two of them assessed the frequency in elderly people, reporting higher prevalence of medical care
(59 to 70%). Considering the studies that verified the use of medical visits in the period of one year prior to the interview, the frequency of use was of 71% (95%CI=69 to 73%; I2=99%), and most of these
studies had national coverage. Four single studies, conducted in the South region, presented prevalences consistent with national surveys for that region. In approximately one decade (2010 to 2013) a reduction in the prevalence of medical visits of 2 percentage points (pp) in the North region was observed; on the other hand, there was an increase in the other regions. The South region presented the highest increase for the period.
In the only study that focused on the age group from 5 to 9 years, conducted in Sobral, Ceará State, the researchers assessed the medical visits occurred in the previous 15 days, and an 18% prevalence was observed (95%CI=17 to 20%).22 The studies that
focused on the elderly population measured medical visits in the previous two weeks (Campinas, 23% [95%CI= 21 to 25%]),32 three months (municipalities
of Rio de Janeiro, 59% [95%CI= 56 to 63%];19 and
Florianópolis, 70% [95%CI = 68 to 73%])34, and six
months (Rio Grande do Sul State, 71% [95%CI= 70 to 73%]).20
Figure 1 – Search, selection and studies inclusion process
1,979 retrieved references: 167 MEDLINE
136 EMBASE 107 LILACS 836 Scopus 733 SciELO
1,709 references selected for title and abstracts review
54 references selected for full-text reading
21 eligible studies17-37
27 studies included in the review17-43
270 references excluded due to duplication
1,655 references excluded because they did not meet the inclusion criteria
33 references excluded: 15 duplicate76-90
4 due to convenience sampling91-94
14 due to not measured outcome95-108
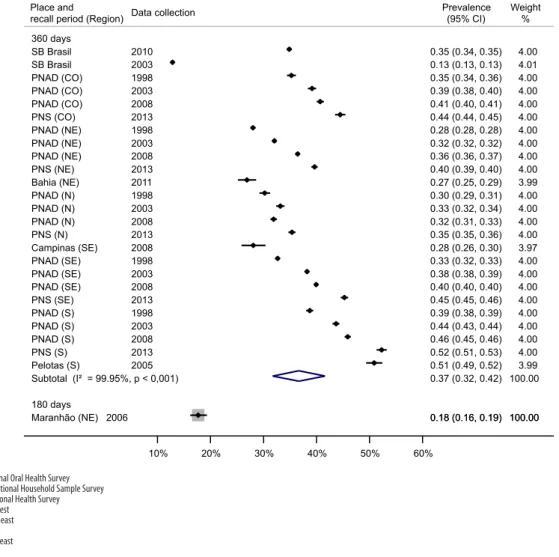
With regard to dental visits, 659,043 individuals were interviewed in six national surveys (PNAD 1998, 2003 and 2008; PNS 2013; and SB Brasil 2003, and 2010)38-43 and four individual studies (municipality of
Pelotas 2005;26 Maranhão State 2006;28 municipality of
Campinas 2008;32 and Bahia State 201135). A total of
37% of the population (95%CI= 32 to 42%; I2=100%)
had been to the dentist in the previous year. From 2003 to 2013, there was an eight pp. increase in dental visits in the Northeast and South regions, and a two pp. decrease in the North region (Figure 3).
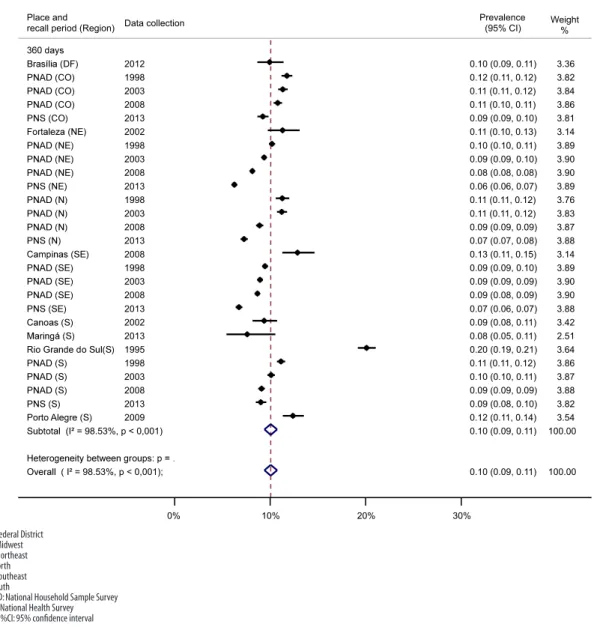
Eleven surveys measured hospitalization, with the participation of 520,261 individuals.20,23,24,32,33,36-39,41,43
We observed that 10% of the interviewed individuals
NE: Northeast SE: Southeast S: South DF: Federal District N: North CO: Midwest
PNAD: National Household Sample Survey a) 95%CI: 95% confidence interval
Figure 2 – Prevalence of medical visits per recall period and stratified by Brazilian region
15 days Sobral (NE) Maranhão (NE) Campinas (SE)
Subtotal (I² = 92.96%, p < 0,001)
30 days Salvador (NE) 60 days Canoas (S) 90 days Brasil Brasília (DF) Fortaleza (NE) Rio de Janeiro (SE) Pelotas (S) Pelotas (S) Florianópolis (S) Maringá (S)
Subtotal (I² = 99.40%, p < 0,001)
180 days Rio Grande do Sul(S)
360 days PNAD (CO) PNAD (CO) PNAD (CO) PNS (CO) PNAD (NE) PNAD (NE) PNAD (NE) PNS (NE) PNAD (N) PNAD (N) PNAD (N) PNS (N) PNAD (SE) PNAD (SE) PNAD (SE) PNS (SE) PNAD (S) PNAD (S) PNAD (S) PNS (S) Rio Grande (S) São Leopoldo (S) Lages (S) Porto Alegre (S)
Subtotal (I² = 99.58%, p < 0,001) Place and
recall period (Region)
2000 2006 2008 1992 2002 2008 2012 2002 1994 1992 2007 2009 2013 1995 1998 2003 2008 2013 1998 2003 2008 2013 1998 2003 2008 2013 1998 2003 2008 2013 1998 2003 2008 2013 2000 2003 2007 2009 Data collection
0.18 (0.17, 0.20) 0.15 (0.13, 0.17) 0.23 (0.21, 0.25) 0.19 (0.15, 0.23)
0.13 (0.11, 0.14)
0.45 (0.42, 0.47)
0.35 (0.34, 0.35) 0.42 (0.40, 0.44) 0.55 (0.52, 0.57) 0.59 (0.56, 0.63) 0.39 (0.37, 0.42) 0.46 (0.44, 0.48) 0.70 (0.68, 0.73) 0.36 (0.31, 0.40) 0.48 (0.38, 0.57)
0.71 (0.70, 0.73)
0.64 (0.63, 0.65) 0.70 (0.70, 0.71) 0.72 (0.72, 0.73) 0.74 (0.73, 0.75) 0.63 (0.62, 0.63) 0.68 (0.67, 0.68) 0.71 (0.71, 0.71) 0.71 (0.70, 0.71) 0.61 (0.60, 0.62) 0.68 (0.68, 0.69) 0.67 (0.66, 0.68) 0.66 (0.65, 0.66) 0.66 (0.66, 0.67) 0.73 (0.73, 0.74) 0.77 (0.76, 0.77) 0.77 (0.76, 0.78) 0.65 (0.64, 0.66) 0.72 (0.71, 0.72) 0.76 (0.75, 0.76) 0.79 (0.79, 0.80) 0.66 (0.63, 0.69) 0.86 (0.84, 0.88) 0.76 (0.74, 0.78) 0.76 (0.74, 0.77) 0.71 (0.69, 0.73) Prevalence (95% CI) 34.65 32.64 32.71 100.00 100.00 100.00 12.62 12.54 12.51 12.41 12.53 12.57 12.55 12.26 100.00 100.00 4.18 4.19 4.20 4.18 4.20 4.21 4.21 4.20 4.16 4.19 4.20 4.19 4.20 4.21 4.21 4.20 4.19 4.20 4.20 4.19 3.91 4.02 4.06 4.12 100.00 0.18 (0.17, 0.20) 0.15 (0.13, 0.17) 0.23 (0.21, 0.25) 0.19 (0.15, 0.23)
0.13 (0.11, 0.14)
0.45 (0.42, 0.47)
0.35 (0.34, 0.35) 0.42 (0.40, 0.44) 0.55 (0.52, 0.57) 0.59 (0.56, 0.63) 0.39 (0.37, 0.42) 0.46 (0.44, 0.48) 0.70 (0.68, 0.73) 0.36 (0.31, 0.40) 0.48 (0.38, 0.57)
0.71 (0.70, 0.73)
0.64 (0.63, 0.65) 0.70 (0.70, 0.71) 0.72 (0.72, 0.73) 0.74 (0.73, 0.75) 0.63 (0.62, 0.63) 0.68 (0.67, 0.68) 0.71 (0.71, 0.71) 0.71 (0.70, 0.71) 0.61 (0.60, 0.62) 0.68 (0.68, 0.69) 0.67 (0.66, 0.68) 0.66 (0.65, 0.66) 0.66 (0.66, 0.67) 0.73 (0.73, 0.74) 0.77 (0.76, 0.77) 0.77 (0.76, 0.78) 0.65 (0.64, 0.66) 0.72 (0.71, 0.72) 0.76 (0.75, 0.76) 0.79 (0.79, 0.80) 0.66 (0.63, 0.69) 0.86 (0.84, 0.88) 0.76 (0.74, 0.78) 0.76 (0.74, 0.77) 0.71 (0.69, 0.73)
Weight %
(95%CI= 9 to 11%; I2=98%) had been hospitalized in
the year before the surveys. There was a reduction in the prevalence of hospitalization in all the country regions – higher reduction in the North, with four pp. and lower in the South, with one pp. –, from 2003 to 2013 (Figure 4).
Assessment of heterogeneity and small study effect
All the meta-analyses presented high heterogeneity. With regard to medical visits, the variables ‘proportion of women’ (p=0.001; R2=25%) (Supplementary
Figure 2) and ‘recall period’ (p>0.001; R2=72%)
(Supplementary Figure 3) contributed the higher variability of the prevalences.
Concerning the dental visits, the Midwest (p=0.012), Southeast (p=0.031) and South (p=0.001) regions
contributed to a higher heterogeneity, and 45% of this variability could be explained by these regions. The year of data collection of the surveys was related to higher variation in the prevalences of hospitalization (p=0.001; R2=36%) (Supplementary Figure 4).
The visual inspection of the funnel graph about prevalence of medical visits in the previous year revealed asymmetry in the distribution of studies (Supplementary Figure 5); however, the small studies effect was discarded by Egger test (p=0.841). For the group of studies with other recall periods, it was not possible to estimate the presence of this effect due to the need to gather at least ten studies to perform it. In turn, the presence of this effect has probably influenced the result for dental visits (p>0.001) and hospitalizations (p=0.007; Supplementary Figures 6 and 7).
SB: National Oral Health Survey PNAD: National Household Sample Survey PNS: National Health Survey CO: Midwest
NE: Northeast N: North SE: Southeast S: South
a) 95%CI: 95% confidence interval
Figure 3 – Prevalence of dental visits per recall period and stratified by Brazilian region
360 days SB Brasil SB Brasil PNAD (CO) PNAD (CO) PNAD (CO) PNS (CO) PNAD (NE) PNAD (NE) PNAD (NE) PNS (NE) Bahia (NE) PNAD (N) PNAD (N) PNAD (N) PNS (N) Campinas (SE) PNAD (SE) PNAD (SE) PNAD (SE) PNS (SE) PNAD (S) PNAD (S) PNAD (S) PNS (S) Pelotas (S)
Subtotal (I² = 99.95%, p < 0,001)
180 days
Maranhão (NE) Place and recall period (Region)
2010 2003 1998 2003 2008 2013 1998 2003 2008 2013 2011 1998 2003 2008 2013 2008 1998 2003 2008 2013 1998 2003 2008 2013 2005 2006 Data collection
0.35 (0.34, 0.35) 0.13 (0.13, 0.13) 0.35 (0.34, 0.36) 0.39 (0.38, 0.40) 0.41 (0.40, 0.41) 0.44 (0.44, 0.45) 0.28 (0.28, 0.28) 0.32 (0.32, 0.32) 0.36 (0.36, 0.37) 0.40 (0.39, 0.40) 0.27 (0.25, 0.29) 0.30 (0.29, 0.31) 0.33 (0.32, 0.34) 0.32 (0.31, 0.33) 0.35 (0.35, 0.36) 0.28 (0.26, 0.30) 0.33 (0.32, 0.33) 0.38 (0.38, 0.39) 0.40 (0.40, 0.40) 0.45 (0.45, 0.46) 0.39 (0.38, 0.39) 0.44 (0.43, 0.44) 0.46 (0.45, 0.46) 0.52 (0.51, 0.53) 0.51 (0.49, 0.52) 0.37 (0.32, 0.42)
0.18 (0.16, 0.19) Prevalence (95% CI) 4.00 4.01 4.00 4.00 4.00 4.00 4.00 4.00 4.00 4.00 3.99 4.00 4.00 4.00 4.00 3.97 4.00 4.00 4.00 4.00 4.00 4.00 4.00 4.00 3.99 100.00 100.00 0.18 (0.16, 0.19) 100.00 Weight %
H
O ² = 98.53%, p < 0,001);
P
C
PCO
R
Place and recall period (Region)
B P P F C P P P M P P P
P CO
P
² = 98.53%, p < 0,001)
P P P P P
P CO
P P 3!" P CO 2008 2008 2013 1995 Data collection 2012 2008 1998 2002 2002 2008 2003 2013 2013 2003 2003 1998 1998 2013 2008 1998 2003 2013 1998 2003 2013 2009 2008
0.10 (0.09, 0.11) 0.09 (0.08, 0.09) 0.13 (0.11, 0.15) 0.09 (0.09, 0.10)
0.20 (0.19, 0.21) Prevalence
(95% CI)
0.10 (0.09, 0.11)
0.09 (0.09, 0.09) 0.11 (0.11, 0.12) 0.11 (0.10, 0.13)
0.09 (0.08, 0.11) 0.09 (0.09, 0.09) 0.11 (0.11, 0.12) 0.06 (0.06, 0.07)
0.08 (0.05, 0.11) 0.09 (0.09, 0.09)
0.10 (0.10, 0.11) 0.10 (0.10, 0.11) 0.12 (0.11, 0.12)
0.07 (0.07, 0.08)
0.10 (0.09, 0.11) 0.08 (0.08, 0.08)
0.11 (0.11, 0.12) 0.09 (0.09, 0.10)
0.07 (0.06, 0.07) 0.09 (0.09, 0.10) 0.11 (0.11, 0.12)
0.09 (0.08, 0.10) 0.12 (0.11, 0.14) 0.11 (0.10, 0.11)
100.00 3.90 3.14 3.81 3.64 Weight % 3.36 3.88 3.76 3.14 3.42 3.87 3.83 3.89 2.51 3.90 3.87 3.89 3.82 3.88 100.00 3.90 3.86 3.90 3.88 3.89 3.84 3.82 3.54 3.86
0% 10% 20% 30%
DF: Federal District CO: Midwest NE: Northeast N: North SE: Southeast S: South
PNAD: National Household Sample Survey PNS: National Health Survey a) 95%CI: 95% confidence interval
Figure 4 – Prevalence of hospitalizations per recall period and stratified by Brazilian region
Discussion
The results show that for every 100 Brazilians, 71 had been to the doctor, 37 to the dentist, and ten had been hospitalized in the year prior to the survey, after analyzing the results of 27 researches whose data were collected from 1992 to 2013. Except for the North region, in a ten year period (2003-2013), we observed an increase in medical and dental visits. The prevalence of hospitalization reduced in all Brazillian regions, for the same period. Most surveys of local coverage were conducted in the South and Southeast regions of Brazil.
Although there was a broad and extensive search, it is possible that some surveys have not been identified,
such as those that measure the use of health services as a secondary outcome. This may have occurred in both the search strategy and the title and abstract screening. The small study effect (publication bias) was discarded by Egger test for medical visits in the previous year, but it was confirmed for dental visits and hospitalizations. Thus, smaller and least accurate studies influenced on the results.45
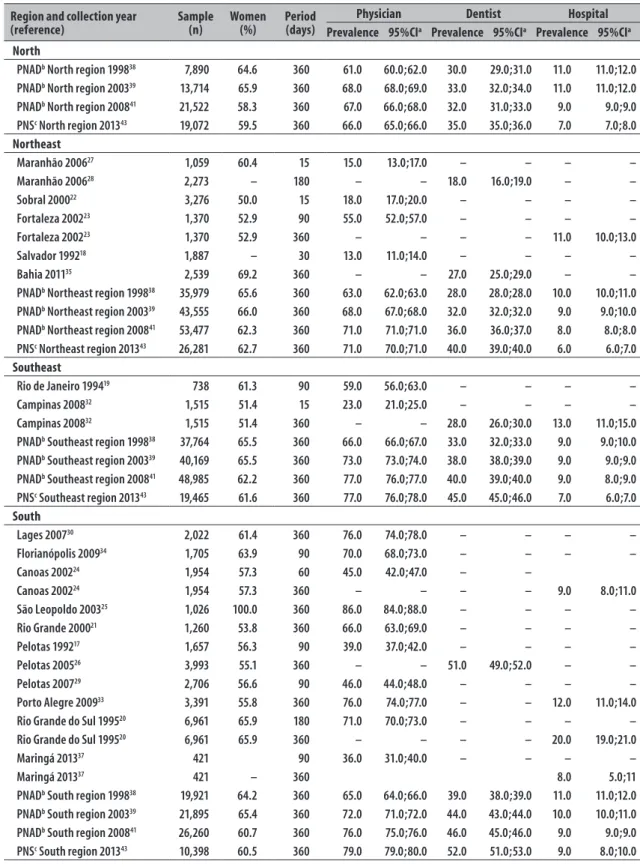
Table 1 – Characteristics of the included studies
Region and collection year
(reference) Sample (n) Women (%) Period (days)
Physician Dentist Hospital
Prevalence 95%CIa Prevalence 95%CIa Prevalence 95%CIa North
PNADb North region 199838 7,890 64.6 360 61.0 60.0;62.0 30.0 29.0;31.0 11.0 11.0;12.0
PNADb North region 200339 13,714 65.9 360 68.0 68.0;69.0 33.0 32.0;34.0 11.0 11.0;12.0
PNADb North region 200841 21,522 58.3 360 67.0 66.0;68.0 32.0 31.0;33.0 9.0 9.0;9.0
PNSc North region 201343 19,072 59.5 360 66.0 65.0;66.0 35.0 35.0;36.0 7.0 7.0;8.0
Northeast
Maranhão 200627 1,059 60.4 15 15.0 13.0;17.0 – – – –
Maranhão 200628 2,273 – 180 – – 18.0 16.0;19.0 – –
Sobral 200022 3,276 50.0 15 18.0 17.0;20.0 – – – –
Fortaleza 200223 1,370 52.9 90 55.0 52.0;57.0 – – – –
Fortaleza 200223 1,370 52.9 360 – – – – 11.0 10.0;13.0
Salvador 199218 1,887 – 30 13.0 11.0;14.0 – – – –
Bahia 201135 2,539 69.2 360 – – 27.0 25.0;29.0 – –
PNADb Northeast region 199838 35,979 65.6 360 63.0 62.0;63.0 28.0 28.0;28.0 10.0 10.0;11.0
PNADb Northeast region 200339 43,555 66.0 360 68.0 67.0;68.0 32.0 32.0;32.0 9.0 9.0;10.0
PNADb Northeast region 200841 53,477 62.3 360 71.0 71.0;71.0 36.0 36.0;37.0 8.0 8.0;8.0
PNSc Northeast region 201343 26,281 62.7 360 71.0 70.0;71.0 40.0 39.0;40.0 6.0 6.0;7.0
Southeast
Rio de Janeiro 199419 738 61.3 90 59.0 56.0;63.0 – – – –
Campinas 200832 1,515 51.4 15 23.0 21.0;25.0 – – – –
Campinas 200832 1,515 51.4 360 – – 28.0 26.0;30.0 13.0 11.0;15.0
PNADb Southeast region 199838 37,764 65.5 360 66.0 66.0;67.0 33.0 32.0;33.0 9.0 9.0;10.0
PNADb Southeast region 200339 40,169 65.5 360 73.0 73.0;74.0 38.0 38.0;39.0 9.0 9.0;9.0
PNADb Southeast region 200841 48,985 62.2 360 77.0 76.0;77.0 40.0 39.0;40.0 9.0 8.0;9.0
PNSc Southeast region 201343 19,465 61.6 360 77.0 76.0;78.0 45.0 45.0;46.0 7.0 6.0;7.0
South
Lages 200730 2,022 61.4 360 76.0 74.0;78.0 – – – –
Florianópolis 200934 1,705 63.9 90 70.0 68.0;73.0 – – – –
Canoas 200224 1,954 57.3 60 45.0 42.0;47.0 – –
Canoas 200224 1,954 57.3 360 – – – – 9.0 8.0;11.0
São Leopoldo 200325 1,026 100.0 360 86.0 84.0;88.0 – – – –
Rio Grande 200021 1,260 53.8 360 66.0 63.0;69.0 – – – –
Pelotas 199217 1,657 56.3 90 39.0 37.0;42.0 – – – –
Pelotas 200526 3,993 55.1 360 – – 51.0 49.0;52.0 – –
Pelotas 200729 2,706 56.6 90 46.0 44.0;48.0 – – – –
Porto Alegre 200933 3,391 55.8 360 76.0 74.0;77.0 – – 12.0 11.0;14.0
Rio Grande do Sul 199520 6,961 65.9 180 71.0 70.0;73.0 – – – –
Rio Grande do Sul 199520 6,961 65.9 360 – – – – 20.0 19.0;21.0
Maringá 201337 421 90 36.0 31.0;40.0 – – – –
Maringá 201337 421 – 360 8.0 5.0;11
PNADb South region 199838 19,921 64.2 360 65.0 64.0;66.0 39.0 38.0;39.0 11.0 11.0;12.0
PNADb South region 200339 21,895 65.4 360 72.0 71.0;72.0 44.0 43.0;44.0 10.0 10.0;11.0
PNADb South region 200841 26,260 60.7 360 76.0 75.0;76.0 46.0 45.0;46.0 9.0 9.0;9.0
PNSc South region 201343 10,398 60.5 360 79.0 79.0;80.0 52.0 51.0;53.0 9.0 8.0;10.0
Table 1 – Conclusion
Region and collection year
(reference) Sample (n) Women (%) Period (days)
Physician Dentist Hospital
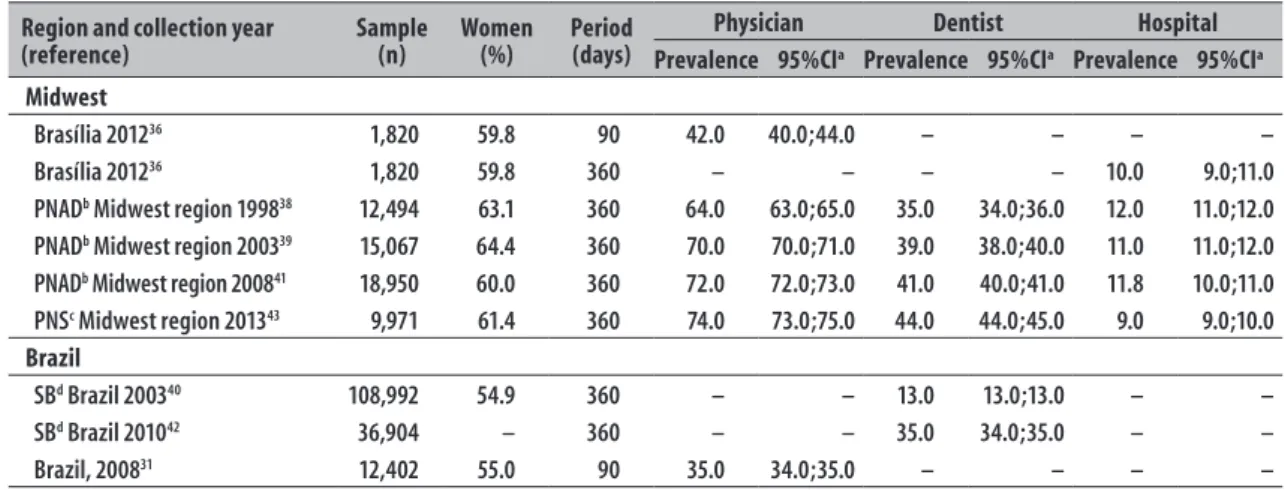
Prevalence 95%CIa Prevalence 95%CIa Prevalence 95%CIa Midwest
Brasília 201236 1,820 59.8 90 42.0 40.0;44.0 – – – –
Brasília 201236 1,820 59.8 360 – – – – 10.0 9.0;11.0
PNADb Midwest region 199838 12,494 63.1 360 64.0 63.0;65.0 35.0 34.0;36.0 12.0 11.0;12.0
PNADb Midwest region 200339 15,067 64.4 360 70.0 70.0;71.0 39.0 38.0;40.0 11.0 11.0;12.0
PNADb Midwest region 200841 18,950 60.0 360 72.0 72.0;73.0 41.0 40.0;41.0 11.8 10.0;11.0
PNSc Midwest region 201343 9,971 61.4 360 74.0 73.0;75.0 44.0 44.0;45.0 9.0 9.0;10.0
Brazil
SBd Brazil 200340 108,992 54.9 360 – – 13.0 13.0;13.0 – –
SBd Brazil 201042 36,904 – 360 – – 35.0 34.0;35.0 – –
Brazil, 200831 12,402 55.0 90 35.0 34.0;35.0 – – – –
a) 95%CI: 95% confidence interval b) PNAD: National Household Sample Survey c) PNS: National Health Survey d) SB: Dental Health
United States).46 In Brazil, the reliability of this type of
information in the public branch may be tracked with the adoption of the National Health Card.47
Another important limitation of present study is the two decades difference between some of the surveys included. During this period, there were demographic and economic changes that provided better living conditions to Brazilians, higher offer of public services and, consequently, longer lifespan in the population.48
Aging is a factor that increases the search for health services,49 which is neglected by the younger population.50
However, most studies present characteristics that show better reliability. The surveys used census information as sampling sources, calculated the sample size and achieved good response rates. In this review, the selection and extraction were performed by two researchers, independently, and one critical assessment tool was used to check the quality of the studies.12
Some parameters analyzed in the meta-regression stood out as possible sources of heterogeneity: proportion of women, recall period and year of data collection. Higher prevalences are observed in longer recall periods,51 which also results in higher
probability of individuals to forget to report the use of a health service. The high heterogeneity limits the external validity of the results.52,53
There is no consensus in literature regarding the validity and accuracy of self-reported data in the use of health services. Self-report depends on cognitive factors; for instance, diseases such as dementia and
mental problems influence on the capacity of a person to remember some information.54
A review that included 42 studies about validity of self-report in the use of health services points to strategies to improve the accuracy of assessment:55
surveys with commemorative days; and inclusion of two recall intervals (one long and another more recent). By analyzing the results of studies that compared the self-report and records, this review pointed that self-self-report of medical visit has higher inaccuracy in long recall periods than in short ones (the accuracy was of 60% to recall a medical visit in the previous three months, against 20% in the previous 12 months).55
The recall bias reduces the accuracy of the individuals’ answers and is attributed to individual factors, such as age, education level and socioeconomic status.56
Important events, which is the case of hospitalizations, are measured with more accuracy than routine events, such as medical prescription, search for a specialist, or a medical or dental visit.57 A cohort study, conducted
in Australia found underestimation of self-reported medical visits in the previous years, comparing to the information recorded by the health insurance, possibly due to recall bias;58 the individuals in the study were
over 74 years old, which may have led to confounding, because elderly people forget things more often than younger individuals.
period was defined as 360 days.3 At the same time, a
study from WHO adopted a 30 day period for surveys conducted in low-income countries.59 In Brazil, most
of local studies, conducted by individual researchers used 90 days as the recall period, whilst researches of national coverage (PNAD, PNS and SB-Brasil) used 360 days.
A German study compared results of surveys conducted between the years of 1991 and 2009, involving all the age groups, and, when considering the recall period of 12 months, they found a prevalence between 70 and 86% of medical visits; in the previous 90 days, between 67 and 66%; and in the previous 30 days, a proportion higher than 29%.60 In the United Kingdom, in 2012,
the frequency of medical visits in the previous 15 days was of 45%.61
Other cross-sectional studies, involving specific groups, were carried out in different contexts. In Iran, in 2012, researchers observed that 61% of the women had used health services in the previous 12 months.62
An analysis of four surveys conducted in Spain, from 2001 to 2009, pointed an increase in medical visits by elderly individuals in the previous 30 days. From 40 to 53%, among women, and from 32 to 48% among men.49
Among the elderly people who used the Mexican social security in 2003, 88% had been to the doctor for curative medicine, and 70% for preventive in the previous 360 days.63 In Cuba, in 2010, among the individuals who
presented health problems in the previous 30 days, 54% had been to a general practitioner.64 A survey
from 2003, involving Canadians and Americans, older than 18 who had any type of disability presented a self-reported frequency of medical visits in the previous 12 months superior to 80%.65
Around one third of the Brazilian population had been to the dentist the year before the survey, from 2003 to 2013. Although there is no evidence on the adequate periodicity to visit a health professional,66
the proportion revealed shows that most part of the population does not go to the dentist every six months, which is traditionally recommended. The low frequency of dental visits by the Brazilian population possibly brings negative outcomes in dental health. Data of health insurance users from Michigan, United States, showed that the rate of tooth loss was much higher among those who had been only once to the dentist in the previous year, when compared to individuals who went at least twice in the same period.67
An analysis of secondary data related to a population-based survey conducted in Canada from 2007 to 2009, with 5,600 individuals aged between 6 and 79, observed that 75% of them had been to the dentist in the previous years; even with this high use, 34% needed dental care, 6% of them, urgently. 68 Data
of the 2015 National Health Interview Survey, from the United States, pointed to a prevalence of 62% of dentist visits the previous year.69 In 2012, in the
United Kingdom, a survey looked into the regular and occasional dental visits: 38% frequently went to the dentist, 44% of them due to symptomatic reasons.61
From 1995 to 2013, about 10% of the Brazilians had been hospitalized in the previous year. In high income countries, where life expectancy is higher, such as Germany, this prevalence varied from 9 to 15% in the previous 12 months, according to surveys comparability.60 In Cuba, 2010 data suggest that among
elderly individuals who presented health problems, 29% were hospitalized in the previous 30 days.64 As we can
see, the prevalences of medical visit and hospitalization in Brazil, in the previous year were similar to countries like Germany and Mexico.60,63 The prevalence of dental
visits was approximately half of that observed in high-income countries, such as Canada and United States.68,69
When the recall period of 360 days was observed, from 2003 to 2013, the national surveys showed less frequency of medical and dental visits in the North region (38% and 33%, respectively) and higher frequencies in the South (86% and 52%, respectively).
There was a sharp increase in medical visits in the South, Southeast and Midwest regions, where we can find the highest human development indexes (HDI) of the country. 70 With regard to dental visits, the positive
exception was the Northeast region, with an increase similar to the regions with better HDI.
Another fact to consider is the availability of health professionals. In 2013, the North region had a density of 1 physician per 1,000 inhabitants, whereas the South had 2.1 and the Southeast had 2.7 physicians per 1,000 inhabitants. 71 A survey from the World Dental
Federation, conducted in 2015, presented a density of 1 dentist/1,000 inhabitants, and such data places Brazil in a favorable condition, when compared to high-income countries, such as Canada and USA,72 despite
the Brazilian regional inequalities.73 Such differences
The differences between the prevalences of medical visits, dental visits and hospitalizations found by PNS and PNAD may be explained by methodological differences. Although PNS is part of the Integrated System of Household Surveys, it corresponds to an independent sample, with more geographic spaces, including more municipalities. Moreover, in PNS, one resident per household was interviewed and there was more accuracy on estimates, avoiding proxy-respondents,74,75 whilst in PNAD, the
individual interviewed answered for all the other residents in that household.
Despite the reduction observed on the prevalence of hospitalizations, the economic impact of expenses on the tertiary level is still high. In 2010, the expenses represented 52% of all health expenses.4 In turn, the
primary health care was responsible for about 80 to 90% of all assistance, counting with only 14% of the financial resources directed to the Health area.4
We can conclude that medical visits were the most common health service, used by more than 70% of the Brazilian population. A little more than one third of the Brazilians went to the dentist in the studied period. Except for the North and Northeast regions, there was an increase in medical visits in scenarios with better socioeconomic status; at the
same time there was a reduction on the prevalence of hospitalizations in the North, showing geographical inequalities in the use of health services throughout the country. There is methodological heterogeneity among the assessed studies, influenced by the range of the recall period, the proportion of women and the regional differences. The validation of assessment tools of health services use, the standardization of the recall period and the conduction of more studies on this topic in the Midwest and North regions are top priorities for future researches.
Authors' Contributions
Araújo MEA contributed to the searches, extraction, selection, quality assessment of the studies, data analysis, writing and review of the manuscript. Silva MT contributed to the searches, data analysis and review of the manuscript.
Andrade KRC
contributed to the selection, extraction and quality assessment of the studies.Galvão TF
contributed to the writing and review of the manuscript.Pereira MG
contributed to the review of the manuscript. All authors approved its final version and declare to be responsible for all aspects of the work, ensuring their accuracy and integrity.1. Travassos C, Martins M. Uma revisão sobre os conceitos de acesso e utilização de serviços de saúde. Cad Saude Publica. 2004;20 sup 2:S190-S8.
2. Pereira MG. Epidemiologia: teoria e prática. 16. ed. Rio de Janeiro: Guanabara Koogan; 1995.
3. Allin S, Masseria C, Sorenson C, Papanicola I, Mossialos E. Measuring inequalities in access to health care: a review of the indices?: European Commission Brussels, Belgium; 2007.
4. Paim J, Travassos C, Almeida C, Bahia L, Macinko J. The Brazilian health system: history, advances, and challenges. Lancet. 2011 May;377(9779):1778-97.
5. Atun R, Andrade LOM, Almeida G, Cotlear D, Dmytraczenko T, Frenz P, et al. Health-system reform and universal health coverage in Latin America. Lancet. 2015 Marc;385(9974):1230-47.
6. World Health Organization. The world health report 2000: health system: improving
performance [Internet]; Genebra: World Health Organization; 2000 [cited 2017 Mar 01]. Available
from: http://www.who.int/whr/2000/en/whr00_ en.pdf?ua=1
7. Damacena GN, Szwarcwald CL, Malta DC, Souza Júnior PRB, Vieira MLFP, Pereira CA, et al. O processo de desenvolvimento da Pesquisa Nacional de Saúde no Brasil, 2013. Epidemiol Serv Saude. 2015 abr-jun;24(2):197-206.
8. Viacava F, Bellido JG. Condições de saúde, acesso a serviços e fontes de pagamento, segundo inquéritos domiciliares. Cienc Saude Coletiva. 2016;21(2):351-70.
9. Galvão TF, Pereira MG. Revisões sistemáticas da literatura: passos para sua elaboração. Epidemiol Serv Saude. 2014 jan-mar;23(1):183-4.
10. Galvão TF, Pansani TSA, Harrad D. Principais itens para relatar Revisões sistemáticas e meta-análises: a recomendação PRISMA. Epidemiol Serv Saude. 2015 abr-jun;24(2):335-42.
11. Cochrane.Covidence. Melbourne: Cochrane; 2016 [cited 2017 Mar 01 ].Available from: https://www. covidence.org/
1. Travassos C, Martins M. Uma revisão sobre os conceitos de acesso e utilização de serviços de saúde. Cad Saude Publica. 2004;20 sup 2:S190-S8.
2. Pereira MG. Epidemiologia: teoria e prática. 16. ed. Rio de Janeiro: Guanabara Koogan; 1995.
3. Allin S, Masseria C, Sorenson C, Papanicola I, Mossialos E. Measuring inequalities in access to health care: a review of the indices?: European Commission Brussels, Belgium; 2007.
4. Paim J, Travassos C, Almeida C, Bahia L, Macinko J. The Brazilian health system: history, advances, and challenges. Lancet. 2011 May;377(9779):1778-97.
5. Atun R, Andrade LOM, Almeida G, Cotlear D, Dmytraczenko T, Frenz P, et al. Health-system reform and universal health coverage in Latin America. Lancet. 2015 Marc;385(9974):1230-47.
6. World Health Organization. The world health report 2000: health system: improving
performance [Internet]; Genebra: World Health Organization; 2000 [cited 2017 Mar 01]. Available from: http://www.who.int/whr/2000/en/whr00_ en.pdf?ua=1
7. Damacena GN, Szwarcwald CL, Malta DC, Souza Júnior PRB, Vieira MLFP, Pereira CA, et al. O processo de desenvolvimento da Pesquisa Nacional de Saúde no Brasil, 2013. Epidemiol Serv Saude. 2015 abr-jun;24(2):197-206.
8. Viacava F, Bellido JG. Condições de saúde, acesso a serviços e fontes de pagamento, segundo inquéritos domiciliares. Cienc Saude Coletiva. 2016 fev;21(2):351-70.
9. Galvão TF, Pereira MG. Revisões sistemáticas da literatura: passos para sua elaboração. Epidemiol Serv Saude. 2014 jan-mar;23(1):183-4.
10. Galvão TF, Pansani TSA, Harrad D. Principais itens para relatar Revisões sistemáticas e meta-análises: a recomendação PRISMA. Epidemiol Serv Saude. 2015 abr-jun;24(2):335-42.
11. Cochrane.Covidence. Melbourne: Cochrane; 2016 [cited 2017 Mar 01 ].Available from: https://www. covidence.org/
12. Loney PL, Chambers LW, Bennett KJ, Roberts JG, Stratford PW. Critical appraisal of the health research literature: prevalence or incidence of a health problem. Chronic Dis Can. 1998;19(4):170-6.
13. DerSimonian R, Laird N. Meta-analysis in clinical trials. Control Clin Trials. 1986 Sep;7(3):177-88.
14. Higgins JP, Thompson SG. Quantifying heterogeneity in a meta-analysis. Stat Med. 2002 Jun;21(11):1539-58.
15. Sterne JA, Sutton AJ, Ioannidis JP, Terrin N, Jones DR, Lau J, et al. Recommendations for examining and interpreting funnel plot asymmetry in meta-analyses of randomised controlled trials. BMJ. 2011 Jul;343:d4002.
16. Nyaga VN, Arbyn M, Aerts M. Metaprop: a Stata command to perform meta-analysis of binomial data. Arch Public Health. 2014 Nov;72(1):39.
17. Bastos GAN, Duca GF, Hallal PC, Santos IS. Utilização de serviços médicos no sistema público de saúde no Sul do Brasil. Rev Saude Publica. 2011 jun;45(3):475-54.
18. Silva LMV, Formigli VLA, Cerqueira MP, Kruchevsky L, Teixeira MMA, Barbosa ASM, et al. O processo de distritalização e a utilização de serviços de saúde: avaliação do Caso de Pau da Lima, Salvador, Bahia, Brasil. Cad Saude Publica. 1995 jan-mar;11(1):72-84.
19. Pinheiro RS, Travassos C. Estudo da desigualdade na utilização de serviços de saúde por idosos em três regiões da cidade do Rio de Janeiro. Cad Saude Publica. 1999 jul-set;15(3):487-96.
20. Blay SL, Andreoli SB, Fillenbaum GG, Gastal FL. Depression morbidity in later life: prevalence and correlates in a developing country. Am J Geriatr Psychiatry. 2007 Sep;15(9):790-9.
21. Mendoza-Sassi R, Béria JU, Barros AJD. Fatores associados à utilização de serviços ambulatoriais: estudo de base populacional. Rev Saude Publica. 2003 jun;37(3):372-8.
22. Barreto IC, Grisi SJ. Morbidade referida e seus condicionantes em crianças de 5 a 9 anos em Sobral, CE, Brasil. Rev Bras Epidemiol. 2010 mar;13(1):35-48.
23. Arrais PSD, Brito LL, Barreto ML, Coelho HLL. Prevalência e fatores determinantes do consumo de medicamentos no Município de Fortaleza, Ceará. Cad Saude Publica. 2005 nov-dez;21(6):1737-46.
24. Garbinato LR, Béria JU, Figueiredo ACL, Raymann B, Gigante LP, Palazzo LS, et al. Prevalência de internação hospitalar e fatores associados: um estudo de base populacional em um centro urbano no Sul do Brasil. Cad Saude Publica. 2007 jan;23(1):217-24.
26. Araújo CS, Lima RC, Peres MA, Barros AJD. Utilização de serviços odontológicos e fatores associados: um estudo de base populacional no Sul do Brasil. Cad Saude Publica. 2009 maio;25(5):1063-72.
27. Costa ACM, Alves MTSSB. Fatores associados à utilização de serviços de saúde em Municípios Maranhenses. Ver Baiana Saude Publica. 2010 jul-set;34(3):515-9.
28. Gomes AMM, Thomaz EBAF, Brito e Alves MTSS, Silva AAM, Silva RA. Fatores associados ao uso dos serviços de saúde bucal: estudo de base populacional em municípios do Maranhão, Brasil. Cienc Saude Coletiva. 2014 fev;19(2):629-40.
29. Bastos GAN, Santos IS, Costa JSD, Capilheira MF.Uso de serviços ambulatoriais nos últimos 15 anos: comparação de dois estudos de base populacional. Rev Bras Epidemiol. 2011 dez;14(4):620-32.
30. Boing AF, Matos IB, Arruda MP, Oliveira MC, Njaine K. Prevalência de consultas médicas e fatores associados: um estudo de base populacional no sul do Brasil. Rev Assoc Med Bras. 2010;56(1):41-6.
31. Dilélio AS, Tomasi E, Thumé E, Silveira DS, Siqueira FCV, Piccini RX, et al. Padrões de utilização de atendimento médico-ambulatorial no Brasil entre usuários do Sistema Único de Saúde, da saúde suplementar e de serviços privados. Cad Saude Publica. 2014 dez;30(12):2594-606.
32. Oliveira MA, Francisco PMSB, Costa KS, Barros MBA. Automedicação em idosos residentes em Campinas, São Paulo, Brasil: prevalência e fatores associados. Cad Saude Publica. 2012 fev;28(2):335-45.
33. Bastos GAN, Harzheim E, Sousa AI. Prevalência e fatores associados à consulta médica entre adultos de uma comunidade de baixa renda do Sul do Brasil. Epidemiol Serv Saude. 2014 jul-set;23(3):409-20.
34. Destro JR, Boing AF, d’Orsi E. Factors associated to medical consultations by elderly adults in southern Brazil: a population based study. Rev Bras Epidemiol. 2014 Jul-Sep;17(3):692-704.
35. Soares FF, Chaves SC, Cangussu MC. Desigualdade na utilização de serviços de saúde bucal na atenção básica e fatores associados em dois municípios brasileiros. Rev Panam Salud Publica. 2013 dez;34(6):401-6.
36. Galvao TF, Silva MT, Gross R, Pereira MG. Medication use in adults living in Brasilia, Brazil: a cross-sectional, population-based study. Pharmacoepidemiol Drug Saf. 2014 May;23(5):507-14.
37. Arruda GO, Marcon SS. Inquérito sobre a utilização dos serviços de saúde por homens adultos:
prevalências e fatores associados. Rev Lat Am Enfermagem. 2016;24:e2685.
38. Instituto Brasileiro de Geografia e Estatística. Pesquisa Nacional por Amostra de Domicílios: acesso e utilização de serviços de saúde: 1998 [Internet]. Rio de Janeiro: Instituto Brasileiro de Geografia e Estatística; 2000 [citado 2016 mar 01]. Disponível em: http://www.ibge.gov.br/home/estatistica/populacao/ trabalhoerendimento/pnad98/saude/saude.pdf
39. Instituto Brasileiro de Geografia e Estatística. Pesquisa Nacional por Amostra de Domicílios: acesso e utilização de serviços de saúde: 2003[ Internet]. Rio de Janeiro: Instituto Brasileiro de Geografia e Estatística; 2005 [citado 2016 mar 01]. Disponível em: http://www.spm.gov.br/arquivos-diversos/. arquivos/integra_saude_ibge_2003
40. Ministério da Saúde (BR). Secretaria de Atenção à Saúde. Departamento de Atenção Básica. Projeto SB Brasil 2003: condições de saúde bucal da população brasileira 2002-2003: resultados principais [Internet]. Brasília: Ministério da Saúde; 2004 [citado 2016 mar 01]. Disponível em: http://bvsms. saude.gov.br/bvs/publicacoes/projeto_sb2004
41. Instituto Brasileiro de Geografia e Estatística. Pesquisa Nacional por Amostra de Domicílios: um panorama da saúde no Brasil: acesso e utilização dos serviços, condições de saúde e fatores de risco e proteção à saúde[Internet]. Rio de Janeiro: Instituto Brasileiro de Geografia e Estatística; 2008 [citado 2017 mar 13] Disponível em: http://biblioteca.ibge.gov.br/visualizacao/ monografias/GEBIS%20-%20RJ/panorama.pdf
42. Ministério da Saúde. Secretaria de Atenção à Saúde. Secretaria de Vigilância em Saúde. SB Brasil 2010: Pesquisa Nacional de Saúde Bucal: resultados principais [Internet]. Brasilia: Ministério da Saúde; 2012 [citado 2017 mar 02]. Disponível em: http:// bvsms.saude.gov.br/bvs/publicacoes/pesquisa_ nacional_saude_bucal.pdf
43. Instituto Brasileiro de Geografia e Estatística. Pesquisa Nacional de Saúde 2013: percepção do estado de saúde, estilos de vida e doenças crônicas: Brasil, grandes regiões e unidades da federação [Internet]. Rio de Janeiro: Instituto Brasileiro de Geografia e Estatística; 2014 [citado 2017 mar 02]. Disponível em: http://biblioteca.ibge.gov.br/ visualizacao/livros/liv91110.pdf
45. Naessens JM, Visscher SL, Peterson SM, Swanson KM, Johnson MG, Rahman PA, et al. Incorporating the last four digits of social security numbers substantially improves linking patient data from de-identified hospital claims databases. Health Serv Res. 2015 Aug;50 Suppl 1:1339-50.
46. Cunha RE. Cartão Nacional de Saúde: os desafios da concepção e implantação de um sistema nacional de captura de informações de atendimento em saúde. Cienc Saude Coletiva. 2002;7(4):869-78.
47. Vasconcelos AMN, Gomes MMF. Transição
demográfica: a experiência brasileira. Epidemiol Serv Saude. 2012 out-dez;21(4):539-48.
48. Palacios-Ceña D, Hernández-Barrera V, Jiménez-García R, Valle-Martín B, Fernández-de-las-Peñas C, Carrasco-Garrido P. Has the prevalence of health care services use increased over the last decade (2001-2009) in elderly people? A spanish population-based survey. Maturitas. 2006 Aug;76(4):326-33.
49. Vingilis E, Wade T, Seeley J. Predictors of adolescent health care utilization. J Adolesc. 2007 Oct;30(5):773-800.
50. Núñez A, Chi C. Equity in health care utilization in Chile. Int J Equity Health. 2013 Aug;12(1):58.
51. Gough D, Oliver S, Thomas J, editors. An introduction to systematic reviews. London: Sage Publications;2012.
52. Pereira MG, Galvão TF. Heterogeneidade e viés de publicação em revisões sistemáticas. Epidemiol Serv Saude. 2014 out-dez;23(4):775-8.
53. Stone AA, Bachrach CA, Jobe JB, Kurtzman HS, Cain VS, editors. The science of self-report: implications for research and practice. Mahwah: Psychology Press; 1999.
54. Bhandari A, Wagner T. Self-reported utilization of health care services: improving measurement and accuracy. Med Care Res Rev. 2006 Apr;63(2):217-35.
55. Coughlin SS. Recall bias in epidemiologic studies. J Clin Epidemiol. 1990;43(1):87-91.
56. Reijneveld SA, Stronks K. The impact of response bias on estimates of health care utilization in a metropolitan area: the use of administrative data. Int J Epidemiol. 1999 Dec;28(6):1134-40.
57. Brusco NK, Watts JJ. Empirical evidence of recall bias for primary health care visits. BMC Health Serv Res. 2015 Sep;15:381
58. Saksena P, Xu K, Elovainio R, Perrot J. Health services utilization and out-of-pocket expenditure at public and
private facilities in low-income countries. Geneva: World Health Organization; 2010 (World Health Report; 20).
59. Swart E. The prevalence of medical services use: how comparable are the results of large-scale population surveys in Germany? Psychosoc Med. 2012 Oct;9:Doc10.
60. Kassim S, Croucher R. Factors associated with dental and medical care attendance in UK resident Yemeni khat chewers: a cross sectional study. BMC Public Health. 2012 Jun;12:486.
61. Esmailnasab N, Hassanzadeh J, Rezaeian S, Barkhordari M. Use of health care services and associated factors among women. Iran J Public Health. 2014 Jan;43(1):70-8.
62. Gallegos-Carrillo K, García-Peña C, Durán-Muñoz C, Mudgal J, Durán-Arenas L, Salmerón-Castro J. Health care utilization and health-related quality of life perception in older adults: a study of the Mexican Social Security Institute. Salud Publica Mex. 2008 May-Jun;50(3):207-17.
63. Díaz Piñera AM, Rodríguez Salvá A, García Roche RG, Balcindes Acosta S, Jova Morel R, De Vos P, et al. Utilización de los servicios médicos en un área de salud. Revi Cuba Hig Epidemiol. 2013ene-abr;51(1):27-39.
64. Gulley SP, Altman BM. Disability in two health care systems: access, quality, satisfaction, and physician contacts among working-age Canadians and Americans with disabilities. Disabil Health J. 2008 Oct;1(4):196-208.
65. Beirne PV, Clarkson JE, Worthington HV. Recall intervals for oral health in primary care patients. Cochrane Database Syst Rev. 2007 Oct;17(4):CD004346.
66. Giannobile WV, Braun TM, Caplis AK, Doucette-Stamm L, Duff GW, Kornman KS. Patient stratification for preventive care in dentistry. J Dent Res. 2013 Aug;92(8):694-701.
67. Ramraj C, Azarpazhooh A, Dempster L, Ravaghi V, Quiñonez C. Dental treatment needs in the Canadian population: analysis of a nationwide cross-sectional survey. BMC Oral Health. 2012 Oct;12:46.
68. National Center for Health Statistics.Health, United States, 2015: with special feature on racial and ethnic health disparities [Internet]. Washington: National Center for Health Statistics; 2016 [cited 2017 Mar 02]. Available from: http://www.cdc.gov/nchs/data/hus/hus15.pdf
brasileiro. Brasília: Programa das Nações Unidas para o Desenvolvimento, Instituto de Pesquisa Econômica Aplicada;2013 [citado 2017 mar 02]. (Atlas do Desenvolvimento Humano no Brasil 2013). Disponível em: http://repositorio.ipea.gov.br/ handle/11058/2375
70. Conselho Federal de Medicina. Demografia médica no Brasil: cenários e indicadores de distribuição: relatório de pesquisa - fevereiro de 2013. Vol. 2. São Paulo: Conselho Regional de Medicina do Estado de São Paulo; 2013 [citado 2017 mar 02]. Disponível em: http://www. cremesp.org.br/pdfs/DemografiaMedicaBrasilVol2.pdf [Acesso janeiro de 2016.
71. Word Dental Federation. The challenge of oral disease: a call for global action: the oral health atlas [Internet]. 2. ed.Btighton: Word Dental Federation; 2015 [cited 2017 Mar 03]. Available from: http:// www.fdiworldental.org/publications/oral-health-atlas/ oral-health-atlas-(2015).aspx
72. Miranda CD-BC, Peres MA. Determinantes da utilização de serviços odontológicos entre adultos: um estudo de base populacional em Florianópolis, Santa Catarina, Brasil. Cad Saude Publica. 2013 nov;29(11):2319-32.
73. Szwarcwald CL, Malta DC, Pereira CA, Vieira MLFP, Conde WL, Souza Junior PRB, et al. Pesquisa Nacional de Saúde no Brasil: concepção e metodologia de aplicação. Cienc Saude Coletiva. 2014 fev;19(2):333-42.
74. Souza-Júnior PRB, Freitas MPS, Antonaci GA, Szwarcwald CL. Desenho da amostra da Pesquisa Nacional de Saúde 2013. Epidemiol Serv Saude. 2015 abr-jun;24(2):207-16.
75. Barros MBA, Francisco PMSB, Zanchetta LM, César CLG. Tendências das desigualdades sociais e demográficas na prevalência de doenças crônicas no Brasil, PNAD: 2003- 2008. Cien Saude Coletiva. 2011 set;16(9):3755-68.
76. Bastos GAN, Fasolo LR. Fatores que influenciam a satisfação do paciente ambulatorial em uma população de baixa renda: um estudo de base populacional. Rev Bras Epidemiol. 2013 mar;16(1):114-24.
77. Celeste RK, Nadanovsky P, Leon AP. Associação entre procedimentos preventivos no serviço público de odontologia e a prevalência de cárie dentária. Rev Saude Publica. 2007 out;41(5):830-8.
78. Barros MBA, César CLG, Carandina L, Torre GD. Desigualdades sociais na prevalência de doenças
crônicas no Brasil, PNAD-2003. Cienc Saude Coletiva. 2006 out-dez;11(4):911-26.
79. Barros MBA, Francisco PMSB, Lima MG, César CLG. Social inequalities in health among the elderly. Cad Saude Publica. 2011;27 Suppl 2:s198-s208.
80. Martins AMEBL, Barreto SM, Pordeus IA. Uso de serviços odontológicos entre idosos brasileiros. Rev Panam Salud Publica. 2007 nov;22(5):308-16.
81. Moraes SA, Lopes DA, Freitas IC. Sex-specific differences in prevalence and in the factors associated to the search for health services in a population based epidemiological study. Rev Bras Epidemiol. 2014 Apr-Jun;17(2):323-40.
82. Ferreira CO, Antunes JLF, Andrade FB. Factors associated with the use of dental services by elderly Brazilians. Rev Saude Publica. 2013 dez;47 Suppl 3:90-7.
83. Luchi CA, Peres KG, Bastos JL, Peres MA. Inequalities in self-rated oral health in adults. Rev Saude Publica. 2013 Aug;47(4):1-10.
84. Martins AMEBL, Barreto SM, Pordeus IA. Características associadas ao uso de serviços odontológicos entre idosos dentados e edentados no Sudeste do Brasil: Projeto SB Brasil. Cad Saude Publica. 2008 jan;24(1):81-92.
85. Mendoza-Sassi R, Béria JU. Prevalence of having a regular doctor, associated factors, and the effect on health services utilization: a population-based study in Southern Brazil. Cad Saude Publica. 2003 Sep-Oct;19(5):1257-66.
86. Moreira JPL, Moraes JR, Luiz RR. Utilização de consulta médica e hipertensão arterial sistêmica nas áreas urbanas e rurais do Brasil, segundo dados da PNAD 2008. Cienc Saude Coletiva. 2011 set;16(9):3781-93.
87. Travassos C, Oliveira EXG, Viacava F. Desigualdades geográficas e sociais no acesso aos serviços de saúde no Brasil: 1998 e 2003. Cienc Saude Coletiva. 2006 out-dez;11(4):975-86.
88. Martins AMEBL, Haikal DSA, Pereira SM, Barreto SM. Uso de serviços odontológicos por rotina entre idosos brasileiros: Projeto SB Brasil. Cad Saude Publica. 2008 jul;24(7):1651-66.
90. Ferreira RA, Barreto SM, Giatti L. Hipertensão arterial referida e utilização de medicamentos de uso contínuo no Brasil: um estudo de base populacional. Cad Saude Publica. 2014 abr;30(4):815-26.
91. Neuman NA, Tanaka OY, Szarfarc SC, Guimarães PRV, Victora CG. Prevalência e fatores de risco para anemia no Sul do Brasil. Rev Saude Publica. 2000 fev;34(1):56-63.
92. Silva AER, Langlois CO, Feldens CA. Use of dental services and associated factors among elderly in southern Brazil. Rev Bras Epidemiol. 2013 Dec;16(4):1005-16.
93. Xavier AFC, Santos JA, Alencar CRB, Andrade FJP, Clementino MA, Menezes TN, et al. Use of dental services among elderly living in the city of Campina Grande, PB, Brazil. Pesqui Bras Odontopediatria Clin Integr. 2013 out-dez;13(4):371-6.
94. Almeida MF, Barata RB, Montero CV, Silva ZP. Prevalência de doenças crônicas auto-referidas e utilização de serviços de saúde, PNAD/1998, Brasil. Cienc Saude Coletiva. 2002;7(4):743-56.
95. Barata RB, Almeida MF, Montero CV, Silva ZP. Health inequalities based on ethnicity in individuals aged 15 to 64, Brazil, 1998. Cad Saude Publica. 2007 Feb;23(2):305-13.
96. Barata RB, Almeida MF, Montero CV, Silva ZP. Gender and health inequalities among adolescents and adults in Brazil, 1998. Rev Panam Salud Publica. 2007 May;21(5):320-7.
97. Camargo MBJ, Barros AJD, Frazão P, Matijasevich A, Santos IS, Peres MA, et al. Predictors of dental visits for routine check-ups and for the resolution of problems among preschool children. Rev Saude Publica. 2012 Feb;46(1):87-97.
98. Camargo MBJ, Dumith SC, Barros AJD. Uso regular de serviços odontológicos entre adultos: padrões de utilização e tipos de serviços. Cad Saude Publica. 2009 set;25(9):1894-906.
99. Cesar JA, Mendoza-Sassi R, Horta BL, Ribeiro PRP, D'Avila AC, Santos FM, et al. Basic indicators of child health in an urban area in southern Brazil: estimating prevalence rates and evaluating differentials. J Pediatr (Rio J). 2006 Nov-Dec;82(6):437-44.
100. Crispino SM, Cunha AJ. Scholar absenteeism and use of health services in children and adolescents with wheezing. Alergia (Mex). 2004 Nov;51(6):199-205.
101. Ferreira-Nóbilo NP, Cavalcanti YW, Meirelles MPR, Batista MJ, Cypriano S, Sousa MLR. Relations
between dental caries, socioeconomic variables and access to dental services of children from a countryside city in the state of São Paulo, Brazil. Pesqui Bras Odontopediatria Clin Integr. 2014;14(3):259-66.
102. Huang H, Menezes PR, Silva SA, Tabb K, Barkil-Oteo A, Scazufca M. The association between depressive disorders and health care utilization: results from the São Paulo Ageing and Health Study (SPAH). Gen Hosp Psychiatry. 2014 Mar-Apr;36(2):199-202.
103. Loyola Filho AI, Uchoa E, Guerra HL, Firmo JOA, Lima-Costa MF. Prevalência e fatores associados à automedicação: resultados do projeto Bambuí. Rev Saude Publica. 2002 fev;36(1):55-62.
104. Pinto RS, Matos DL, Loyola Filho AI. Características associadas ao uso de serviços odontológicos públicos pela população adulta brasileira. Cienc Saude Coletiva. 2012 fev;17(2):531-44.
105. Rodrigues CAQ, Silva PLV, Caldeira AP, Pordeus IA, Ferreira RC, Martins AMEBL. Factors associated with satisfaction with dental services among the elderly. Rev Saude Publica. 2012 Dec;46(6):1039-50.
106. Bastos TF, Alves MCGP, Barros MBA, Cesar CLG. Men's health: a population-based study on social inequalities. Cad Saude Publica. 2012 nov;28(11):2133-42.
107. Nunes BP, Thumé E, Tomasi E, Duro SMS, Facchini LA. Socioeconomic inequalities in the access to and quality of health care services. Rev Saude Publica. 2014 dez;48(6):968-76.
Received on 30/10/2016