EDITOR IAL
89
J Vasc Bras. 2016 Apr.-June; 15(2):89-92 http://dx.doi.org/10.1590/1677-5449.004216
Agreement analysis in clinical and experimental trials
Análise de concordância em estudos clínicos e experimentais
Hélio Amante Miot1
*
1 Universidade Estadual Paulista – UNESP, Botucatu Medical School, Department of Dermatology, Botucatu, SP, Brazil.
Financial support: None.
Conlicts of interest: No conlicts of interest declared concerning the publication of this article. Submitted: May 06, 2016. Accepted: May 06, 2016.
he study was carried out at Department of Dermatology, Botucatu Medical School, Universidade Estadual Paulista (UNESP), Botucatu, SP, Brazil.
Analysis of agreement tests the capacity to arrive at identical results (with the same units of measurement), for the same subject/phenomenon, using different instruments, using the same instrument at different times or when performed by different examiners, or some combination of these conditions. Trivial examples include calibration of instruments, testing reliability of scales/measures, assessment of the equivalence of measurement tools, judgment in tests of ability, tests of repeatability or reproducibility, and diagnostic analysis (interpersonal and intraindividual agreement) and psychometric agreement (temporal stability).1,2
It is common for the need to analyze agreement to be, erroneously, met using statistical techniques for measurement of correlation (for example, Pearson’s
coeficients), which are only testing the assumption
that the variation in the values of one variable follows the variation in the values of another. However, for analysis of agreement, in addition to correlation, there must also be coincidence of values. This is why measures of the effect size of agreement tend to be
smaller than correlation coeficients, when applied
to the same dataset.3-5
The model of agreement analysis should be deined
early on in the project design phase so that a study design is chosen to favor collection, analysis and interpretation of the data. Being able to count on an experienced statistician during this phase will increase the likelihood of success.
In principle, analysis of agreement can depend
exclusively on a deinition predetermined by the
researcher, who should define a tolerance limit that satisfies the research requirements. This is generally the case with calibration and equivalence of measurement instruments, in which measurements must conform to a maximum percentage variation
in comparison with a standard measure or a speciic
instrument. However, the existence of an inherent random error of measurement linked to the instrument and/or the examiners includes an intrinsic variation
in measurements, which interferes with estimation of
agreement. Several different speciic statistical tests
have been developed to evaluate these aspects and the most important of them will be discussed below.
The simplest situation occurs when the variable of interest is dichotomous (for example, sick vs. healthy, surgical indication vs. clinical, approved vs. rejected), and estimation is made by two examiners or with two instruments. In such cases, Cohen’s kappa statistic is classically employed. The kappa value,
conidence interval and statistical signiicance should
all be interpreted as the magnitude of agreement that exceeds the degree of coincidence of assessments that would occur by chance.6
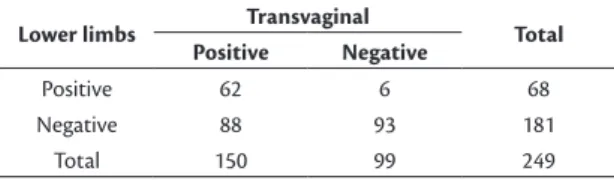
For example, an investigation conducted by Barros et al.7 employed lower limb vs. transvaginal
Doppler ultrasound for identification of pelvic varicose veins (Table 1), reporting total agreement of (62+93)/249 = 62.2%. The 94 (37.8%) cases of disagreement were distributed in a highly asymmetrical fashion, which revealed a higher rate of diagnostic failure in the lower limb examinations. The kappa
coeficient showed weak agreement – 0.31 (95%CI% 0.20-0.40), p < 0.01 – even though it was statistically signiicant.
A more elaborate situation occurs when an ordinal variable (for example, disease stages, severity levels,
graded estimates [0, 1+, 2+, 3+ or 4+, for example],
totally correct vs. partially correct vs. error) is estimated by two examiners. In such cases, in addition to total agreement, a weighting can be attributed to similar
classiications, favoring them over larger degrees of
disagreement. For this type of analysis, the classical choice is the kappa statistic with quadratic weighting (Fleiss-Cohen).6,8
90 J Vasc Bras. 2016 Apr.-June; 15(2):89-92 Techniques for analysis of agreement
agreements. Usually, kappa with quadratic weightings will return the same result as the Intraclass Correlation
Coeficient (ICC), which is discussed below.8,9
For example, using the crude data from the study published by Brianezi et al.,10 in which two researchers
classiied immunohistochemical epidermal marking of the p53 protein using an ordinal scale of 0 to 4+, poor
total agreement (16/63=25.4%) between examiners was observed (Table 2). However, the weighted
kappa coeficient resulted in substantial agreement – 0.66 (0.40-0.87) – due to the fact that examiner 1 systematically classiied images at a higher level
than examiner 2, leading to a high degree of partial agreement. Additionally, when there are multiple
ordinal levels, classiications at the extreme values (for example, 0 or 4+) tend to result in greater agreement
than the intermediate categories.
When the variables of interest are quantitative (discrete, continuous or ranks) and two examiners make estimates (interobserver agreement), there are two instruments, or the variables are estimated at different times (test-retest reliability), then the ICC for complete agreement is generally used, which is even robust to violations of normal distribution.11-14 There
are a number of different algorithms for calculating ICCs to assess correlation and agreement. However, for the purposes of this text, it is the algorithms for complete agreement that matter. Of these, the researcher must choose between: one-way random, two-way random or two-way mixed, depending on
the nature of the examiners. In the irst option, the
examiners are not the same for each phenomenon assessed; in the second, the examiners are the same for each phenomenon and are chosen at random (the most used); in the third, the examiners are not random, but the only ones possible (for example, intraobserver analysis). Finally, the researcher must choose the single measure ICC if what is important is the agreement of each examiner’s measurement in relation to the behavior of the n examiners (the most used), or the mean measures ICC if the score for the variable is composed of a combination of the n scores of the examiners. These options can result in indicators of different magnitudes.15,16
As an example, the crude data will be used from Ianhez et al.,17 in which counts of multiple cutaneous
lesions were conducted by two trained examiners – one of them at two different times (A, B1 and B2) – in a
study to validate a system for standardized counting
of actinic keratoses of the upper limbs (n = 60).
The ICC for complete agreement of the intraobserver (B1 vs. B2) comparison (two-way mixed) resulted in
0.74 (0.60-0.84) for single measures and 0.85 (0.75-0.91)
for mean measures. However, the ICC for interobserver (A vs. B1) comparison (two-way random) resulted
in 0.68 (0.47-0.82) for single measures and 0.81 (0.64-0.90) for mean measures, all with p < 0.01.
These results indicate that consistency was greater when a single examiner counted the lesions twice,
showing the beneit of using the mean of two measures
as an estimate.
Interobserver agreement is usually less than intraobserver agreement for estimates from the
same sample, because the irst includes sources of
variability that are inherent to the different examiners. Additionally, the ICC estimate for single measures generates smaller magnitude estimators than the
estimate for mean measures, which justiies the use
of multiple measures to reduce the random error.17
In addition to careful methodological description of the process of selecting the subjects and the examiners, of the data collection and of the analytical techniques employed, the results of tests of agreement should be expressed in the form of percentage agreement data (total and subsets), in addition to providing the
estimators and their 95% conidence intervals and statistical signiicance. This is the only way that
enables interpretation of the circumstances under which variables diverge. The magnitude of estimators of agreement (kappa or ICC) is conventionally
interpreted as follows: 0 (absent), 0-0.19 (poor), 0.20-0.39 (weak), 0.30-0.59 (moderate), 0.60-0.79 (substantial), and ≥ 0.80 (almost total).4,6,16
Table 1. Evidence of pelvic varicose veins according to Doppler ultrasonography of the lower limbs vs. the transvaginal method (n = 249).7
Lower limbs Transvaginal Total
Positive Negative
Positive 62 6 68
Negative 88 93 181
Total 150 99 249
Table 2. Comparative assessment of immunohistochemical
epidermal marking (0 to 4+) of p53 protein by two experienced researchers (n = 63).10
Av2
Total
0 1+ 2+ 3+ 4+
Av1
0 10 - - - - 10
1+ 12 2 - - - 14
2+ 7 8 1 - - 16
3+ - 6 4 1 - 11
4+ - - 3 5 4 12
Total 29 16 8 6 4 63
91
J Vasc Bras. 2016 Apr.-June; 15(2):89-92 Hélio Amante Miot
There are generalizations of the algorithms for calculation of the kappa and ICC for multiple assessments and also for different combinations of subjects and examiners. However, these methods are beyond the scope of this text.1,18
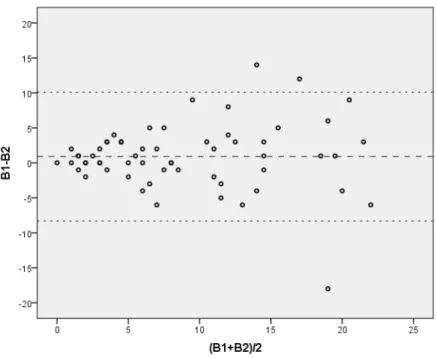
Agreement between variables of a quantitative nature can be represented graphically, in pairs, using a Bland-Altman plot, which projects the absolute difference between the measures of each data point on the ordinate axis and the mean of the two measurements on the abscissa axis.2 In addition
to illustrating the entire distribution, this makes it possible to assess tendencies for agreement to worsen according to the magnitude of the measurements (Figure 1). However, it is not a good measure of the magnitude of agreement. For this purpose the tests of ICC mentioned above are preferable, to complement the graphical representation.
Returning once more to the crude data collected by Ianhez et al.,17 analysis of the plot in Figure 1 reveals
that consistency of counts is greater for values below
10 lesions. It is indeed the usual case that agreement
suffers an impact from the magnitude of measures. Limitation to a set interval (for example, restricting
inclusion to patients with less than 10 lesion) makes
the values more reliable in a clinical study.
Choice of the sample size for tests of agreement is dependent on the dimension of the kappa (or ICC), on the test power and on the homogeneity of the
categories under analysis. This subject is covered adequately in specialized literature.6,19,20
Indicators of agreement are inluenced by the
representativeness of each class analyzed, which demands maximum homogeneity of subsets, and also by
the modiication imposed on the original measurement
scale (for example, Log or x1/n transformation). Prior
training and control of the rigor of the examiners’ estimates are essential, because their absence could introduce disagreement between estimates, which would add a systematic error, in detriment to the magnitude of the measurements taken.1,4
Finally, even a good estimate of agreement,
with an adequate conidence interval and statistical signiicance, may not be conirmed when applied to
other populations, other examiners, other instruments or to measures not contained in the original sample, respecting the inferential principles of generalization of samples.21
REFERENCES
1. Kottner J, Audige L, Brorson S, et al. Guidelines for Reporting Reliability and Agreement Studies (GRRAS) were proposed. J Clin Epidemiol. 2011;64(1):96-106. http://dx.doi.org/10.1016/j. jclinepi.2010.03.002. PMid:21130355.
2. Bland JM, Altman DG. Statistical methods for assessing agreement between two methods of clinical measurement. Lancet. 1986;1(8476):307-10. http://dx.doi.org/10.1016/S0140-6736(86)90837-8. PMid:2868172.
92 J Vasc Bras. 2016 Apr.-June; 15(2):89-92 Techniques for analysis of agreement
3. Kuo BI. Intraclass correlation coefficient rather than correlation coefficient to examine agreements among different methods measuring valvular area. Circulation. 1994;89(4):1910-1. http:// dx.doi.org/10.1161/01.CIR.89.4.1910. PMid:8149563.
4. Lee KM, Lee J, Chung CY, et al. Pitfalls and important issues in testing reliability using intraclass correlation coefficients in orthopaedic research. Clin Orthop Surg. 2012;4(2):149-55. http:// dx.doi.org/10.4055/cios.2012.4.2.149. PMid:22662301.
5. Zaki R, Bulgiba A, Ismail R, Ismail NA. Statistical methods used to test for agreement of medical instruments measuring continuous variables in method comparison studies: a systematic review. PLoS One. 2012;7(5):e37908. http://dx.doi.org/10.1371/journal. pone.0037908. PMid:22662248.
6. Sim J, Wright CC. The kappa statistic in reliability studies: use, interpretation, and sample size requirements. Phys Ther. 2005;85(3):257-68. PMid:15733050.
7. Barros FS, Perez JM, Zandonade E, et al. Evaluation of pelvic varicose veins using color Doppler ultrasound: comparison of results obtained with ultrasound of the lower limbs, transvaginal ultrasound, and phlebography. J Vasc Bras. 2010;9(2):15-23. http:// dx.doi.org/10.1590/S1677-54492010000200002.
8. Fleiss JL, Cohen J. The equivalence of weighted kappa and the intraclass correlation coefficient as measures of reliability. Educ Psychol Meas. 1973;33(3):613-9. http://dx.doi.org/10.1177/001316447303300309.
9. Mandrekar JN. Measures of interrater agreement. J Thorac Oncol. 2011;6(1):6-7. http://dx.doi.org/10.1097/JTO.0b013e318200f983. PMid:21178713.
10. Brianezi G, Minicucci EM, Marques ME, Miot HA. Evaluation epidermal p53 immunostaining by digital image analysis. Skin Res Technol. 2013;19(1):e108-12. http://dx.doi.org/10.1111/j.1600-0846.2012.00616.x. PMid:22672779.
11. Moura RM, Gonçalves GS, Navarro TP, Britto RR, Dias RC. Transcultural adaptation of VEINES/QOL-Sym questionnaire: evaluation of quality of life and symptoms in chronic venous disease. J Vasc Bras. 2011;10:17-23. http://dx.doi.org/10.1590/ S1677-54492011000100004.
12. Leal FD, Couto RC, Pitta GB. Validation in Brazil of a Questionnaire on Quality of Life in Chronic Venous Disease (Aberdeen Varicose Veins Questionnaire for Brazil/AVVQ-Brazil). J Vasc Bras. 2015;14(3):241-7. http://dx.doi.org/10.1590/1677-5449.0025.
13. Commenges D, Jacqmin H. The intraclass correlation coefficient: distribution-free definition and test. Biometrics. 1994;50(2):517-26. http://dx.doi.org/10.2307/2533395. PMid:8068852.
14. Conrad C, Chamlian TR, Ogasowara MS, Pinto MA, Masiero D. Translation into Brazilian Portuguese, cultural adaptation and validation of the Prosthesis Evaluation Questionnaire. J Vasc Bras. 2015;14(2):110-4. http://dx.doi.org/10.1590/1677-5449.0038.
15. Prieto L, Lamarca R, Casado A, Alonso J. The evaluation of agreement on continuous variables by the intraclass correlation coefficient. J Epidemiol Community Health. 1997;51(5):579-81. http://dx.doi. org/10.1136/jech.51.5.579-a. PMid:9425473.
16. Shrout PE, Fleiss JL. Intraclass correlations: uses in assessing rater reliability. Psychol Bull. 1979;86(2):420-8. http://dx.doi. org/10.1037/0033-2909.86.2.420. PMid:18839484.
17. Ianhez M, Fleury LF Jr, Bagatin E, Miot HA. The reliability of counting actinic keratosis. Arch Dermatol Res. 2013;305(9):841-4. http:// dx.doi.org/10.1007/s00403-013-1413-y. PMid:24045957.
18. Banerjee M, Capozzoli M, McSweeney L, Sinha D. Beyond kappa: a review of interrater agreement measures. Can J Stat. 1999;27(1):3-23. http://dx.doi.org/10.2307/3315487.
19. Miot HA. Sample size in clinical and experimental trials. J Vasc Bras. 2011;10:275-8.
20. Zou GY. Sample size formulas for estimating intraclass correlation coefficients with precision and assurance. Stat Med. 2012;31(29):3972-81. http://dx.doi.org/10.1002/sim.5466. PMid:22764084.
21. Donner A, Bull S. Inferences concerning a common intraclass correlation coefficient. Biometrics. 1983;39(3):771-5. http://dx.doi. org/10.2307/2531107. PMid:6652207.
*
Correspondence
Hélio Amante Miot Universidade Estadual Paulista – UNESP, Botucatu Medical School, Department of Dermatology Av. Prof. Mário Rubens Guimarães Montenegro, s/n - Campus Universitário de Rubião Junior CEP 18618-687 - Botucatu (SP), Brazil Tel.: +55 (14) 3882-4922 E-mail: [email protected]
Author information