Description of the quality indicators deined
in the National Reference Laboratory in
Tuberculosis of CRPHF/Ensp/Fiocruz by means
of the process mapping methodology
Descrição dos indicadores da qualidade definidos pelo Laboratório de
Referência Nacional em Tuberculose do CRPHF/Ensp/Fiocruz por meio da
metodologia de mapeamento de processos
Aila Maronna; Renata A. Souza; Fatima Cristina O. F. Montes
Fundação Oswaldo Cruz (Fiocruz), Rio de Janeiro, Brazil.
First submission on 18/08/15; last submission on 22/04/17; accepted for publication on 23/04/17; published on 20/06/17
ABSTRACT
Introduction: The National Reference Laboratory (LRN) in Tuberculosis (TB) is a laboratory unit of highly specialized technical excellence that has developed projects involving training in human resources and the enhancement of techniques essential for the diagnosis of TB. Its purpose is the continuous improvement of all laboratory processes and their quality management, with the purpose of collaborating
on and strengthening the actions in the network that integrate it in the aid of surveillance and in the ight against TB. Objectives: This
research aims to describe the quality indicators that were deined through the process mapping methodology, with the objective of promoting
and raising the level of quality and reliability of the different laboratory processes performed at LRN in TB. Method: For the deinition of
indicators, process mapping was used which, through low charts, can establish and determine the most appropriate indicators for LRN in TB. After deining these indicators, they were described with their respective titles, preventive and corrective measures, importance and
goals. Results: The results of the research suggest that the established indicators are fundamental for the laboratory processes, since they
improve quality management. Conclusion: Through this study, we seek to encourage and impel the managers involved in the ield of
TB and in the ield of health on the utility and the need to control and measure processes, being able to standardize them with the help of indicators or other quality tools.
Key words: indicators of quality in health care; total quality; total quality management; tuberculosis.
INTRODUCTION
During decades the concept of quality has evolved from simple adequation to standard to adequation to clients’ needs, which have
become more and more evident over the years(1-3).
Concerning healthcare, in the beginning, the theme quality was relevant for just a small group of physicians enlightened
on the subject. Later, in the early 20th century, quality assurance
appeared in the United States. It can be considered the irst method of ensuring quality in health(4).
Around the years 1970s and the late 1980s, according to the precept that each citizen has the right to have the most adequate service that medicine can offer, the World Health Organization (WHO) took measures designed to develop assurance of quality in
health systems(4-8).
In 1998, the Joint Commission on Accreditation of Hospitals, created in 1951 in the United States, became the Joint Commission on Accreditation of Healthcare Organizations (JCAHO), aimed at following and monitoring the quality of provided health services by consultancy, accreditations, certiications or education in this
ield(6, 9-11).
By means of this practice and the support from WHO, many other countries have built different and new methods to monitor and assess quality in health. As a consequence, at the end of the 1980s, in Latin American countries, concern for quality was started by government incentive. The motivation was the creation of models for hospital accreditation, which were initiated by the Pan American Health Organization (PAHO) and by the Federación Latinoamericana de Hospitales(4, 6, 8, 10, 12, 13).
In Brazil, the concept of quality was disseminated also by the accreditation of health services, which began in 1986, when Colégio Brasileiro de Cirurgiões [the Brazilian College of Surgeons (CBC)] created the Commission of Hospital Assessment. Another meaningful point for the evolution of the concept of quality in health in Brazil was the easy access to information that the users of these services gained, by the creation of the Consumer Defense Code, on September 11, 1990, and Manual dos direitos dos pacientes (the manual of patients’ rights), on October 26, 1993(4, 6, 8, 10, 12-16).
In 1991, having as support the creation of the manual of accreditation standards for Latin America, prepared by WHO and PAHO, accreditation programs were run as the irst mechanisms proposed for hospital accreditation(6, 8, 10, 12).
Based on the importance of accreditation programs in Brazil, in 1994, the Ministry of Health (MH) developed the Programa de Avaliação e Certiicação de Qualidade em Saúde [Program of Evaluation and Certiication of Quality in Health (PACQS)]. That program counted on voluntary participation, aimed at encouraging continuous improvement, harmonizing and creating basic criteria common to all hospitals. The program was only launched in 1998 and became the Consortium for Brazilian Accreditation (CBA)(6, 8, 10, 12).
In that same year, the irst edition of the Brazilian Manual of
Hospital Accreditation was published(14).
In 1999, the National Organization of Accreditation (ONA) was born, a private non-proit institution that has the function of regulating, setting standards, and monitoring the whole accreditation process in Brazil. And as a process resulting from this culture, in 2000, health institutions, such as hospitals, began to be evaluated and accredited by ONA and they could make use of this accreditation to praise their service, ensuring customer
loyalty(8-10, 12, 14, 17).
Finally, in 2001, the National Agency of Health Surveillance (Anvisa) oficially recognized the Brazilian Accreditation System to integrate even more the National System of Health Surveillance. As a result of this advance, three new accreditation manuals were created: hemotherapy, nephrology and renal replacement therapy
services, and clinical laboratories, which nowadays are in their
fourth edition(8-10, 12, 14, 17).
The clinical laboratory can be characterized as a physical structure directed to the conduction of laboratory tests and the practice of laboratory medicine. The aim of these laboratory tests is to help and provide correct diagnosis, as well as to avoid diseases, estimate the period of time of a disease and its prognosis, observe the impact of treatment, and analyze the presence of risk factors of harm to human health. Therefore, the conduction of a test can be traditionally divided in three phases: pre-analytical, analytical and post-analytical(18-22).
With this characteristic, a laboratory test is considered adequate when it is effective, clear, and objective, being available to the population.
The concept of quality in clinical laboratories in Brazil progressed through the same reasoning employed in the several health areas. Within this context, the Sociedade Brasileira de Patologia Clínica/Medicina Laboratorial (SBPC/ML) has been the pioneer in issues about accreditation and laboratory quality(19-21, 23, 24).
In 1994, in its statute, SBPC/ML already characterized the construction and consolidation of standards as objectives for the conduction of countless laboratory tests. And during the 1970s decade, it presented by means of an own publication in the Brazilian Journal of Clinical Pathology a proposal for revising and adapting the practices of the American College of Pathologists
(ACP) to the Brazilian reality(8, 23, 24).
In 1976, in Brazil, the National Program of Quality Control (PNCQ) was set up. In 1977, another important hallmark in this scenario was the creation of Control-Lab, designed to create opportunities for clinical laboratories to participate in wider quality control programs. In the same period SBPC/ML and Control-Lab created a program for internal and external quality control, unheard-of in the country, termed Program of Excellence in Medical Laboratories (PELM)(8, 24-26).
In 1998, by means of the already established partnership between Control-Lab and SBPC/ML, the Program of Accreditation of Clinical Laboratories (PALC) was created, which in its turn was revised and up-to-dated in the following years (2004, 2007, and 2010)(8, 18, 24, 27).
Qualidade e Tecnologia (Cgre/Inmetro), which is the accreditation body of conformity assessment bodies recognized by the Brazilian
government.
Due to the great importance given to analytical results released by a clinical laboratory, Brazil has several laboratory networks that require their participants to have internationally recognized management systems, seeking this recognition by
government bodies(21).
According to a survey carried out by the Brazilian Institute of Geography and Statistics (IBGE) in 2014, there are approximately 16,650 clinical laboratories in the country, of which 4,917 are public and 11,970 are private. The quality management systems for clinical laboratories intend to provide reliability in results, bringing users closer and closer to these establishments. Nowadays around 70% of results released by clinical laboratories are responsible for the crucial information directly affecting medical decision(8, 21, 28).
Quality indicators are procedures of measurement indispensable for organizations to have success in their processes. A noteworthy and very important particularity in the use of these tools is their simplicity, easy access, along with the low cost, uncomplicated understanding of these methods, which provide their propagation and application in the organizational
setting(12, 29).
Indicators also appear in strategic management as forms of representation that contribute to managers’ decision taking, being seen as the foundation of this type of management(12, 22, 29, 30).
Consequently, indicators can be deined as follows: graphically represented qualitative or quantitative information, able to show productivity evolution and performance, of processes involved in products and the services that organizations offer regarding eficacy, eficiency, or satisfaction level. Performance indicators, as they are also known, can be associated with a behavior of processes, characterizing the following conditions: cost, proit, production cycle, rework, degree of use of raw material, and conformity of products(12, 22, 29, 30).
The indicators deined and established at an institution must be clearly and objectively described, being composed of: a title, a comparative referential, a numeric value (mathematical relationship), its importance, goals, and preventive and corrective measures – that will be able to demonstrate success or failure of a speciic process. The goals are the aims or objectives to be met and they are the key agents of the enterprise management process(12, 22, 29, 30).
In order to create an eficient indicator, it is advisable to follow some parameters, which are the basis of the implementation
method used in organizations, so that indicators show their actual applicability and safety. They are: selectivity, extent, simplicity, clarity, traceability, speciicity and stability, accessibility, accuracy and low cost(9, 12, 22, 29-31).
Indicators are seen as quality parameters, in which performance and behavior of a process are classiied as satisfactory when they are within the established limits. They are considered items of measurement of an operation, activity, or process, essential for guidance of policies of action and planning that integrate programs of several areas(8, 12, 22).
Some efforts have been made to standardize indicators in the health ield. In Brazil, the Information Technology Department of the Uniied Health System (Datasus), organ of the MH, makes available in its site some indicators that can be used in this scenario. Another means that offers basis in questions on health indicators is the publication of basic indicators of health in Brazil: concepts and applications, of the Inter-Agency Network for Health
Information (Ripsa), also of the MH, in partnership with PAHO(12).
Different studies have been carried out lately due to the importance of indicators in this ield. Those studies use benchmarking practices and describe the indicators that are usually more employed in clinical laboratories, for example, enabling other laboratories to use these indicators to control their
processes seeking continuous improvement(8, 22).
As a consequence of those studies, new versions of the JCAHO accreditation manuals and the PALC norm have already brought in their requisites for the use of indicators in laboratory management, allowing for these laboratory indicators to be responsible for providing an evaluation of eficacy and eficiency of these several phases that make a laboratory test. More recently, a Program of Laboratory Indicators was devised, through the partnership of Control-Lab and SBPC/ML, which provides clinical laboratories the means to measure, compare and standardize their activities and processes with the indicators
established by Control-Lab(22).
Tuberculosis (TB) is considered one of the most ancient diseases of mankind. Its causing agent is the Koch bacillus, which was so named in honor of the scientist that described it. Robert Koch identiied, in 1882, a slow-growth bacterium that caused
the disease: the Mycobacterium tuberculosis. Today we know other ive species that are listed as causing TB, forming a complex
termed M. tuberculosis(32-34) complex (MTBC).
occur per year; approximately three million of these cases die because of the disease. In Brazil the occurrence of 70 thousand cases is estimated per year, so it is one of the 22 countries given priority by WHO that concentrate 80% of the world TB burden. Rio de Janeiro is the state that displays the highest incidence rates (73.8 cases per 100 thousand inhabitants) and mortality (5.4 deaths per 100 thousand inhabitants) in the country, which presents 21 municipalities of priority for TB control due to other epidemiological characteristics, mainly concentrated in the metropolitan region of the state(32-35).
On that account, in 1993, WHO publicly stated that TB is a world emergency and started recommending the adoption of the strategy Directly Observed Therapy Short Course (DOTS) as a
global response to control the inirmity(32-35).
Due to the continuing problem, along with the high rates of treatment dropouts, and with low percentage of cure and detection of cases, in 1988 the Tuberculosis Control National Program (PNCT) was launched in Brazil. That program incorporated some innovations such as coverage expansion, supervised treatment (recommended by the new DOTS strategy), and a new form of resource transfer to municipalities, which is provided in the form of bonus(32-35).
In that same period of the 1990 decade, Brazil went through a process of change in the health public system. Those alterations came from the creation of the Brazilian Uniied Health System (SUS). That is how the National System of Public Health Laboratories (Sislab) was born(32-35).
Sislab was deined by Ordinance 2031 from 2004 of MH as a group of laboratories networks that were planned according to a disease or program, hierarchically according to the complexity degree of activities related to health surveillance. The laboratory networks comprise epidemiological surveillance, environmental surveillance, sanitary surveillance, and attention to health. Thus their subnetworks are deined as: collaborating centers (CC), national reference laboratories (LRN), regional reference laboratories (LRR), state reference laboratories (LRE), municipal reference laboratories (LRM), local laboratories (LL), and frontier laboratories (LF)(36).
Within this classiication, LRN are laboratory units that have as competencies to perform high-complexity procedures that complement diagnosis and the analytical quality of the whole network, besides technically coordinating the laboratory surveillance network, assisting the national manager in the monitoring, normalization, standardization, and in the evaluation of laboratory activities, among other responsibilities(36). In the
case of TB, the LRN in TB is inserted in the Centro de Referência Professor Hélio Fraga (CRPHF), a departmental unit of Escola
Nacional de Saúde Pública Sergio Arouca (Ensp) of Fundação Oswaldo Cruz (Fiocruz), in the city of Rio de Janeiro, Brazil.
The LRN in TB has as part of its attributions the conduction of tests such as bacilloscopy, culture (bacterial isolation), identiication of mycobacteria of MTBC and mycobacteria not belonging to that complex [non-tuberculous mycobacteria (NTM)], and traditional and automated sensitivity tests to antimicrobials, besides methods of molecular biology that contribute to identiication of tuberculous and non-tuberculous mycobacterial species, and in the detection of mutations that conirm resistance to antimicrobials. In 2006, the LRN in TB went through reforms using the international standard of biosecurity. With the implementation of this concept, a decisive step was taken to follow a new model for the public health laboratory network, which has as its cornerstone the concern with observation of norms of human security, environmental, and of quality systems in their greater focus(22, 36).
Therefore, to meet the norms established by the MH and society demands, the LRN opened in 2006 the level 3 laboratory of biosecurity with new facilities, according to international biosecurity standards for work with TB(22, 36, 37).
It is worthy stressing that this laboratory already has a system of quality management implemented and accredited by the Coordenação Geral de Laboratórios [General Coordination of Laboratories (CGLAB)]/Secretaria de Vigilância Nacional [Secretariat of National Surveillance (SVS)] of MH, according to ABNT NBR ISO/IEC 17025 norm. Since 2008, the LRN in TB began migration of its system to the ABNT NBR NM ISO 15189 norm, speciic for laboratories that manipulate and carry out tests with biological samples. Nowadays the laboratory has implemented in its quality management system (QMS) the ABNT NBR NM ISO 15189 norm, but, in spite of this, there are no indicators of quality deined for the technical activities of the laboratory(22, 36).
It is important that at a LRN, quality indicators are well deined, as these are laboratory units of technical excellence, highly specialized in their areas and fundamental for strategies of
public health in the country, as previously mentioned(22, 36).
In this context, the deinition and the description of quality indicators stand out as an important tool for measurement and analysis of the different technical activities, supporting, thus, the establishment of improvement and decision taking by the respective managers(22, 33, 34, 35, 37).
indicators results from the description of these indicators, and, in its turn, the description of these indicators happens by their deinition, using the process mapping methodology to deine the most adequate ones to be used in the main processes carried out at the LRN in TB, aiming to assess performance, eficiency, and eficacy of these tests, ensuring reliability in the results released
by the laboratory.
Given the hierarchical strategic public health importance of LRN in TB, it is vital that quality indicators are deined and described to meet the requirements of the technical norm implemented there, besides providing the monitoring of technical processes aimed at continuous improvement.
OBJECTIVES
• Map the processes involved in the tests by means of process mapping methods;
• deine quality indicators for the major processes carried out at the LRN in TB;
• describe indicators: name them, deine the importance of each one, establish goals and recommend corrective and/or preventive measures for their potential deviations.
METHOD
The methods used in this study were divided into steps, in which some tools were employed to reach these objectives. They are:
• proile of the enterprise; • process mapping;
• indicators deinition and description.
The proile and the presentation of the enterprise used in this study were based on the deinition model of enterprise proile employed in the excellence criteria of the National Quality Prize. That proile encompasses the description of some pieces of information responsible for creating the image of an enterprise proile. They are: composition of a society or identiication of supporting or founder members; society – main communities with which the organization keeps relationships; QMS; purpose and size; clients and market; main facilities; workforce; suppliers and inputs; operational system/computerized system; products and processes(29, 38).
Information items to build up the enterprise proile of LRN in TB were obtained from the following documents:
• internal documents: Manual of Tuberculosis Bacteriology; Laboratory Quality Manual of Tuberculosis Bacteriology; Management Procedure 13 – plan for residues of health services of Sislab; Management Procedure 14 – risk classiication;
• external documents: Ordinance no. 15 of the National Health Foundation (Funasa), reissued by SVS on September 23, 2004, with no. 2031; Ordinance no. 70, from 2004, MH, SVS; Ordinance no. 97, from 2008, MH, SVS.
The analysis of process mapping began with a list of steps/ questions described in a way to reveal the activities involved in that process. That proposal was formulated speciically for this study,
based on Villela’s(38) proposal. The questions are:
1) what is the objective of this process? 2) what are the inputs?
3) what are the outputs?
4) which resources are used in terms of work, equipment, materials, budget, and time?
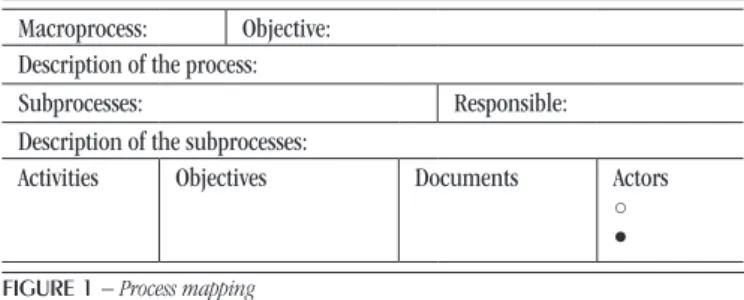
After answering those questions, Figure 1 was developed,
which presents process mapping. As results of these tables’ descriptions, low charts were prepared for each process.
Definition and description of indicators
At this moment of methodology, a survey was carried out of information based on the view and strategy of the institution, using process mapping and its low charts, able to identify critical points and chose quality indicators, in agreement with its goals, which would be able to act eficiently and effectively on processes
relevant to the laboratory.
The information and data obtained during the study are presented in the topic “Results”, under tables and igures to better clarify them.
Macroprocess: Objective:
Description of the process:
Subprocesses: Responsible:
Description of the subprocesses:
Activities Objectives Documents Actors
○ ●
FIGURE 1 − Process mapping
Macroprocesses: the main clinical assays of LRN were characterized; objective: the purpose of each clinical assay was reported; process description: the groups of activities connected with each macroprocess were portrayed; subprocesses and description of subprocesses: all the steps were described that are directly linked to each process and that support the macroprocess; responsible: the responsible ones for each subprocess were listed; activities and objectives: all activities and specific objectives were detailed that occur in processes and subprocesses, which produce a particular result; documents: all the documents were described that are used in the respective activities; actors: were represented by the LRN sectors and divided into two classes: committed actors – sectors directly committed to the activities and the macroprocess; involved actors – sectors that help some activities and the macroprocess.
RESULTS
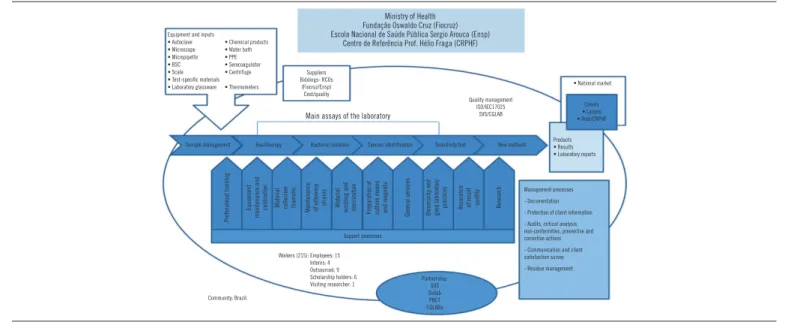
The information to build up the enterprise proile were divided in topics, and, then, they were put together to come up with the
laboratory proile design. Figure 2 presented the description of the
information responsible for characterizing the proile of LRN in TB. Subsequently, we had the description of information responsible for detailing the processes mapping of LRN in TB, expressed in low charts for each process:
• Figure 3 presented and elucidated the macroprocess of
sample management;
• Figure 4 presented and elucidated the macroprocess of
bacilloscopy;
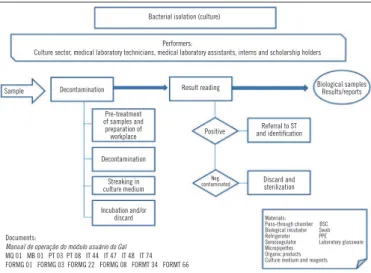
• Figure 5 presented and elucidated the macroprocess of cell
culture assay;
• Figure 6 presented and elucidated the macroprocess of the
assay identiication of MTBC and NTM species;
• Figure 7 presented and elucidated the macroprocess of
sensitivity test assay;
• Figure 8 presented and elucidated the macroprocess of new
methodology assay.
FIGURE 2 – Enterprise profile
PPE: personal protection equipment; BSC: biological safety cabinet; SVS: Secretaria de Vigilância Nacional; Lacens: Laboratórios Centrais de Saúde Pública; RCO: mandatory insurance of civil responsibility; SUS: Unified Health System; Sislab: National System of Public Health Laboratories; PNCT: Tuberculosis Control National Program; CGLAB: Coordenação Geral de Laboratórios.
Sample management
Performers:
Reception sector and laboratory technicians in charge of the sectors
Samples Attendance and
sample reception Sample screening
Numerated samples refferred
to sectors
Pocedure of order and sample delivery
Check, evaluation and identification of
samples
Registry at GAL and
referral of sample Storage
Documents:
Manual de operação do módulo usuário do Gal
MQ 01 MB 01 PG 08 PG 10 PT 01 PT 12 IT 44 IT 51 IT 53 IT 56 FORMG 01 FORMG 03 FORMG 04 FORMG 05 FORMG 14 FORMG 16 FORMG 34
Materials: Pass through chamber Computer Refrigerator BSC PPE
FIGURE 3 – Flow chart of sample management
GAL: Gerenciador de Ambiente Laboratorial; BSC: biological safety cabinet; PPE: personal protection equipment.
Bacilloscopy
Performers:
Bacilloscopy sector, medical laboratory technicians, medical laboratory assistants, interns, scholarship holders
Sample Smear preparation Slide staining Slide reading
Slides and results/reports
Preparation and disinfection of
workplace Smear fixation
Slide reading and storage
Sample identification
and preparation Staining
Result and report release
Smear confection, referral, storage and/or
sample discard
Referral to reading room
Materials: Pass through chamber BSC Plastic bag Slide Refrigerator PPE Microscope Dyes Wood applier Documents
Manual de operação do módulo do usuário do Gal
MQ 01 MB 01 PT 02 PT 08 PT 12 IT 02 IT 44 IT 46 IT 51 IT 53 IT 56 FORMG 01 FORMG 03 FORMT 22 FORMT 34 FORMT 60 FORMT 66
FIGURE 4 – Flow chart of bacilloscopy assay
BSC: biological safety cabinet; PPE: personal protection equipment.
Ministry of Health Fundação Oswaldo Cruz (Fiocruz) Escola Nacional de Saúde Pública Sergio Arouca (Ensp)
Centro de Referência Prof. Hélio Fraga (CRPHF)
Equipment and inputs
• Autoclave • Microscope • Micropipette • BSC • Scale • Test-speciic materials • Laboratory glassware
• Chemical products • Water bath • PPE • Serocoagulator • Centrifuge • Thermometers
Suppliers Biddings- RCOs
(Fiocruz/Ensp) Cost/quality
Quality management ISO/IEC17025
SVS/CGLAB
• National market
Clients
• Lacens • Amb/CRPHF
Main assays of the laboratory
Sample management Bacilloscopy Bacterial isolation Species identification Sensitivity test New methods Products• Results • Laboratory reports
Biosecurity and good laboratory
practices Assurance of result quality Research
Professional training
Equipment
maintenance and
calibration Material collection (sample)
M
ai
nt
en
an
ce
of reference strains Material washing and sterilization Preparation of culture means and reagents
General services
Partnership: SUS Sislab PNCT CGLABa Workers (215): Employees: 15
Interns: 4 Outsourced: 9 Scholarship holders: 6 Visiting researcher: 1
Community: Brazil.
Management processes
- Documentation
- Protection of client information
- Audits, critical analysis, non-conformities, preventive and corrective actions
- Communication and client satisfaction survey
Materials: Pass-through chamber BSC Biological incubator Swab Refrigerator PPE Serocoagulator Laboratory glassware Micropipettes
Organic products Culture medium and reagents
Bacterial isolation (culture)
Performers:
Culture sector, medical laboratory technicians, medical laboratory assistants, interns and scholarship holders
Sample Decontamination Result reading Biological samplesResults/reports
Pre-treatment of samples and preparation of
workplace Positive
Referral to ST and identification Decontamination Streaking in culture medium Discard and sterilization Neg. contaminated Incubation and/or discard Documents:
Manual de operação do módulo usuário do Gal MQ 01 MB 01 PT 03 PT 08 IT 44 IT 47 IT 48 IT 74 FORMG 01 FORMG 03 FORMG 22 FORMG 08 FORMT 34 FORMT 66
FIGURE 5 – Flow chart of bacterial isolation (culture) assay
ST: sensitivity test; BSC: biological safety cabinet; PPE: personal protection equipment.
Species identification
Performers:
Species identification sector, medical laboratory technicians, medical laboratory assistants, interns and scholarship holders
Samples Screening (Culture or biochemistry)Phenotypical methods (genetic probe, PCR-PRAMolecular methods or sequencing)
Reports and/or referral to ST
Culture observation
FIGURE 6 – Flow chart of MTB and NTM species identification assay
PCR-PRA: polymerase chain reaction-pattern restriction analysis; ST: sensitivity test; BSC: biological safety cabinet; PPE: personal protection equipment; MTBC: M. tuberculosis complex; NTM: non-tuberculous mycobacteria.
Preparation and disinfection of workplace Preparation and disinfection of workplace Documents:
Manual de operação do módulo de usuário do Gal
MQ 01 MB 01 PT 04 PT 08 PT 13 PT 14 IT 13 IT 14 IT 15 IT 16 IT 18 IT 20 IT 21 IT23 IT 25 IT 31 IT 33 IT 34 IT 34 IT 36 IT 44 IT 47 IT 51 IT 53 IT 58 IT 59 IT 60 IT 74 FORMG 01 FORMG 03 FORMG 22 FORMT 34 FORMT 65 FORMT 66 FORMT 09
Sample identification Differentiation of samples MTBC/NTM: macroscopic and/ or microscopic analyses Sample preparation, DNA extraction and
amplification and detectionHibridization, Suspension and
streaking in the culture medium and/or emulsion of loops of
cultures from samples performanceTechnique
Digestion, restriction and reading at the site
Sample referral
Incubation and/or addition of reagents of the technique
and discard
Materials: Pass-through chamber BSC Biological incubator Refrigerator
PPE Laboratory glassware
Micropipettes Inputs of techniques Culture medium and reagents Equipment of techniques Sample reading
and result release
Purification, PCR of sequencing, denaturation, sequencing and result analysis Sample reading
and result release
Documents:
Manual de operação do módulo usuário do Gal
MQ 01 MB 01 PT 05 PT 08 PT 17 IT 44 IT 51 IT 53 IT 72 IT 73 IT 74 FORMG 01 FORMG 03 FORMG 22 FORMT 33 FORMT 34 FORMT 66 FORMT
Drug sensitivity tests
Performers:
Sector of sensitivity test, medical laboratory technicians, medical laboratory assistants, interns and scholarship holders
Samples Screening Method of proportions
(indirect test)
Automated method BACTEC MGIT 960 for
1st and 2nd line
Reports and/or orders for new tests
Observation
of the culture Preparation and disinfection of workplace
Preparation and disinfection of workplace Identification and
storage of samples suspension and Preparation of dilution Preparation of suspension and dilution Sample referral Streaking in culture media and
incubation
Inoculation in liquid media and
incubation
Reading of samples and result release
Reading of samples and result release
Materials:
Pass-through chamber BSC Biological incubator 1st- and 2nd-line drugs PPE Laboratory glassware
Micropipettes Inputs of techniques
Culture medium and reagents BACTEC MGIT 960
FIGURE 7 – Flow chart of the sensitivity test assay
New methods
Performers:
Medial laboratory technicians, medical laboratory assistants, interns, scholarship holders enabled to the conduction of assays of new methods
Samples Xpert gene MPT 64 Bioeasy MTBDR plus Hain Results and/orreports
Preparation and disinfection of workplace Preparation and disinfection of workplace Preparation and disinfection of workplace Sample processing
and discard Sample processing and discard Sample processing, DNA extraction, and discard
Assay processing Assay processing DNA amplification,
hibridization, and detection
Documents:
Manual de operação do módulo usuário do Gal
MQ 01 MB 01 PG 08 PG 10 PT PT PT PT 08 IT 44 IT 74 FORMG 01 FORMG 03 FORMG 04 FORMG 05 FORMG16 FORMG 22 FORMT 34 FORMT 66
FIGURE 8 – Flow chart of new methodologies
BSC: biological safety cabinet; PPE: personal protection equipment.
Sample reading
and result release and result releaseSample reading
Sample reading and result release
Materials:
Pass-through chamber BSC Swab Pipettes Inputs of techniques
Tubes Equipment of techniques
PPE
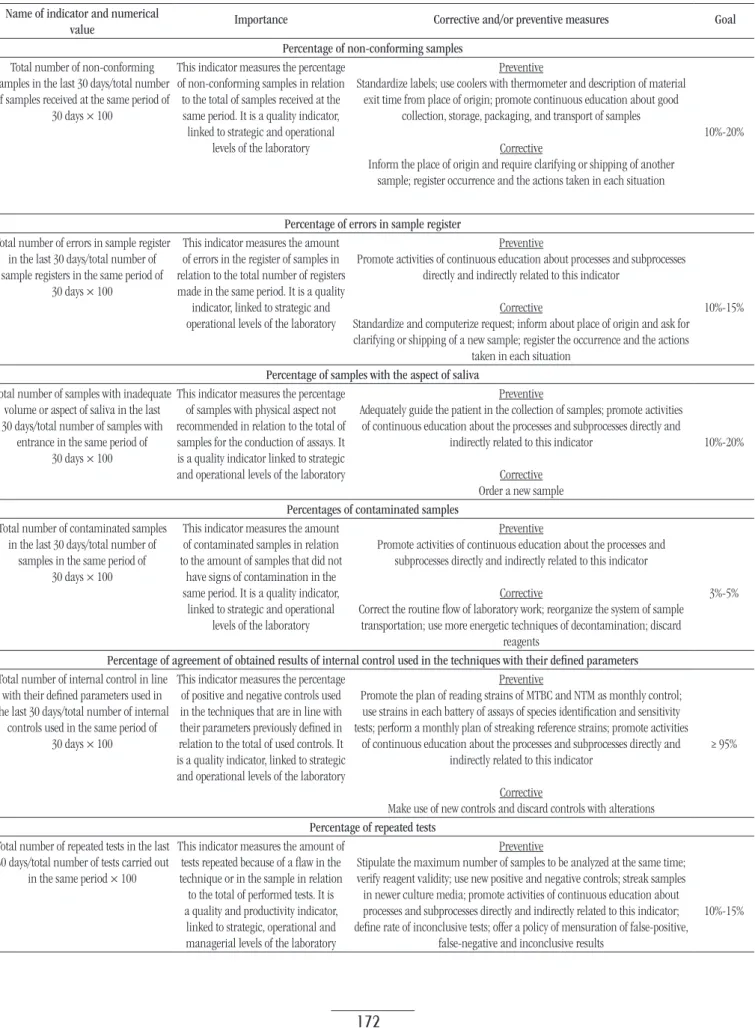
According to low charts of the processes of LRN in TB obtained by process mapping, the indicators deined were divided into two groups: indicators relevant to all processes and indicators
of eficacy of time of result release. Thus, Table 1 described the
indicators that were relevant to all processes, and Table 2, the
indicators that were related to time eficacy of result release.
DISCUSSION
TB also persists as an obstacle for world public health, mainly in Brazil. Over the decades, the development of operations in TB, the improvement of essential techniques that have been developed and the researches in this ield allowed for an improvement in the disease diagnosis, besides supplying the speciic knowledge for this scope(29, 34).
Thus, public health programs developed specially for TB control intend, in the beginning, to interrupt the disease transmission chain. This means that the faster the diagnosis is, the earlier the speciic treatment will be initiated. To this end, it is important that all processes intrinsic to disease diagnosis are well controlled and analyzed, mainly laboratory diagnoses which are the mainstay of medical decisions. Thus, the aim is to cancel any factor, error or law that can cause risk in these activities that are responsible for generating diagnostic results. As a consequence, the use of quality indicators is an example of tool that can aid the
experience of quality management(8).
TABLE 1 − Deinition and description of indicators relevant to all processes
Name of indicator and numerical
value Importance Corrective and/or preventive measures Goal
Percentage of non-conforming samples
Total number of non-conforming samples in the last 30 days/total number of samples received at the same period of
30 days × 100
This indicator measures the percentage of non-conforming samples in relation to the total of samples received at the same period. It is a quality indicator, linked to strategic and operational
levels of the laboratory
Preventive
Standardize labels; use coolers with thermometer and description of material exit time from place of origin; promote continuous education about good
collection, storage, packaging, and transport of samples
Corrective
Inform the place of origin and require clarifying or shipping of another sample; register occurrence and the actions taken in each situation
10%-20%
Percentage of errors in sample register
Total number of errors in sample register in the last 30 days/total number of sample registers in the same period of
30 days × 100
This indicator measures the amount of errors in the register of samples in
relation to the total number of registers
made in the same period. It is a quality indicator, linked to strategic and operational levels of the laboratory
Preventive
Promote activities of continuous education about processes and subprocesses directly and indirectly related to this indicator
Corrective
Standardize and computerize request; inform about place of origin and ask for clarifying or shipping of a new sample; register the occurrence and the actions
taken in each situation
10%-15%
Percentage of samples with the aspect of saliva
Total number of samples with inadequate volume or aspect of saliva in the last 30 days/total number of samples with
entrance in the same period of 30 days × 100
This indicator measures the percentage of samples with physical aspect not recommended in relation to the total of samples for the conduction of assays. It is a quality indicator linked to strategic and operational levels of the laboratory
Preventive
Adequately guide the patient in the collection of samples; promote activities of continuous education about the processes and subprocesses directly and
indirectly related to this indicator
Corrective Order a new sample
10%-20%
Percentages of contaminated samples
Total number of contaminated samples in the last 30 days/total number of
samples in the same period of 30 days × 100
This indicator measures the amount of contaminated samples in relation to the amount of samples that did not
have signs of contamination in the same period. It is a quality indicator,
linked to strategic and operational
levels of the laboratory
Preventive
Promote activities of continuous education about the processes and subprocesses directly and indirectly related to this indicator
Corrective
Correct the routine low of laboratory work; reorganize the system of sample transportation; use more energetic techniques of decontamination; discard
reagents
3%-5%
Percentage of agreement of obtained results of internal control used in the techniques with their deined parameters
Total number of internal control in line with their deined parameters used in the last 30 days/total number of internal
controls used in the same period of 30 days × 100
This indicator measures the percentage of positive and negative controls used in the techniques that are in line with their parameters previously deined in relation to the total of used controls. It is a quality indicator, linked to strategic and operational levels of the laboratory
Preventive
Promote the plan of reading strains of MTBC and NTM as monthly control; use strains in each battery of assays of species identiication and sensitivity tests; perform a monthly plan of streaking reference strains; promote activities
of continuous education about the processes and subprocesses directly and indirectly related to this indicator
Corrective
Make use of new controls and discard controls with alterations
≥ 95%
Percentage of repeated tests
Total number of repeated tests in the last 30 days/total number of tests carried out
in the same period × 100
This indicator measures the amount of tests repeated because of a law in the technique or in the sample in relation to the total of performed tests. It is a quality and productivity indicator,
linked to strategic, operational and
managerial levels of the laboratory
Preventive
Stipulate the maximum number of samples to be analyzed at the same time; verify reagent validity; use new positive and negative controls; streak samples in newer culture media; promote activities of continuous education about processes and subprocesses directly and indirectly related to this indicator; deine rate of inconclusive tests; offer a policy of mensuration of false-positive,
false-negative and inconclusive results
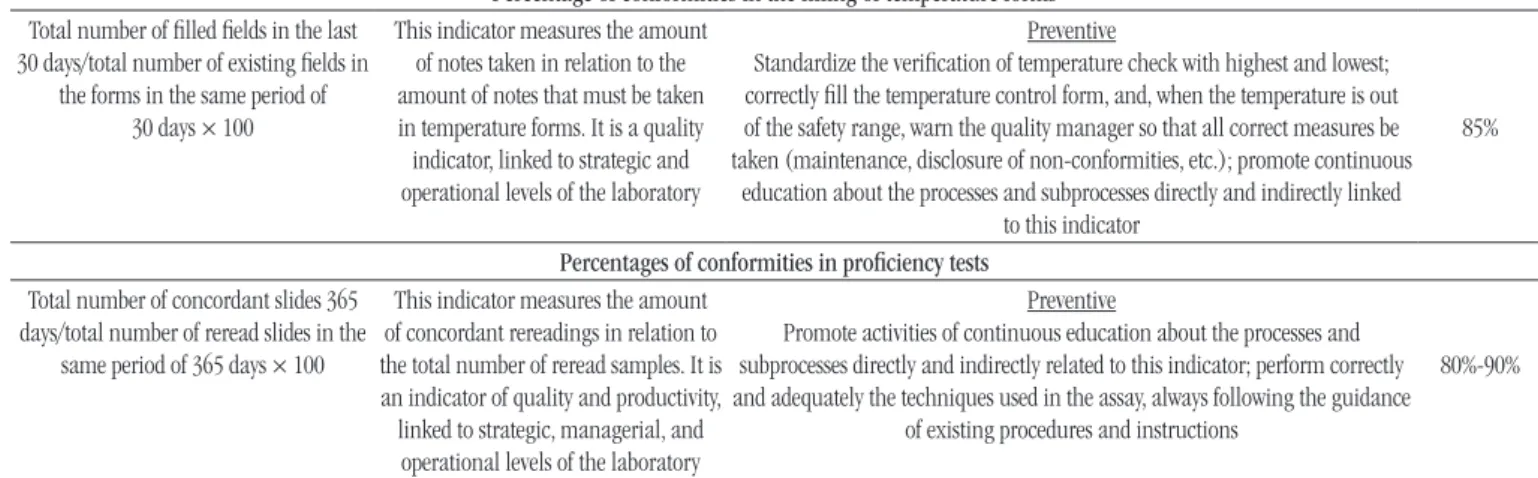
Percentage of conformities in the illing of temperature forms
Total number of illed ields in the last 30 days/total number of existing ields in
the forms in the same period of 30 days × 100
This indicator measures the amount of notes taken in relation to the amount of notes that must be taken in temperature forms. It is a quality indicator, linked to strategic and operational levels of the laboratory
Preventive
Standardize the veriication of temperature check with highest and lowest; correctly ill the temperature control form, and, when the temperature is out of the safety range, warn the quality manager so that all correct measures be taken (maintenance, disclosure of non-conformities, etc.); promote continuous
education about the processes and subprocesses directly and indirectly linked to this indicator
85%
Percentages of conformities in proiciency tests
Total number of concordant slides 365
days/total number of reread slides in the
same period of 365 days × 100
This indicator measures the amount of concordant rereadings in relation to the total number of reread samples. It is an indicator of quality and productivity, linked to strategic, managerial, and operational levels of the laboratory
Preventive
Promote activities of continuous education about the processes and subprocesses directly and indirectly related to this indicator; perform correctly and adequately the techniques used in the assay, always following the guidance
of existing procedures and instructions
80%-90%
MTBC: M. tuberculosis complex; NTM: non-tuberculous mycobacteria.
TABLE 2 − Deinition and description of eficacy indicators of result release time
Name of indicator and numerical
value Importance Corrective and/or preventive measures Goal
Percentage of bacilloscopy results released within 24 h after sample reception
Total number of results released within 24 h in the last 30 days × 100/total number of bacilloscopy results released
in the same period of 30 days
This indicator measures the amount of bacilloscopy results released within 24 h after sample reception
in relation to the amount of results
released per month. It is an indicator of productivity and exit, linked to managerial and operational levels of
the laboratory
Preventive
Conduct the bacilloscopy assay no longer than 4 h after sample registry; plan bacilloscopy assay: a) creation of a plan of veriication of biosafety cabinet work; b) creation of a checklist of inputs and materials that will be used in the bacilloscopy assay; c) creation of a monthly plan for preparation of solutions and
reagents; d) creation of a plan of instructions for the use of microscope; promote activities of continuous education about processes and subprocesses directly and
indirectly related to this indicator
Corrective
Identify in which moment delay is occurring: slide preparation, reading, result registration, report typing, and report release; reorganize worklow
85%-95%
Percentage of culture results released within 30 and/or 60 days
Total number of tests with results released within 30 and 60 days in the
last 30 days/total number of exams carried out in the same period of
30 days × 100
This indicator measures the amount of results released within 30 and 60
days in relation to all results released
in the same period. It is an indicator of productivity and exit, linked to managerial and operational levels of
the laboratory
Preventive
Plan the culture assay: a) creation of a plan for veriication of biosafety cabinet working; b) creation of a checklist of inputs and materials that will be used in the culture assay; c) creation of a monthly plan for preparation of solutions, reagents, and culture media; promote activities of continuous education about
the processes and subprocesses directly and indirectly related to this indicator
Corrective
Identify which moment delay is occurring: culture readings, result registration, typing of reports and shipping of reports; reorganize worklow
85%-95%
Percentage results of identiication species assays released within 30 days
Total number of tests with results released within 30 days in the last 30 days/total number of tests carried
out in the same period of 30 days × 100
This indicator measures the amount of results of species identiication released within 30 days in relation to all results released in the same period. It is an indicator of productivity and exit, linked to managerial and operational levels of the laboratory
Preventive
Plan the species identiication assay: a) creation of a plan for veriication of biosafety cabinet work; b) creation of a checklist of inputs and materials that will be used in the culture assay; c) creation of a monthly plan for preparation of solutions, reagents, and culture media; verify if from the moment positivity was detected in the culture, identiication tests were ordered up to result release; promote activities of continuous education about the processes and subprocesses
directly and indirectly relate to this indicator
Corrective
Identify in which moment delay is occurring: culture growth, culture reading, failure in molecular methods, problems with equipment, inputs, result registration, typing of reports and shipping of reports; reorganize worklow
85%-95%
Percentage of results of sensitivity test assays released within 30 days
Total number of tests with results released within 30 days in the last 30 days/total number of tests carried out in the same period of 30 days × 100
This indicator measures the amount
of results of sensitivity tests released
within 30 days in relation to all results released in the same period. It is an
indicator of productivity and exit, linked to managerial and operational
levels of the laboratory
Preventive
Plan the assay of sensitivity test: a) creation of a plan for veriication of biosafety cabinet work; b) creation of a checklist of inputs and materials that will be used in the culture assay; c) creation of a monthly plan for preparation of solutions, reagents, and culture media; promote activities of continuous education about the processes and subprocesses directly and indirectly related to this indicator
Corrective
Identify in which moment delay is occurring: culture growth, culture readings, failures in the methods, problems with equipment, inputs, result registration,
typing and shipping of reports; reorganize worklow
85%-95%
Percentage of assay results of Xpert gene released within 24 h after sample reception
Total number of results released within 24 h in the last 30 days/total number of results released in the same period
of 30 days × 100
This indicator measures the amount of results of assays of Xpert gene released within 24 h after sample reception in relation to the amount of
results released per month
Preventive
Plan the assay of Xpert gene: a) creation of a plan for veriication of biosafety cabinet work; b) creation of a checklist of inputs and materials that will be used
in the assay; c) creation of an instruction plan to use the device speciic of the technique; promote activities of continuous education about the processes and
subprocesses directly and indirectly related to this indicator
Corrective
Identify in which moment delay is occurring: failures in the method, problems with devices, inputs, result registration, typing and shipping of reports; reorganize
worklow
85%-95%
organization complexity and size, as well as its mission and
objectives(8). Hence the importance of detailing the enterprise
proile so that in the irst moment we can understand its actual category and its processes, with a systematic evaluation of processes being done next by means of process mapping and construction of low charts, which help managers understand and clarify critical points of each process that must be monitored so that there are no mistakes, laws or non-conformities, what always promotes the continuous improvement of laboratory quality as a whole(8).
Indicators help in standardization and deinition of quality speciications for the different processes and assays. However, there is still not a consensus on the best indicators to be used in laboratories. For this reason, in a irst moment, indicators were deined that can help quality management at the present moment, what does not avoid that later, by means of new critical points, internal audits, among others, deine new indicators, and
some that nowadays are implemented become obsolete(22).
Many barriers remain to build indicators in the health care ield, mainly in clinical laboratories specialized in speciic diseases, as it is the case of LRN in TB. One of the greatest barriers is the lack of information necessary to calculate indicators and the reliability of these data, which cannot be disregarded. However, calculating these indicators, even with all the dificulties, is fundamental to help in the enhancement of information quality. And the adoption
of a system of measurement management in the health sector is a determining factor for the success of the institutions that hinder services in this area(22).
When well administrated, indicators, both in the health area as in the other areas, are considered primary tools for the management of services and processes, having as main objective improving quality management. Thus, total quality management (TQM) does not mean only diagnostic control in the health area or production control in the other areas. TQM and the use of quality indicators encompass a management strategy that seeks efficiency and efficacy of the most diverse organizations, regardless of their size, activity, or acting field, being public or private. The processes that are part of this management context are responsible for the continuous enhancement of these enterprises, guiding them to higher levels of quality and competitiveness, using methodologies mainly supported in the management of these processes as an essential factor to measure and transform their form of
managing(17, 22).
RESUMO
Introdução: O Laboratório de Referência Nacional (LRN) em Tuberculose (TB) é uma unidade laboratorial de excelência técnica altamente especializada que tem desenvolvido projetos envolvendo a capacitação de recursos humanos e o aprimoramento de técnicas fundamentais para o diagnóstico da TB. Seu propósito é a melhoria contínua de todos os processos laboratoriais e a sua gestão da qualidade, com o intuito de colaborar e fortalecer as ações na rede que o integram no auxílio à vigilância e no combate da TB. Objetivos: Esta pesquisa tem a finalidade de descrever os indicadores da qualidade que foram definidos por meio do método de mapeamento de processos, com o objetivo de promover e elevar o nível da qualidade e da confiabilidade dos diferentes processos laboratoriais realizados no LRN em TB. Método: Para a definição dos indicadores, foi utilizado o mapeamento de processos que, por meio de fluxogramas, pode estabelecer e determinar os indicadores mais adequados para o LRN em TB. Após a definição desses indicadores, eles foram descritos com seus respectivos títulos, medidas preventivas e corretivas, importância e metas. Resultados:
Os resultados da pesquisa sugerem que os indicadores estabelecidos são fundamentais para os processos do laboratório, visto que melhoram a gestão da qualidade. Conclusão: Por intermédio deste estudo, buscamos incentivar e impulsionar os gestores envolvidos no campo da TB e no campo da saúde sobre a utilidade e a necessidade de controlar e medir os processos, podendo padronizá-los com a ajuda dos indicadores ou outras ferramentas da qualidade.
Unitermos: indicadores de qualidade em assistência à saúde; qualidade total; gestão de qualidade total; tuberculose.
REFERENCES
1. Aildefonso EC. Gestão da qualidade. Centro Federal de Educação Tecnológica do Espírito Santo. Ministério da Educação; 2006.
2. Fernandes WA. O movimento da qualidade no Brasil. INMETRO. Ministério do Desenvolvimento, Indústria e Comércio Exterior. Governo Federal Brasil: Essential Idea Publishing; 2011.
3. Martins RA, Costa Neto PLO. Indicadores de desempenho para a gestão pela qualidade total: uma proposta de sistematização. Gestão e Produção. 1998; 5(3): 298-311.
4. Serapioni M. Avaliação da qualidade em saúde. Relexões teórico-metodológicas para uma abordagem multidimensional. Revista Crítica de Ciências Sociais. 2009; 65-82.
5. Dias OV, Ramos LH, Costa SM. Avaliação da qualidade dos serviços de saúde na perspectiva da satisfação dos usuários. Revista Pró-univer SUS, Vassouras. 2010; 1(1): 11-26.
6. D‘innocenzo M. O movimento pela qualidade nos serviços de saúde e enfermagem. Rev Bras Enferm. 2006; 59(1): 84-8.
7. Organização Mundial da Saúde. Qualità dei servizi sanitari. Quaderni di sanità pubblica. 1988; 57: 4-36.
8. Vieira KF, Shitara ES, Mendes ME, et al. A utilidade dos indicadores da qualidade no gerenciamento de laboratórios clínicos. J Bras Patol Med Lab. 2011; 47(3): 201-10.
9. Akil F. Descrição dos processos rotineiros de uma agência transfusional e eleição de indicadores de qualidade [research project]. Rio de Janeiro: ENSP; 2012.
10. Feldman LB, Gatto MAF, Cunha ICKO. História da evolução da qualidade hospitalar: dos padrões a acreditação. Acta Paul Enferm. 2005; 18(2): 213-9.
11. Joint Comission. JCAHO. [Internet]. Accreditation. [accessed on:
October 2014]. Available at: www.jointcomission.org.
12. Soares SR, de Carvalho HA. Implementação de indicadores de qualidade e desempenho através do gerenciamento por projeto. Estudo de caso dos locais de produção de uma empresa em Curitiba. [Internet].
[accessed on: Oct. 2014]. Available at: www.unifae.br.
13. Organização Nacional de Acreditação. ONA. [Internet]. Histórico.
[accessed on: Oct. 2014]. Available at: www.ona.org.br.
14. Agência Nacional de Vigilância Sanitária. Anvisa. Acreditação: a busca pela qualidade nos serviços de saúde. Rev Saúde Pública. 2004; 38(2): 335-6.
15. Lourencetti E. A importância do consumidor e seus conceitos e princípios básicos no código de defesa do consumidor brasileiro.
CONCLUSION
This work is in line with what is described by literature concerning indicators. The results observed here conirm the importance of applying quality indicators as proitable and
[Internet]. [accessed on: Oct. 2014]. Available at: www.unibrasil.
com.br.
16. Ministério da Saúde. Portaria no. 1.286 de 26 de outubro de 1993.
[accessed on: Oct. 2014]. Available at: www.conselho.saude.gov.br.
17. Bonato VL. Gestão de qualidade em saúde: melhorando assistência ao cliente. O Mundo da Saúde, São Paulo. 2011; 35(5): 319-31.
18. Chaves CD. Controle de qualidade no laboratório de análises clínicas. J Bras Patol Med Lab. 2010; 46(5).
19. Lopes HJJ. Garantia e controle da qualidade no laboratório clínico. Gold Analisa Diagnóstica Ltda, Belo Horizonte. 2003.
20. Morita MLM, Balsin R, Farias N. Avaliação da qualidade da informação nas requisições e condições das amostras biológicas nos laboratórios de saúde pública Lapa e Ipiranga do município de São Paulo. Bepa. 2010; 7(79): 12-22.
21. Olivares IRB. Gestão de qualidade em laboratórios. Campinas: Editora Átomo; 2009.
22. Vieira KF. Impacto da implantação de um programa de acreditação laboratorial, avaliado por meio de indicadores de processo, num laboratório clínico de médio porte [dissertation]. São Paulo: Faculdade de Medicina da Universidade de São Paulo, Programa de Fisiopatologia Experimental; 2012.
23. Becker AA. A gestão do laboratório de análises clínicas por meio de indicadores de desempenho através da utilização do Balanced Scorecard [undergraduate paper]. Porto Alegre: Universidade Federal do Rio Grande do Sul; 2004.
24. Vieira LMF. Nova era para a acreditação de laboratórios. J Bras Patol Med Lab. 2005; 41(4).
25. Controllab [Internet]. Empresa. História. [accessed on: Oct. 2014].
Available at: www.controllab.com.br.
26. Programa Nacional de Controle da Qualidade. PNCQ [Internet]. O
PNCQ. Histórico. [accessed on: Nov. 2014]. Available at: www.pncq.org.br.
27. Graça RMT. A qualidade no laboratório clínico: uma tecnologia de gestão com ênfase na acreditação [dissertation]. Curitiba: Pontifícia Universidade Católica; 2005.
28. Instituto Brasileiro de Geograia e Estatística. IBGE. Notícias e comunicação. IBGE mostra quantos laboratórios há no Brasil. [Internet].
[accessed on: Mar. 2014]. Available at: www.sbpc.org.br.
29. Marshall Jr I, Rocha AV, Mota EB, et al. Gestão da qualidade e processos. Série Gestão Empresarial. 1 ed. Rio de Janeiro: Editora FGV; 2012. 30. Pereira AS. Utilização de indicadores de recursos humanos nas universidades federais brasileiras. Encontro de Administração Pública e Governo, Salvador, Bahia. 2012.
31. Klück M, Guimarães JR, Ferreira J, et al. A gestão da qualidade assistencial do Hospital de Clínicas de Porto Alegre: implementação e validação de indicadores. RAS. 2002; 4(16).
32. Souza Jr R. Avaliação da implantação do diagnóstico laboratorial de tuberculose no município de Goiânia-GO. 2012. 84f. [dissertation]. Escola Nacional de Saúde Pública Sérgio Arouca (ENSP), Fiocruz, Rio de Janeiro; 2012.
33. Ministério da Saúde. Manual de recomendações para o controle da tuberculose no Brasil. Secretaria de Vigilância em Saúde, Departamento de Vigilância Epidemiológica. Brasília (DF); 2011.
34. Pinheiro RS, Andrade VL, Oliveira GP. Subnotiicação da tuberculose no Sistema de Informação de Agravos de Notiicação (SINAN): abandono primário de bacilíferos e captação de casos em outras fontes de informação usando linkage probabilístico. Cad Saúde Pública, Rio de Janeiro. 2012; 28(8): 1559-68.
35. Rufino-Netto A. Programa de controle da tuberculose no Brasil: situação atual e novas perspectivas. Departamento de Medicina Social, Faculdade de Ribeirão Preto/USP. Informe Epidemiológico do SUS. 2001; 10(3): 129-38.
36. Brasil. Manual Nacional de Vigilância Laboratorial da Tuberculose e outras Micobactérias. 1 ed. Brasília (DF): Ministério da Saúde; 2008. 37. Barreto AMW, Martins FM, Campos CED, et al. Atividades desenvolvidas em 22 anos do Laboratório de Referência Nacional em Tuberculose. Bol Pneumol Sanit. 2006; 14(1): 33-42.
38. Villela CSS. Mapeamento de processos como ferramenta de reestruturação e aprendizado organizacional [dissertation]. Florianópolis: Universidade de Santa Catarina, Pós-graduação em Engenharia de Produção; 2012.
CORRESPONDING AUTHOR
Aila Maronna