Printed in Brazil - ©2007 Sociedade Brasileira de Química 0103 - 5053 $6.00+0.00
Article
*e-mail: [email protected]
Solid-Phase Extraction of Nitro-PAH from Aquatic Samples and its Separation by
Reverse-Phase Capillary Liquid Chromatography
Marcelo Toledo, Fernando M. Lanças and Emanuel Carrilho*
Instituto de Química de São Carlos, Universidade de São Paulo, Av. Trabalhador São-Carlense, 400, CP 780, 13560-970 São Carlos-SP, Brazil
Neste trabalho é proposta uma metodologia analítica para extrair 1-nitronaftaleno, 2-nitrofluoreno, 9-nitroantraceno, 3-nitrofluoranteno e 1-nitropireno como compostos modelos para nitropoliaromáticos (nitro-HPA) em amostras aquáticas. A cromatografia líquida capilar com detecção UV on-column (µLC-UV) foi empregada para separar e quantificar todos os
cinco nitro-HPA extraídos. Duas técnicas diferentes de extração foram testadas e comparadas: extração líquido-líquido (LLE) e extração em fase sólida (SPE) com dois diferentes tipos de sorbentes: partículas octadecilssilica (C18) e estireno divinilbenzeno (XAD-2). A eluição dos
analitos foi testada com diclorometano e acetonitrila. O melhor resultado de recuperação foi obtido para extração SPE – C18 com diclorometano com valores variando de 76 a 97% e valores de desvio padrão relativo menores que 4%. As condições cromatográficas para análise foram desenvolvidas empregando uma coluna capilar (250 × 0,3 mm) empacotada com partículas C18
de 5 µm com eluição isocrática de 65% de acetonitrila em água (v/v) com vazão de 7 µL min-1. Os
limites de detecção obtidos no sistema UV on-column (abrangendo de ~3 a 30 µmol L-1) são
limitantes para uma aplicação ambiental, porém adequados a estudos de toxicidade.
In this work, an analytical methodology to extract 1-nitronaphthalene, 2-nitrofluorene, 9-nitroanthracene, 3-nitrofluoranthene, and 1-nitropyrene aquatic samples is proposed. Capillary liquid chromatography with on-column UV detection (µLC-UV) was employed to separate and quantitate all five nitrated polycyclic aromatic hydrocarbons (nitro-PAH) extracted from water samples. Two different extraction techniques were tested and compared: liquid-liquid extraction (LLE) and solid phase extraction (SPE) with two different sorbents, octadecylsilica (C18) and styrene divinylbenzene (XAD-2) particles. The elution of analytes was tested with both acetonitrile and methylene chloride. The best recovery results were obtained for SPE-C18
extraction with the methylene chloride with values ranging from 76 to 97% with RSD values smaller than 4%. The chromatographic conditions for analysis was carried out using a 250 ×
0.3 µm i.d. packed capillary column with 5 µm C18 particles. The elution was isocratic with
65% acetonitrile in water (v/v) as mobile phase with a flow rate of 7 µL min-1. The detection
limits due to on-column UV detection (ranging ~3 – 30 µmol L-1) are limiting for environmental
applications, however, they are suited for toxicological studies.
Keywords: nitrated aromatic hydrocarbons, capillary liquid chromatography, carcinogenic
compounds, method development, SPE
Introduction
Nitrated polycyclic aromatic hydrocarbons (nitro-HPA) are compounds of broad environmental importance. They can be formed by thermal decomposition of organic compounds,1 in toners of photocopying machines, and
largely found in particulate matter in the environment.2,3
The transformation of pollutants in the environment also
deserves some attention and concern. Such species are capable of forming compounds even more harmful to the human health and ecosystem. Nitro-PAH compounds are formed in the environment mainly through the reaction of PAH with nitrogen oxides (NOx) in polluted air and also during combustion processes.4 Air particulates of PAH
are degraded under atmospheric conditions such as, strong sunlight, high temperatures and air humidity, and elevated concentrations of ozone and nitrogen oxides.5 Several
in order to determine its carcinogenic and mutagenic potential. Among these studies, the Ames Salmonella test has evidenced that nitro-PAH generally are more mutagenic than its correspondent PAH.6 Therefore, is
important to assess the presence and the effects of nitro-PAH in tropical countries since there is a high incidence of sunlight. Coincidently, such countries present a large number of wildfires and controlled fires for agricultural purposes (sources of PAH).7
The analytical measurement of nitro-PAH has been addressed by several chromatographic methods. High performance liquid chromatography (HPLC) with both UV and electrochemical detection,8 and the capillary gas
chromatography (CGC) with flame ionization,8,9 electron
capture,9 nitrogen and phosphorus,9,10 and mass
spectrometry11-14 detection were largely used for
determination of nitro-PAH in atmosphere or air-particulates.15 However, no analytical methods have been
established for detection of this compound class in water, neither capillary liquid chromatography (µLC) has been evaluated,16 thus encouraging us to conduct the present
work.
The development of an analytical methodology using µLC for determination of nitro-PAH in aquatic samples employing an analytical technique, which is not scientifically as consolidated as HPLC, is a complex task. It does not require only the achievement of the separation but also the development of the instrumentation. Micro-LC is just nowadays becoming a common practice in many laboratories. It can provide some important advantages regarding solvent consumption and disposal, minute sample volumes and straightforward interfacing with MS.17
Experimental
Chemicals
Acetonitrile (Mallinckrodt) and ultra-pure water (Milli-Q, Millipore) were used as mobile phase, which were degasified with helium (AGA) prior use. Methanol (Mallinckrodt) was used for washing and conditioning of the SPE cartridges while acetonitrile and methylene chloride (Mallinckrodt) were used for elution of the analytes. The C18 cartridges (Amprep™-Amershan) and XAD-2 resin (Amberlite-Aldrich) were used for solid phase extraction (SPE). All five nitro-PAH shown in Scheme 1: 1-nitronaphthalene (1), 2-nitrofluorene (2), 9-nitroanthracene (3), 3-nitrofluoranthene (4), and 1-nitropyrene (5), were analytical grade standards (Supelco) with purity greater than 99% and were used as purchased.
Chromatographic conditions
The chromatographic system consisted of a Phoenix-20 syringe pump (Fisons), a valve injector with internal loop of 60 nL (Valco), a variable wavelength UV-Vis-20 detector (Fisons) with a microdetection flow cell in “U” shape, with a total volume 35 nL and 8 mm optical pathlength, and the absorbance signal was acquired and processed with a Chrom-Card data acquisition computer board and software (Carlo Erba). The separation of the nitro-PAH was carried out in a GROM-SIL PAH C18 (25 cm × 300 µm i.d. × 5 mm d.p.) (Grom Analytik). The mobile phase used was 65% (v/v) acetonitrile in ultra pure water and the best separation was obtained using a flow rate of 7.0 µL min-1 with isocratic elution mode at room temperature. Each nitro-PAH was detected in a specific wavelength for maximum sensitivity: 1-nitronaphthalene (1) at 210 nm, 2-nitrofluorene (2) and 9-nitroanthracene (3) at 250 nm, and 3-nitrofluoranthene (4) and 1-nitropyrene (5) at 230 nm.
Standard solutions
Stock solutions of analytes were analytically prepared in acetonitrile to a final concentration of 500 mg L-1 and
were kept in a –20 °C freezer, free from light, throughout the course of this work. The working solutions were prepared weekly by sequential dilution from the stock with ultra pure water. The concentration range for each nitro-PAH varied accordingly to their sensitivity at each selected wavelength, nevertheless they were all between 2 and 80 mg L-1.
Sample preparation
For both liquid-liquid and solid-phase extraction schemes, 100 mL of ultra pure water were spiked with 75 µg of each nitro-PAH (0.75 mg L-1). This sample solution
Scheme 1. Structures of five nitro-PAH investigated. N+
O
-O
1-nitronaphthalene
N+ O
-O
2-nitrofluorene
N+O -O
9-nitroanthracene
N +
O -O
3-nitrofluoranthene
N+ O
-O
1-nitropyrene
1 2 3
composition was used during method development and for the recovery studies. After development of the analytical methodology real samples were analyzed. River water samples were collected from the Feijão creek (São Carlos, SP-Brazil) in large 5-L dark-glass bottles. Before sample collection, the bottles were exhaustively cleaned with detergents, rinsed 10 times with distilled water and then cleaned with chromic/sulfuric acid solution followed by another 10-fold rinse with distilled water. The flasks were finally rinsed 10 times with ultra-pure water. The pHs of the water samples were lowered to ~ 2 with HCl 2 mol L-1 to suppress microbiologic activity and were
filtrated in 0.45-µm pore filter prior to analysis.
Extraction procedures
Liquid-Liquid Extraction (LLE)
For LLE, 100 mL of water sample containing 0.75 mg L-1 per analyte was extracted with three consecutive
extractions with 30 mL aliquots of methylene chloride. All three extractions were combined and dried with anhydrous Na2SO4. The organic solvent was filtered and evaporated in to dryness in a rotary evaporator. The residue was resuspended in 4 mL of acetonitrile.
Solid-Phase Extraction (SPE)
Figure 1 shows the schematic steps for sample preparation in SPE either for XAD-2 or C18 method development. The SPE cartridges (500 mg) were conditioned with methanol (3 mL) and ultra pure water (5 mL). After the washing step, 100 mL of water sample
(spiked or river water) were eluted through the SPE cartridge at 0.5 mL min-1 flow rate using a vacuum system,
Supelco VISEPREP DL™. The elution of the nitro-PAHs was made with methylene chloride (10 mL). The eluate was evaporated to dryness in gentle nitrogen flow and reconstituted in 1 mL of acetonitrile to obtain the extract ready for µLC analysis.
Results and Discussion
Optimization of µLC separation
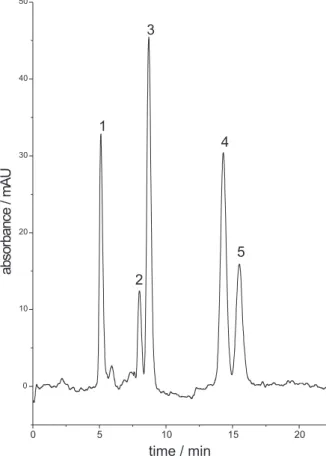
After several unsuccessful separations with a microbore packed column (1 mm i.d.) and a few homemade fused-silica capillaries packed columns (0.25 mm i.d.) (data not shown) it was established that the best separation was achieved with a GROM-SIL PAH C18 (25 cm × 0.30 mm i.d. × 5 µm) (Grom Analytik). A Fisons Phoenix 20 syringe pump was used to pump the mobile phase through the system. Since this pump is provided with just one piston, it does not allow either on-line solvent composition nor gradient elution, therefore the optimization of the separation of all 5 nitro-PAH had to conducted in isocratic mode with fine adjustment of the eluent composition. During the method development, several proportions of methanol, acetonitrile and water were evaluated and the condition which yielded baseline resolution in the minimum analysis time was 65:35 acetonitrile:water (v/v). The optimized separation is shown in Figure 2 in which the flow rate used was 7.0 µL min-1 at room temperature (ca. 25 °C). For detection of the nitro-PAH using the Fisons UV-Vis 20, which is a variable UV-Vis detector, each analyte was detected at its maximum absorption wavelength using a timetable programming feature. At preset times, the detector changed the wavelength for detection and reset de baseline so the chromatogram would not present steps or other artifacts on the baseline. Using programmable wavelength detection allowed improvement of the detection limits as much as 10-fold for 1-nitronaphtalene (1) and 3-fold for the others when compared to the detection at 254 nm (results not shown).
Extraction methods-recovery studies
Since there was not an established method for analysis of nitro-PAH in water samples, a LLE method was developed as control to better assess the development of the SPE protocols. Initially, several solvents were tested and methylene chloride was chosen for comparison because presented low boiling temperature and this feature
Figure 1. Stepwise procedure for SPE extraction of nitro-PAH from aquatic samples.
water sample (100 mL)
0.5 mL min-1
SPE cartridge (500 mg)
elution (10 mL)
(spiked or river)
(XAD-2 or C18)
(methylene chloride or acetonitrile) 0.5 mL min-1
evaporation of solvent
reconstitute
would minimize losses of more volatile nitro-PAH. During development of the SPE method, two different sorbents were tested in two different sizes, 100 mg and 500 mg of sorbent. Preliminary data indicated that cartridges containing 500 mg of solid phase were more suited for the amount of sample (100 mL) introduced in the cartridge. The following development was to test the elution of the analytes in two different solvents, methylene chloride and acetonitrile. The evaluation of all five protocols was based
on the recovery data of all analytes and the average relative standard deviation (RSD). The Table 1 contains the recovery data for all extraction modes experimented in this work. The data obtained from the experiments have shown that SPE with C18 cartridge (500 mg) and elution with methylene chloride resulted in the best recovery values, with an average recovery of 87.0% and an average RSD of 2.7%, which are better results than the typical values found for nitro-PAHs of 55-85% and 10% for recoveries and RSD, respectively.18 The LLE also
presented good RSD, however it was not efficient for 1-nitronaphthalene (1) because it is more volatile than the other nitro-PAH studied. Further development of the method and to obtain other figures of merit, such as limit of detection, linearity, and reproducibility, the extraction procedure was fixed in SPE with 500 mg of C18 and elution with methylene chloride.
Figures of merit
Our partial validation effort was focused on the definition of a few relevant figures of merit based in internationally accepted protocols with the special attention to validation of chromatographic methods following several details such as number of repetitions, number of concentration levels, and range of acceptable limits.19 For
calculation of the limit of detection (LOD), Equation 1 was used to correlate the minimum concentration detected in terms of signal-to-noise ratio.20 For determination of the
LOD, a blank solution (mobile phase) was injected in order to estimate the noise and also samples containing different nitro-PAH concentrations were injected. The LOD was calculated according to equation 1:
LOD = 2 CS hn/hS (1)
where hn is the height noise obtained from the blank run, hS is the height of a chromatographic signal, and CS is the amount/concentration of injected of analyte. Ideally, hS should be between 2 to 10 times hn.
Figure 2. Separation of five nitro-PAH by µLC-UV. Chromatographic conditions: GROM SIL PAH C18 column (25 cm × 0.30 mm i.d. × 5 µm),
isocratic elution with acetonitrile: water (65:35, v/v) at 7 mL min-1 and
detection at variable wavelength. Peak identification: 1) 10 mg L-1
1-nitronaphthalene (1) at 210 nm, 2) 40 mg L-1 2-nitrofluorene (2) at
250 nm, 3) 10 mg L-1 9-nitroanthracene (3) at 250 nm, 4) 30 mg L-1
3-nitrofluoranthene (4) at 230 nm, and 5) 30 mg L-1 1-nitropyrene (5)
at 230 nm.
0 5 10 15 20
0 10 20 30 40 50
5 4 3
2 1
ab
so
rb
an
ce
/
m
A
U
time / min
Table 1. Comparison of recovery of analytes from five different protocols for extraction of nitro-PAH from water samples and determination by µLC-UV
Recovery (RSD) / (%)
Compound LLE MC XAD-2 ACN XAD-2 MC C18 ACN C18 MC
1-nitronaphthalene (1) 048.7 (10.4) 24.6 (13.2) 030.6 (14.6) 81.8 (1.9) 76.5 (2.0)
2-nitrofluorene (2) 83.5 (3.3) 59.2 (12.0) 071.4 (14.4) 48.4 (2.0) 87.1 (2.0)
9-nitroanthracene (3) 84.8 (3.2) 45.7 (11.0) 069.3 (14.7) 25.5 (1.5) 94.2 (3.8)
3-nitrofluoranthene (4) 75.8 (1.5) 40.9 (12.8) 81.8 (1.8) 36.1 (1.6) 97.2 (2.0)
1-nitropyrene (5) 78.8 (1.1) 21.8 (13.2) 59.5 (9.9) 28.6 (1.2) 80.1 (3.8)
Average 74.3 (3.9) 38.4 (12.4) 062.5 (11.1) 44.1 (8.2) 87.0 (2.7)
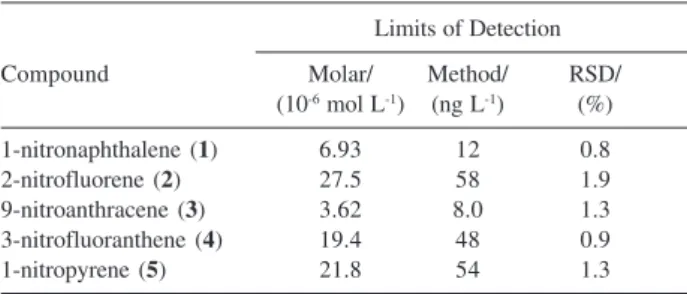
Results of molar concentration LOD for all nitro-PAH are shown in Table 2. Molar concentration values are related only to the instrument sensitivity, regardless the sample preparation method. The method values take into account the enrichment factor and represent the mass concentration levels that would be found in the environment. The values of LOD found for the µ LC-UV system were between 0.8 and 5.8 mg L-1, depending
on the response factor of each analyte. In terms of molar concentration, this range corresponds to 3.62 × 10⁻⁶ mol L-1 for 9-nitroanthracene (3) and 27.5 × 10⁻⁶ mol L-1 for
2-nitrofluorene (2), respectively the smallest and the largest LOD. Since in this methodology the sample is concentrated 100 times (the analytes in 100 mL of water were eluted in 10 mL of eluent, which were evaporated to a final volume of 1 mL), the LOD for the complete method turns to be between 8.0 ng L-1 and 58 ng L-1,
corresponding to the mass concentration of the nitro-PAH in the water sample in the environment. According to few reported values of nitro-PAH in the environment,2
their expected levels in water samples fall between 2.5 and 500 pg L-1, and sometimes, as high as 1 ng L-1 for
1-nitropyrene (5).21 Typically at this level of
conta-mination, the required analytical methods are extensively more complex and require water sample volumes around two thousand liters.21 Therefore, this
analytical approach, simple as is, presents detection limits that may not be suitable for the range of supposed values, however, are better than those found in electrochemical methods.22 However, most of the
studies measuring the damaging effects of nitro-PAH compounds in the marine life are conducted in a concentration range about 1 µg L-1,23 thus making this method suitable for toxicological and mutagenic studies. It is important to stress out that even though the molar LOD are not suitable for environmental trace analysis, our values are about 150 times lower, for example for 9-nitroanthracene (3), when compared to another on-column capillary UV absorption method as presented by Jia et al.,24 even using an extended path
detection window (bubble cell) for improved sensitivity. In their work the authors have shown a separation of 5 nitro-PAH by micellar electrokinetic chromatography in similar analysis time and using only standards diluted in running buffer.
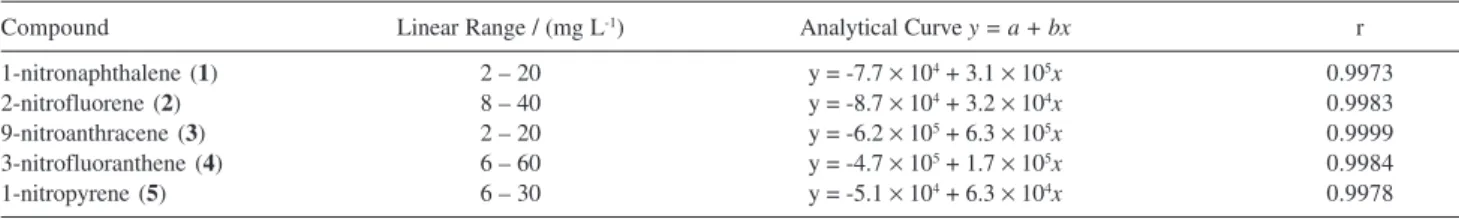
For quantitative analysis and determination of the linearity, analytical (calibration) curves for each nitro-PAH were constructed. Each data set was fitted to a straight line and all linear correlation coefficients were found to be greater than 0.997. The linearity range shown in Table 3, correspond to linear equations and linear correlation coefficients of any given concentration interval that was investigated. Concentrations greater than those reported in the interval were not tested; therefore the upper limit does not represent the end of the linear dependence.
As mentioned earlier, another important figure of merit in any analytical methodology is the inter- and intra-day variability. Repetitive determinations of known samples were carried out in the same day and also at different dates to estimate the overall precision of the method. The RSD values for 12 determinations were between 4.4 and 5.0% for both retention time and peak area. The accuracy of the method was not determined since there was neither an official validated method nor a certified sample to be analyzed in the proposed methodology.
Analysis of water samples
After development of analytical methodology for determination of nitro-PAH employing the µLC with UV detection, analysis of real samples were carried out. This water samples were collected in the Feijão creek (São Carlos-Brazil). The water was filtrated and passed through C18 cartridge of according to the protocol from Figure 1. Figure 3(top) shows the chromatogram from one typical sample, in which was not detected the presence of any of five nitro-PAH studied. For this matter, São Carlos is found amidst large sugar cane plantations, which are harvested in the same fashion it was harvested centuries ago. The whole plantation is set on fire so the dry leaves are burnt and facilitates the hand-made harvesting. This combustion process of is known to produce measurable quantities of PAH in the atmosphere and in the soot particles.25 For
this reason, we have investigated the presence of nitro-PAH in nearby water sources. According to the results from several samples, the analytes were not detected. For corroboration only, Figure 3(bottom) shows the chromatogram from the analysis of the same sample with spiking of each nitro-PAH to a final concentration of 0.75 mg L-1.
Table 2. Limits of detection for the SPE-C18 method with µLC-UV sepa-ration and detection
Limits of Detection
Compound Molar/ Method/ RSD/
(10-6 mol L-1) (ng L-1) (%)
1-nitronaphthalene (1) 6.93 12 0.8
2-nitrofluorene (2) 27.5 58 1.9
9-nitroanthracene (3) 3.62 8.0 1.3 3-nitrofluoranthene (4) 19.4 48 0.9
Table 3. Data for the linearity interval, linear equation for analytical curve (area versus concentration), and linear correlation coefficient (r) in µLC-UV
Compound Linear Range / (mg L-1) Analytical Curve y = a + bx r
1-nitronaphthalene (1) 2 – 20 y = -7.7 × 10⁴ + 3.1 × 105x 0.9973
2-nitrofluorene (2) 8 – 40 y = -8.7 × 10⁴ + 3.2 × 104x 0.9983
9-nitroanthracene (3) 2 – 20 y = -6.2 × 10⁵ + 6.3 × 105x 0.9999
3-nitrofluoranthene (4) 6 – 60 y = -4.7 × 10⁵ + 1.7 × 105x 0.9984
1-nitropyrene (5) 6 – 30 y = -5.1 × 10⁴ + 6.3 × 104x 0.9978
Figure 3. Chromatograms from river water samples processed with SPE method. Top: water sample from the Feijão creek, São Carlos, SP; Bot-tom: real sample fortified with 0.75 mg L-1 of each nitro-PAH.
Chro-matographic conditions were the same as in Figure 1.
0 5 10 15 20 25 30
0 10 20 30 40 50 60
abs
orbanc
e
/
m
A
U
time / min
0 10 20
0 10 20 30 40 50 60
5 4 3
2 1
abs
orbanc
e
/
m
A
U
time / min
5 15
Conclusions
The methodology for determination of nitro-PAH in water employing µLC has shown an efficient chromato-graphic separation with good resolution. Another interesting aspect to observe was the sample preparation step, which allowed a concentration factor around 100-fold thus increasing the response sensitivity. One of the
advantages of µLC is that very low sample volumes and mobile phase volumes are required when compared mainly to conventional liquid chromatography (HPLC). For example, this method, for a single separation only 140 µL of mobile phase was consumed, otherwise, in HPLC it would be an average of 30 mL. Therefore, this analytical technique is fast and present good mass sensitivity for nitro-PAH. The method is presented as an analytical tool for studies assessing toxicological and mutagenic effects of nitro-PAH. Even further, the use of more sensitive detectors can improve detectability, therefore, allowing also this methodology to be directly applied to environmental applications.
Acknowledgments
The authors would like to acknowledge the financial support from Fundação de Amparo à Pesquisa do Estado de São Paulo-FAPESP, Conselho Nacional de Desenvolvimento Científico e Tecnológico-CNPq for a fellowship (E.C.) and Coordenação de Aperfeiçoamento de Pessoal de Nível Superior-CAPES for a scholarship (M.T.).
References
1. Kamiura, T.; Kawaraya, T.; Tanaka, M.; Nakadoi, T.; Anal.
Chim. Acta1991, 254, 27.
2. Pereira, A. D. N.; Moreira, J. C.; Dias, A. E. X. O.; Arbilla, G.; Ferreira, L. F. V.; Oliveira, A. S.; Barek, J.; Quim. Nova 2000, 23, 765.
3. White, C. M.; Nitrated Polycyclic Aromatic Hydrocarbons, Hutig: New York, 1985; Cooke, M.; Dennis, A. J.; Polynuclear Aromatics Hydrocarbons: Chemistry, Characterization and
Carcinogenesis, Battelle: Columbus, 1986.
4. Moreira, J. C.; Barek, J.; Quim. Nova 1995, 18, 362. 5. Mcdow, S. R.; Sun, Q.; Vartiainen, M.; Hong, Y.; Yao, Y.; Fister,
T.; Yao, R.; Kamens, R. M.; Environ. Sci. Technol.1994, 28, 2147.
6. Lopes, W. A.; De Andrade, J. B.; Quim. Nova1996, 19, 497. 7. Zamperlini, G. C. M.; Silva, M. R. S.; Vilegas, W.;
8. Jin, Z.; Rappaport, S. M.; Anal. Chem.1983, 55, 1778. 9. Campbell, R. M.; Lee, M. L.; Anal. Chem.1984, 56, 1026. 10. Paputa-Peck, M. C.; Marano, R. S.; Schuetzle, D.; Riley, T. L.;
Hampton, T. J. P.; Skewes, L. M.; Jensen, T. E.; Ruehle, P. H.; Bosch, L. C.; Duncan, W. P.; Anal. Chem.1983, 55, 1946. 11. Robbat Junior, A.; Corso, N. P.; Doherty, P. J.; Anal. Chem.
1986, 58, 2078.
12. Newton, D. L.; Erickson, M. D.; Tomer, K. B.; Pellizzari, E. D.; Gentry, P.; Environ. Sci. Technol. 1982, 16, 206. 13. Schuetzle, D.; Riley, T. L.; Prater, T. J.; Harvey, T. M.; Hunt,
D. F.; Anal. Chem.1982, 54, 265.
14. Henderson, T. R.; Sun, J. D.; Royer, R. E.; Clark, C. R.; Li, A. P.; Harvey, T. M.; Hunt, D. H.; Fulford, J. E.; Lovette, A. M.; Davidson, W. R.; Environ. Sci. Technol.1983, 17, 443. 15. Schauer, C.; Niessner, R.; Pöschl, U.; Anal. Bioanal. Chem.
2004, 378, 725.
16. Cvaöcka, J.; Barek, J.; Fogg, A. G.; Moreira, J. C.; Zima, J.;
Analyst1998, 123, 9R.
17. Huang, E. C.; Henion, J. D.; Anal. Chem. 1991, 63, 732. 18. Dusek, B.; Hajslova, J.; Kocourek, W.; J. Chromatogr., A 2002,
982, 127.
19. Chasin, A. M.; Chasin M.; Salvadori M. C.; Rev. Farm. Bioquim.
Univ. S. Paulo1994, 30, 49; Ribani, M.; Bottoli, C. B. G.;
Collins, C. H.; Jardim, I. C. S. F.; Melo, L. F. C.; Quim. Nova 2004,27, 771; EURACHEM, The Fitness for Purpose of Analytical Methods: A Laboratory Guide to Method Validation
and Related Topics, 1st ed., Teddington, UK, 1998. ISBN
0-948926-12-0.
20. Francotte, E.; Davatz, A.; Richert, R.; J. Chromatogr., B.1996,
686, 77.
21. Ohe, T.; Nukaya, H.; Sci. Total Environ. 1996, 181, 7. 22. Barek, J.; Mejstrík, V.; Muck, A.; Zima, J.; Crit. Rev. Anal.
Chem. 2000, 30, 37.
23. Bleeker, E. A. J.; van der Geest, H. G.; Kraak, M. H. S.; de Voogt, P.; Admiraal, W.; Aquat. Toxicol. 1998, 41, 51. 24. Jia, L.; Yan, J.; Gao, J.; Chen, X.; Hu, G.; Wang, W.; Xu, M.;
Wang, X.; Microchem. J. 1998, 59, 364.
25. Godoi, A. F. L.; Ravindra, K.; Godoi, R. H. M.; Andrade, S. J.; Santiago-Silva, M.; Van Vaeck, L.; Van Grieken, R.; J.
Chromatogr., A2004, 1027, 49.
Received: February 27, 2007
Web Release Date: August 10, 2007