INTRODUCTION
The genus Prosopis occurs worldwide in arid and semiarid regions and includes about 44 species grouped in 5 sections and 8 series (Burkart, 1976). Many species of this genus, particularly those belonging to the Algarobia Section, have economic and ecological potential, often be-ing major components of native North and South America ecosystems wherein they offer shade, firewood, food, and forage for wildlife and livestock (Leakey and Last, 1980; Habit et al., 1981; Joshi and Nimbkar, 1991). Some spe-cies, like P. juliflora and P. flexuosa, are being used for reforestation of severely degraded ecosystems (Felker, 1984; Cony, 1995). By contrast, some other species colo-nize and invade areas altered by human activity, particularly P. glandulosa (honey mesquite) in Texas, Mexico, and New Mexico, P. velutina (velvet mesquite) in Arizona, and P. ruscifolia (vinal) in the Chaco Region, Argentina (Morello et al., 1971; Burkart, 1976; Simpson and Solbrig, 1977; Hennessy et al., 1983; Brown and Archer, 1987; Archer et al., 1988; Scanlan and Archer, 1991). In North America, mesquite encroachment damages grasslands, especially when combinated with other factors such as overgrazing, drought, climate shifts and fire (Fisher, 1977; Schlesinger et al., 1990). It also decreases rangeland productivity through competition and by increasing soil erosion.
Exploiting the ecological potential of this species requires selection for and combination through interspe-cific crosses of advantageous characteristics exhibited by
different species. This, in turn, demands genetic markers possibly associated with desirable characters. Biochemi-cal and molecular markers have been used to enhance un-derstanding of plant population genetic structure (Soltis et al., 1992). Among several efficient methods for revealing genetic variability within and among plant populations, some of the most widely applied are isozyme electrophoresis (Hamrick and Allard, 1972; Hamrick and Godt, 1990), ran-dom amplified DNA polymorphism - RAPDs - (Wolff and Peters-van Rijn, 1993; Wachira et al., 1995; Brummer et al., 1995; Swoboda and Bhalla, 1997; Palacios and Gonzalez-Candelas, 1997), and restriction fragment length polymorphisms - RFLPs - (Keim et al., 1989; Hong et al., 1993; Yanesita et al., 1997). In the genus Prosopis, previ-ous isoenzymatic studies in some Algarobia Section spe-cies have shown low differentiation among spespe-cies and popu-lations coupled with high variability within popupopu-lations (Saidman, 1985, 1986, 1990, 1993; Saidman and Vilardi, 1987; Verga, 1995). Among the species of this section so far studied only P. caldenia (Saidman, 1990) and P. velutina (Bessega 1997) are recognizable by patterns of few loci. New molecular techniques seem necessary for obtaining genetic markers useful in species and population recog-nition.
Here, for studying genetic variation distribution within and among populations of two native North American spe-cies of the Section Algarobia, P. glandulosa and P. velutina, we compare isozyme and RAPD technique adequacy as tools for providing genetic markers useful in 1)
quantify-Isozyme and RAPD studies in
Prosopis glandulosa
and
P. velutina
(Leguminosae, Mimosoideae)
Cecilia Bessega, Beatriz O. Saidman and Juan C. Vilardi
Abstract
Allozyme and random amplified polymorphic DNA (RAPD) techniques have been compared for their usefulness for genetic and taxo-nomic studies in Prosopis glandulosa and P. velutina populations. Isozymes and RAPDs yielded similarly high estimates of genetic variability. Genetic structure and differentiation were analyzed through non-hierarchical Wright’s FDT. For all populations considered, both markers produced low gene flow (Nm < 1) estimates. When only P. glandulosa populations were analyzed, isozyme data yielded higher gene flow estimates (Nm > 1), in agreement with that expected for conspecific populations. However, in RAPD data the expected reduction in FDT and the increase in Nm were not observed. Correlation between FDT and geographical distance matrices (Mantel test) for all populations was significant (P = 0.02) when based on isozymes, but not so (P = 0.33) when based on RAPDs. No significant associations among genetic and geographical or climatic variables were observed. Two isoenzyme systems (GOT and PRX) enabled us to distinguish between P. glandulosa and P. velutina, but no diagnostic band for recognition of populations or species studied here were detected by RAPD. However, RAPD markers showed higher values for genetic differentiation among conspecific populations of P. glandulosa and a lower coefficient of variation than those obtained from isozymes.
ing genetic variability within a population; 2) measuring differentiation among populations and 3) analyzing the re-lationships among these markers and climatic and geo-graphic variables.
MATERIAL AND METHODS
Species and populations
To estimate differentiation among P. glandulosa populations, four populations were sampled: Weslaco (WE), La Copita (LC), Frio Co. (FC), and Bell Co. (BC) (Figure 1, Table IA). We estimated the differences between P. glandu-losa and P. velutina by comparing the former populations with the Santa Rita (SR) population of the latter species. Materials studied, kindly donated by Dr. G.J. DeLoack (Grassland Research Station USDA), were collected in July-September 1994.
Mesquite forests form a continuum of shrubs or trees with contiguous canopies. Five maternal parent trees were sampled in each population. Presence of an adequate seed crop was the first selection criterion; they also had to be separated from each other by at least 50 m. With these re-strictions, the “pollen cloud” proceeding from the neigh-boring canopies over each mother plant was assumed to be of different origin, based on empirical observations (see Saidman and Vilardi, 1993) indicating that these isolated
Argentinean Algarobia tree species present highly reduced seed crops.
Number of pods collected ranged from 50 to 400 per tree. Seeds obtained from all pods of each tree were lumped together and from this pool seeds were randomly chosen for isoenzyme or RAPD analyses. Allelic frequency esti-mations were based on equal numbers of seeds from each mother tree.
Despite relatively low number of mother plants col-lected per population, most alleles are expected to be rep-resented in the sampled tree seeds taking into account the following considerations: species belonging to Section Algarobia are protogynous (Burkart, 1976) and have been considered obligate outcrossers (Simpson, 1977); recent estimates of outcrossing rates ranging from 0.6 to 1 in P. velutina (Keys and Smith, 1994) seem to confirm a cross pollination tendency in natural populations, explaining the many genotypes sampled within seeds collected from single mother trees.
Electrophoretic technique
Nine isoenzymatic systems (esterases, peroxidases, super oxide dismutase, glutamate oxalacetate transaminase, aminopeptidases, alcohol dehydrogenase, isocitric dehydro-genase, shikimic dehydrogenase and 6-phosphogluconic acid dehydrogenase) were studied. Homogenates were
tained from cotyledons of 7-day-old seedlings for all sys-tems but ADH where whole seeds soaked for 24 h were used. Electrophoresis was performed on 5 or 7% acrylamide horizontal gels. Buffers and electrophoretic conditions are described elsewhere (Saidman, 1985, 1986, 1990; Saidman and Vilardi,1987; Verga, 1995; Bessega, 1997).
Homology relationships among bands, genes, and al-leles were determined by their correspondence to other species of Algarobia previously studied (Saidman, 1985, 1986, 1988, 1990, 1993; Saidman and Vilardi, 1987; Bessega, 1997). The mean number of individuals (seedlings) studied per locus is shown in Table I (slight differences in number of individuals studied in different loci are due to missing data).
RAPD technique
Total genomic DNA was extracted from cotyledons of 7-day-old seedlings using a modification of the proto-col described by Dellaporta et al. (1983). PCR reactions involving arbitrary primers (Promega) contained approxi-mately 50 ng of genomic DNA, 100 µM each dNTP, 60 ng primer, 1X Taq polymerase buffer (10 mM Tris-HCl, pH 9, at 25ºC, 50 mM KCl, 0.1% Triton X-100), 2 mM Cl2Mg and 2.5 units of Taq Polymerase (Promega) in a final vol-ume of 50 µl. The thermal cycler (Techne Progene) was programmed for one cycle of 94ºC for 1 min, 40 cycles
of 92ºC for 1 min, 36ºC for 2 min, 72ºC for 2 min, fol-lowed by a final extension step of 72ºC for 6 min. Prod-ucts were resolved on 1.4% agarose gels. Re-amplifica-tions were performed routinely to ensure reproducibility of banding patterns and usual cautions observed to pre-vent contaminations of PCR experiments with previously amplified fragments. The necessary negative and positive controls were done to test PCR products reliability.
Ten arbitrary primers were screened for suitability on a small number of representative individuals. They varied in ability to detect polymorphisms and in reproducibility. Four primers which revealed informative patterns were chosen for analysis of all populations. Their sequences were: BO1: 5’ - TCGAAGTCCT - 3’; BO7: 5’ - AGATGCAGCC - 3’; BO8: 5’ - TCACCACGGT - 3’; B10: 5’ - CAGGCACTAG - 3’.
RAPD bands were scored as present (1) or absent (0). In order to assure reliability of data matrix, photo in-terpretations were made by two different members of our group. The mean numbers of individuals studied per primer in each population are indicated in Table II (slight differ-ences in number of individuals studied in different loci are due to missing data).
Data analysis
Isoenzymatic genotypic data were converted into al-lelic frequencies (Table II) following the genetic interpre-tation previously published (Saidman, 1985, 1990; Saidman and Vilardi, 1987; Verga, 1995; Bessega, 1997).
The RAPD data matrix of band presence-absence was transformed into a frequency table (Table III) using the me-thod of Lynch and Milligan (1994) through the RAPDBIOS program of the RAPD package by Black IV (1996). Linkage between RAPD loci was estimated using the program RAPDLD from the RAPD package. RAPDLD uses Ohta’s (1982) method of partitioning the variance in disequilibrium in the total sample into within and among population compo-nents. The within population component is a measure of the proportion of total variance in disequilibrium due to epista-sis; the among population component is a measure of the pro-portion of the total variance due to Wahlund’s effect or ge-netic drift among populations. The sum of these components measures variance in disequilibrium in the total sample.
Table I-A -Geographic localization of sampling sites and closest meteorological experimental stations
where climatic variables were obtained from.
Species Population Latitude Longitude Experimental Latitude Longitude Distance from
station sample site
P. glandulosa Bell Co. 31°05’ N 97°21’ W Waco 31°18’ N 97°06’ W 32 km
Frio Co. 29°02’ N 99°01’ W San Antonio 29°12’ N 99°18’ W 71 km Weslaco 26°09’ N 98°00’ W Mc. Allen 26°12’ N 98°14’ W 26 km La Copita 27°45’ N 98°04’ W Corphus Christie 27°30’ N 97°25’ W 71 km
P. velutina Santa Rita 32°05’ N 110°57’ W Tucson 32°14’ N 110°57’ W 35 km
Table I-B - Geographic distances among the populations sampled (in km).
P. vel P. gla P. gla P. gla
SR FC LC BC
P. gla 1200
FC
P. gla 1312 173
LC
P. gla 1280 288 381
BC
P. gla 1415 338 174 541
WE
Allelic frequencies from both isoenzyme and RAPD markers were used separately to estimate Wright’s (1978) non-hierarchical FDT, Nei’s (1978) genetic identities, mean heterozygosity (Nei, 1978), percentage of polymorphic loci and mean number of alleles per locus using the computa-tional program Biosys-1 (version 1.7) (Swofford and Selander, 1981).
Nei’s (1987) genetic distance matrices (GDM) were estimated from allelic frequencies of both isozyme and RAPD data. From GDM, a phenogram was obtained by the unweighted pair group method using arithmetical means. Multidimensional scaling plots (MDS) were also obtained from GDM.
Phenogram reliability was tested by bootstrapping the allelic frequency data set. For each genetic marker (isozymes and RAPDs), 100 bootstrapped pseudoreplicates were obtained using the Seqboot program of the PHYLIP package (Felsenstein, 1993). These pseudoreplicates were used to obtain 100 UPGMA trees (based on Nei’s genetic distances) and the corresponding consensus tree for each kind of marker using the programs Gendist, Neighbor and Consense of the same package.
The 100 bootstrapped GDMs were also used to esti-mate genetic distance error through the coefficient of varia-tion (CV) by dividing the standard deviavaria-tion of genetic dis-tance by the corresponding bootstrap sample mean.
Table II - Allelic frequencies of polymorphic loci in studied populations of Prosopis glandulosa (P.
gla) and P. velutina (P. vel). M and D denote monomeric and dimeric enzymes, respectively. D* indicates dimeric enzymes exhibiting allelic and nonallelic interactions. N indicates sample sizes. For
Got-3, Got-4, Prx-4 and Prx-5 the lack of variation within populations did not allow a hypothesis
on the number of polypeptide subunits in the active enzyme.
Locus P. gla P. gla P. gla P. gla P. vel
Allele Weslaco La Copita Bell Co. Frio Co. Santa Rita
N 45 35 37 35 31
Adh-1 130 0.936 0.950 0.950 1.000 0.738
D* 128 0.064 0.050 0.050 0.000 0.262
124 0.000 0.000 0.000 0.000 0.000
Amp-2 288 0.417 0.405 0.250 0.381 0.794
M 276 0.467 0.392 0.455 0.548 0.206
270 0.116 0.203 0.295 0.071 0.000
Est-1 193 0.094 0.067 0.289 0.379 0.100
M 192 0.469 0.433 0.500 0.190 0.767
191 0.437 0.500 0.211 0.431 0.133
Est-2 287 0.750 0.757 1.000 0.673 0.351
M 0 0.250 0.243 0.000 0.327 0.649
Est-3 385 0.388 0.160 0.423 0.433 0.239
M 0 0.612 0.840 0.577 0.567 0.761
Est-4 481 0.177 0.030 0.024 0.134 0.487
M 0 0.823 0.970 0.976 0.866 0.513
Got-1 172 0.108 0.098 0.250 0.205 0.116
D 169 0.387 0.455 0.544 0.346 0.081
171 0.000 0.000 0.000 0.000 0.802
170 0.505 0.446 0.206 0.449 0.000
Got-2 248 0.627 0.821 0.929 0.903 0.000
D 240 0.373 0.179 0.071 0.097 0.000
254 0.000 0.000 0.000 0.000 1.000
Got-3 349 0.000 0.000 0.000 0.000 1.000
Got-4 444 0.000 0.000 0.000 0.000 1.000
Idh-1 1100 0.054 0.071 0.384 0.211 0.167
D* 170 0.920 0.714 0.593 0.611 0.833
163 0.027 0.214 0.023 0.178 0.000
6Pgd-2 223 0,000 0,028 0,022 0,000 0,000
0 1.000 0.972 0.978 1.000 1.000
Prx-1 136 0.190 0.520 0.065 0.068 0.000
M 0 0.810 0.480 0.935 0.932 0.000
Prx-2 229 1.000 0.667 0.842 0.719 0.000
M 0 0.000 0.333 0.158 0.281 0.000
Prx-3 321 0.561 0.194 0.275 0.111 0.000
M 0 0.439 0.806 0.725 0.889 0.000
Prx-4 439 0.000 0.000 0.000 0.000 1.000
Prx-5 532 0.000 0.000 0.000 0.000 1.000
Skd-1 124 0.093 0.190 0.250 0.158 0.531
M 122 0.651 0.429 0.659 0.711 0.469
Gene flow was estimated following the expression:
FDT indices were used to study isolation by distance using the subprogram ISOLDE of the program GENEPOP (Raymond and Rousset, 1995). This program compares geographic distance matrix structure with that of FDT or D indices by Mantel test. Distances between sample sites were estimated using the Microsoft Encarta World Atlas measuring tool (Spanish version) (1995-1996) (Table IB). The consistency between the relationships among populations obtained from isoenzyme and RAPD data was analyzed by comparing the corresponding matrices of ge-netic identities and FDT by Mantel’s test.
Spearman’s rank correlations between allelic fre-quencies and each of 16 climatic and geographic variables were estimated using the program STATISTICA (StatSoft, Inc., 1995). Geographical and climatic variables used cor-respond to all data recorded by the closest station (Table IA) to each population, available at NOAA-CIRES Climate Diagnostics Center (http://www.cdc.noaa.gov/cas/Climo): latitude, longitude, elevation, maximum and minimum tem-peratures, mean annual rain and snowfall, annual average chance of precipitation, mean wind speed, annual average percentage of available sun, maximum and minimum July temperatures, maximum and minimum January tempera-tures, July and January rainfall.
RESULTS
Isozyme distribution
Analysis of nine isoenzymatic systems revealed 27 loci. Previous results (Bessega, 1997) indicated that nine of these loci (Amp-1, Adh-2, Idh-2, 6Pgd-1, Sod-1-Sod-5) are invariable for the five analyzed populations. By con-trast, Got-3, Got-4, Prx-4, and Prx-5 are the only diag-nostic loci which allow differentiating the Santa Rita po-pulation of P. velutina from the species of Algarobia so far studied (see Bessega, 1997). For the remaining loci, populations and species differ only in allelic frequencies (Table II).
RAPD product distribution
The four arbitrary primers chosen for the present analysis revealed 46 bands that were consistently and un-ambiguously scorable in the five populations studied. These bands were treated as genetic loci. Of the 46 RAPD loci, 45 were polymorphic. No diagnostic bands for popu-lation or species recognition were detected (Table III).
After applying Ohta’s (1982) method to estimate link-age between RAPD markers, only 7 out of 990 pairs of bands (0.71%) suggested epistasis disequilibrium.
Table III - Band sizes (bp) and allelic frequencies of the 46 RAPDs loci for
the Prosopisglandulosa and P. velutina populations. (Only presence frequencies are shown). N: Sample size.
Locus Size P. gla P. gla P. gla P. gla P. vel
(bp) LC FC BC WE SR
N 24 7 13 12 15
01-01 2094 0.074 0 0 0.083 0
01-02 915 0.167 0.375 0.077 0 0
01-03 893 0.556 1 0.692 0.292 0.714
01-04 809 0.074 0 0.038 0 0.179
01-05 694 0.056 0 0.154 0.25 0.464
01-06 626 1 1 1 1 1
01-07 528 0.019 1 0.115 0.083 0
01-08 508 0.019 0.25 0.385 0 0
01-09 489 0.037 1 0.038 0 0
01-10 455 0.426 1 1 1 0.071
01-11 440 0.556 0 0 0.25 0.286
01-12 420 1 0.25 1 1 0.536
07-01 2238 0.024 0 0.038 0 0
07-02 1580 0.048 0.2 0.192 0.167 0.7 07-03 1260 0.762 0.5 0.577 1 0.167
07-04 1000 0 0.1 0.077 0 0
07-05 950 1 1 0.5 1 0
07-06 803 0.548 0.2 1 0.583 0
07-07 708 1 0.2 1 1 0.7
07-08 630 1 1 1 1 0.367
07-09 562 0 0 0 0 0.033
07-10 500 1 0.5 1 1 0.7
07-11 447 0.262 0.3 0.692 0.667 0.033
07-12 355 0.405 1 0.692 0.667 0
07-13 316 0.136 0.3 0 0 0
08-01 1000 0 0.063 0.042 0.042 0.1 08-02 891 0.269 0.25 0.083 0.125 0 08-03 708 0.115 1 0.417 0.417 0.067
08-04 562 0.135 0.5 0.5 0.25 0.3
08-05 501 0.308 0.375 0.042 0.167 0.067
08-06 398 0.769 1 0.667 1 0.7
08-07 316 1 1 0.667 1 1
10-01 3162 0.352 0.063 0.115 0.042 0.464 10-02 2239 0.352 0.063 0.115 0.042 0.464
10-03 1540 0.704 0.5 1 1 1
10-04 1259 0.426 0.5 0.269 0.5 0.036
10-05 1122 0.019 0 0.077 1 0.036
10-06 1000 0.481 1 0.385 0 0.036
10-07 977 0.444 0.375 0 0 0.143
10-08 932 0.778 1 1 1 1
10-09 724 1 1 1 1 0.179
10-10 660 1 1 1 1 0.321
10-11 549 0.704 1 1 0.667 0.536
10-12 331 0.185 0.125 0.385 0.417 0.036
10-13 301 1 1 0.692 0.667 0.607
10-14 275 0.019 0 0 0 0
For abbreviations see legend to Table I.
1 - F
ST
4FST
Genetic diversity
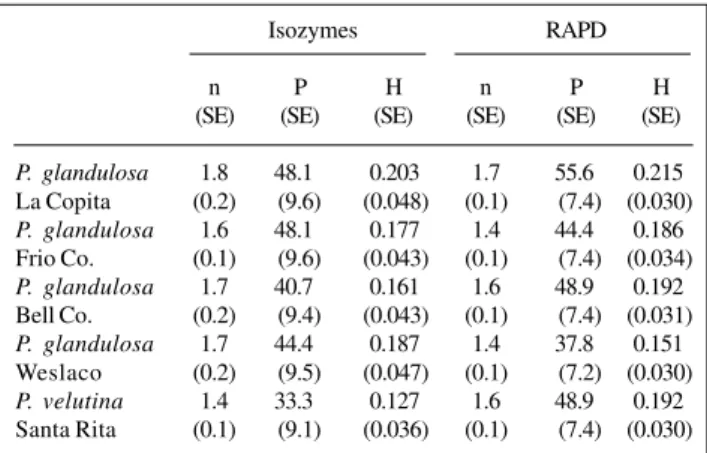
Both isozymes and RAPDs yielded similar genetic variability estimates (Table IV). The H and P values obtained in the present study are also similar to those obtained from previous isozyme studies (Saidman, 1985, 1986, 1990; Saidman et al., 1997, 1998b, Saidman and Vilardi,1987; Verga, 1995; Bessega, 1997) in other species of Section Algarobia. Indeed, the differences among estimates are not statistically significant since confidence intervals overlap.
Genetic structure and differentiation
Genetic differentiations estimated through non-hi-erarchical Wright’s (1978) FDT from isozyme and RAPD data (0.388 and 0.290, respectively) were similar when all populations were included in the analysis. The correla-tion between FDT matrices (r = 0.566) was significant ac-cording to Mantel’s test (P = 0.02). Consequently, in both cases gene flow estimate (Nm = 0.39 and 0.60 for isoen-zyme and RAPD loci, respectively) was less than one in-dividual per generation.
However, results of isoenzyme and RAPD analysis are very different when P. velutina is excluded (r = 0.08;
P = 0.69). In this case, FDT and Nm estimates from isozyme data (0.071 and 3.27, respectively) agree with the expected for conspecific populations (Nm > 1). For RAPD data, ex-clusion of P. velutina does not yield the expected reduc-tion in FDT (0.283) and increase in Nm (0.63).
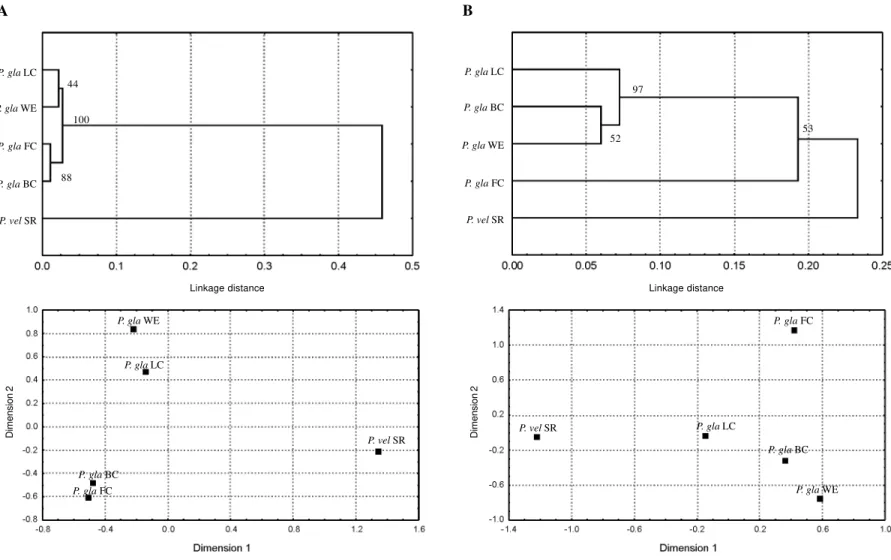
The CV of Nei’s (1978) genetic distance (GD) esti-mates was higher for isozyme (0.33 ± 0.01) than for RAPD (0.27 ± 0.01) data, suggesting higher accuracy of RAPD markers. However, this result should be interpreted with caution considering the GD range observed for each data set. GD estimates for isozyme loci vary from 0.01 to 0.49 when all populations are considered, but the range dropped dramatically (0.01-0.03) if P. velutina was excluded. Con-versely, GD range for RAPDs was narrower for all popu-lations (0.06-0.35) but not so strikingly reduced when only P. glandulosa populations were considered (0.06-0.23) (Table V). As a consequence, cluster analyses from isoen-zyme and RAPD loci did not completely agree. The GD matrices’ correlation is borderline significant whether or not the P. velutina data are considered (P = 0.06 and P = 0.08, respectively). In the phenograms and MDS plots ob-tained from both data sets (Figure 2), P. glandulosa popu-lations clustered together, but in the plots based on isozyme data they appeared to be more homogeneous and further separated from P. velutina. This fact was demon-strated through the analysis based on bootstrapping allele frequencies of both marker types. The trees obtained from isozyme data showed high consistency: the populations of P. glandulosa clustered together and separated from P. velutina in 100% of the cases. On the contrary, only 53% of the trees obtained from RAPD data separated P. glandulosa populations from that of P. velutina. The main cause for this inconsistency is due to the fact that Frio Co. and Santa Rita are almost equally differentiated from the remaining P. glandulosa populations for RAPD data, as can be clearly seen in the MDS plot for RAPD data.
Isolation by distance
Relation between FDT and geographical distances was tested through Mantel’s (1967) test. The correlation be-tween FDT and geographical distance matrices including all populations was significant (P = 0.02) when genetic data
Table IV - Measures of genetic variability estimated from isozyme and
RAPD loci. P: Percentage of polymorphic loci; H: mean heterozygosity; n: mean number of alleles per locus; SE: standard errors.
Isozymes RAPD
n P H n P H
(SE) (SE) (SE) (SE) (SE) (SE)
P. glandulosa 1.8 48.1 0.203 1.7 55.6 0.215
La Copita (0.2) (9.6) (0.048) (0.1) (7.4) (0.030)
P. glandulosa 1.6 48.1 0.177 1.4 44.4 0.186
Frio Co. (0.1) (9.6) (0.043) (0.1) (7.4) (0.034)
P. glandulosa 1.7 40.7 0.161 1.6 48.9 0.192
Bell Co. (0.2) (9.4) (0.043) (0.1) (7.4) (0.031)
P. glandulosa 1.7 44.4 0.187 1.4 37.8 0.151
Weslaco (0.2) (9.5) (0.047) (0.1) (7.2) (0.030)
P. velutina 1.4 33.3 0.127 1.6 48.9 0.192
Santa Rita (0.1) (9.1) (0.036) (0.1) (7.4) (0.030)
Table V - Matrices of Nei’s (1978) genetic distances estimated from isozyme (below
diagonal) and RAPD data (above diagonal). Coefficients of variation of each estimate are indicated in parentheses.
P. gla LC P. gla FC P. gla BC P. gla WE P. vel SR
P. gla LC 0.18(0.29) 0.07(0.21) 0.07(0.36) 0.16(0.27)
P. gla FC 0.03(0.39) 0.17(0.25) 0.23(0.24) 0.35(0.24)
P. gla BC 0.03(0.32) 0.01(0.36) 0.06(0.35) 0.19(0.26)
P. gla WE 0.02(0.38) 0.03(0.32) 0.03(0.31) 0.23(0.26)
645
Isozyme and RAPD studies in
P
. glandulosa
and
P
. velutina
P. gla LC
P. gla WE
P. gla FC
P. gla BC
P. vel SR
44
100
88
Linkage distance Linkage distance
Dimension 2 Dimension 2
P. gla WE
P. gla LC
P. vel SR
P. gla BC
P. gla FC
P. gla LC
P. gla BC
P. gla WE
P. gla FC
P. vel SR
97
52
P. gla FC
P. vel SR P. gla LC
P. gla BC
P. gla WE
53
were based on isozymes but nonsignificant (P = 0.33) when based on RAPDs. The same tendency (higher correlation for isozyme-based FDTs) was observed if the analysis was restricted to P. glandulosa populations although in this case neither correlation was significant (P = 0.07 and P = 0.68, respectively, for isoenzyme and RAPD-based FDTs).
Correlation between climatic data and molecular markers
Possible dependence of genetic variables (45 RAPD bands and 47 allozymes) on sixteen geographical and cli-matic variables was analyzed through the estimate of Spearman’s rank correlations. From 1472 correlations es-timated, only 68 (4.6%) yielded significant values (P < 0.05), none significant matrix-wide, suggesting that associations among genetic and physical variables have little if any in-fluence on relationships estimated among populations.
DISCUSSION
The taxonomy of Algarobia Section of genus Proso-pis is complicated because of profuse interspecific hybrid-ization in wide areas of sympatry (Hunziker et al. 1975, 1977; Palacios and Bravo, 1981). Previous isoenzymatic studies of South American species (Saidman, 1985, 1986, 1990, Saidman and Vilardi, 1987; Saidman et al., 1997; Verga, 1995) showed relatively high levels of heterozygos-ity within but low differentiation among populations. Diag-nostic loci for species identification are virtually absent and most alleles are shared by South American species so far studied. Virtual lack of clear reproductive barriers as well as high genetic similarity among morphologically good taxonomic species were considered evidence for assuming that several species of this section may constitute a synga-meon (Palacios and Bravo, 1981; Saidman, 1985, 1988; Saidman and Vilardi, 1987, 1993; Saidman et al., 1998a,b). Although hybridization might be considered a plau-sible explanation for high genetic similarities among spe-cies, available information is contradictory. Saidman et al. (1998a) observed that genetic similarity among popula-tions of different species is independent of sympatry and hybridization opportunity. Moreover, Bessega (1997) ob-served high levels of genetic similarity among South American species and P. glandulosa despite geographi-cal isolation. By contrast, the only P. velutina population so far studied exhibited several diagnostic allozymes.
The first results obtained by RAPD technique in “pure” populations (i.e., without evidence of hybridization) and hybrid swarms of South American species of Algarobia (Saidman et al., 1998b) were consistent with those of isozymes. Genetic variability within populations was high and genetic distances among species were very low. How-ever, a P. alba x P. nigra hybrid population showed private RAPD bands at a low frequency not observed in either par-ent (Saidman et al., 1998b). These results seem to
indi-cate that RAPDs might constitute a useful tool for analyz-ing genetic relationships and consequences of hybridiza-tion among Prosopis species.
In the present work isozyme and RAPD analyses were applied to the North American Algarobia species P. glandulosa and P. velutina, comparing the information produced by each methodology. The number of RAPD bands varied from 2 to 10 amplification products per primer. This range agrees with predictions for 10-mer primers in plants (Waugh and Powell, 1992). Sampling variance of genetic distances based on allozyme and RAPD data was measured through coefficient of variation. With the number of loci studied here, CV estimates did not differ statistically be-tween markers and were consistent with estimates expected according to other studies (Thormann et al., 1994; Hallden et al., 1994; Spooner et al., 1996).
The present estimates of genetic variability with both techniques resemble each other and values observed for South American species of Algarobia (Saidman et al., 1998a,b). This result indicates that, despite the relatively low number of mother plants, most alleles present in popu-lations were represented in the seed samples analyzed, as a consequence of the predominantly outcrossing system of these species. The high heterozygosity estimates are also consistent with a tendency to high outcrossing rates. Some discrepancies in results attained with both tech-niques were observed in the estimate of differences among populations. The isozyme-based FDT and genetic distances seem to reflect taxonomic status better than RAPD-based indices do. In the phenogram and multidimensional scaling plots based on isozymes, all P. glandulosa populations formed a tighter group. Pictures obtained from RAPDs showed that Frio Co. was differentiated from the remaining P. glandulosa populations. Moreover, while isozymal dif-ferentiation level among populations may be partially ex-plained by geographical distances, for RAPD markers iso-lation analysis by distance yielded nonsignificant results.
Differences between results from the different tech-niques cannot be attributed to sampling error differences because CVs, as stated above, were very similar. One ex-planation might be that RAPD band homology between spe-cies is overestimated due to co-migration of nonhomo-logous DNA fragments, a possibility testable by hybridiz-ing Southern blots of RAPD products with labelled frag-ments extracted from replicate gels.
Another possible explanation relates to the nature of the markers. Although we have no evidence of selective ef-fects of any polymorphic loci studied here (correlation with climatic and physical variables were nonsignificant), isozyme markers are more likely to respond to adaptive constraints than RAPD loci. If this were the case, conspe-cific populations might show greater isozyme similarity because of occupying the same ecological niche. Testing this possibility would require study of more environmental variables and biotic factors.
to show higher values of genetic differentiation among con-specific populations than those obtained from isozymes, and might be more useful in screening genetic variability within species. Isozymes have shown greater ability to dif-ferentiate the North American species of Algarobia, mainly by GOT and PRX patterns. However, these conclusions can-not be extended to other species, where only allelic fre-quency differences have been detected (Saidman, 1985, 1990; Saidman and Vilardi, 1987, 1993; Saidman et al., 1997, 1998a,b) for isozyme loci.
ACKNOWLEDGMENTS
We wish to express our gratitude to Dr. DeLoack and Ing. Hugo Cordo, who kindly donated the materials studied here. B.O.S. wish to thank Dr. Cesar Benito (Univ. Complutense, Madrid) for his technical advice on RAPD analysis. This work was financed by Universidad de Buenos Aires (grant TY 09 to B.O. Saidman), Agencia Nacional de Promoción Científica y Tecnológica (ANPCYT), and Consejo Nacional de Investigaciones Científicas y Técnicas (CONICET) (grants PICT 02269 and PID 0722 to J.C. Vilardi). C.B. is the recipient of a CONICET fellowship. B.O.S. is member of Carrera del Investigador Científico of CONICET.
RESUMO
Técnicas de análise por alozimas e DNA polimórfico alea-toriamente amplificado (RAPD) foram comparadas quanto a sua utilidade para estudos genéticos e taxonômicos em populações de Prosopis glandulosa e P. velutina. Isozimas e RAPD deram estimativas igualmente elevadas de variabilidade genética. A estrutura genética e a diferenciação foram analisadas pelo índice FDT não hierárquico de Wright (1978). Para todas as populações
consideradas, ambos os marcadores produziram estimativas baixas do fluxo de genes (Nm < 1). Quando apenas as populações de P. glandulosa foram analisadas, os dados de isozima deram estima-tivas do fluxo gênico mais elevadas (Nm > 1), em concordância com o esperado para populações co-específicas. Contudo, com os dados de RAPD a redução esperada em FDT e o aumento em
Nm não foram observados. A correlação entre FDT e as matrizes
de distância geográfica (teste de Mantel) para todas as populações foi significante (P = 0,02) quando baseada em isozimas, mas não tanto (P = 0,33) quando baseada em RAPD. Não foram obser-vadas associações significantes entre variáveis genéticas e geo-gráficas ou climáticas. Dois sistemas isoenzimáticos (GOT e PRX) possibilitaram a distinção entre P. glandulosa e P. velutina, mas não foram detectadas por RAPD bandas diagnósticas para o reconhecimento de populações ou espécies aqui estudadas. Con-tudo, os marcadores de RAPD mostraram valores mais elevados para a diferenciação genética entre populações co-específicas de P. glandulosa e um coeficiente de variação menor do que aqueles obtidos a partir de isozimas.
REFERENCES
Archer, S., Scifres, C., Basshman, R. and Maggio, R. (1988). Autogenic
succession in a subtropical savanna: conversion of grassland to thorn woodland. Ecol. Monogr. 58: 111-127.
Bessega, C. (1997). Estudios isoenzimáticos en especies Americanas del
Género Prosopis (Leguminosae). Master’s thesis, FCEyN, Universidad de Buenos Aires, Buenos Aires.
Black IV, W.C. (1996). FORTRAN Programs for the Analysis of RAPD-PCR
Markers in Populations. Colorado State University, Ft. Collins, CO,
USA.
Brown, J.R. and Archer, S. (1987). Woody plant seed dispersal and gap
formation in a North American subtropical savanna woodland: the role of domestic herbivores. Vegetario 73: 73-80.
Brummer, E.C., Bouton, J.H. and Korchert, G. (1995). Analysis of annual
Medicago species using RAPD markers. Genome 38: 362-367.
Burkart, A. (1976). A monograph of the genus Prosopis (Leguminosae
subfam. Mimosoidae). J. Arnold Arbor. Harv. Univ. 57: 219-249,
450-525.
Cony, M. (1995). Reforestación racional de zonas áridas y semiáridas con
árboles de múltiples propósitos. Interciencia 20: 249-253.
Dellaporta, S.L., Wood, J. and Hicks, J.B. (1983). A plant DNA
mini-preparation: Version II. Plant Mol. Biol. Rep. 1: 19-21.
Felker, P. (1984). Legume trees in semi-arid and arid areas. Pesqui. Agropecu.
Bras. 19: 47-59.
Felsenstein, J. (1993). PHYLIP (Phylogeny Inference Package) v. 3.5c.
Department of Genetics, The University of Washington, Seattle, WA.
Fisher, C.E. (1977). Mesquite and modern man in southwestern North
America. In: Mesquite. Its Biology in Two Desert Scrib Ecosystems
(Simpson, B.B., eds.). US/IBP Synthesis Series. Vol. 4. ISBN: 0-87933-278-6. Dowden, Hutchinson and Ross, Inc., Stroudsburg, PA, USA.
Habit, M.A., Contreras, D.T. and Gonzalez, R.H. (1981). Prosopis tamarurgo:
Arbusto Forrajero para Zonas Áridas. Estudio FAO: Producción y Protección vegetal. Org. Nac. Unidas para la Agric. y la alimentación, Roma 25: 1-133.
Hallden, C., Nilsson N.O., Rading, M.I. and Sall, T. (1994). Evaluation of
RFLP and RAPD markers in comparison of Brassica napus breeding
lines. Theor. Appl. Genet. 88: 123-128.
Hamrick, J.L. and Allard, R.W. (1972). Microgeographical variation in
allozyme frequencies in Avena barbata. Proc. Natl. Acad. Sci. USA 69: 2100-2104.
Hamrick, J.L. and Godt, J.W. (1990). Allozyme diversity in plant species. In:
Plant Population Genetics, Breeding, and Genetics Resources (Brown, H.D., Cleg, M.T., Kahler, A.L. and Weir, B.S., eds.). Sinaver Associates Inc. Publishers, Sunderland, MA, USA.
Hennessy, J.T., Gibbens, J.P., Tromble, J.M. and Cardenas, M. (1983).
Veg-etation changes from 1935-1980 in mesquites dunelands and former grassland of southern New Mexico. J. Range Manage. 36: 370-374.
Hong, Y.P., Hipkins, V.D. and Strauss, S.H. (1993). Chloroplast DNA
diver-sity among trees, populations and species in the California closed-cone pines (Pinus radiata, Pinus muricata and Pinus attenuata). Genetics 135: 1187-1196.
Hunziker, J., Poggio, L., Naranjo, C.A., Palacios, R.A. and Andrada, A.B.
(1975). Cytogenetics of some species and natural hibrids in Prosopis
(Leguminosae). Can. J. Genet. Cytol. 17: 253-262.
Hunziker, J., Naranjo, C.A., Palacios, R.A. and Poggio, L. (1977).
Chromo-somal cytology and hybridization. In: Mesquite. Its Biology in Two Deserts Ecosystems (Simpson, B.B., ed.). Dowden, Hutchinson and Ross, Inc., Stroudsburg, PA, USA.
Joshi, A.B. and Nimbkar, N. (1991). Evaluation of the productivity of
Prosopis species as a biomass source in semi-arid region of western Maharashtra. Final technical report. Department of Non-Conventional Energy Sources (DNES), Ministry of Energy, Government of India, New Delhi, Ref. No. 201/38/86-BM.
Keim, P., Paige, K.N. and Whitham, T.G. (1989). Genetic analysis of an
interespecific hybrid swarm of Populus: occurrence of unidirectional introgression. Genetics 123: 557-565.
Keys, R.N. and Smith, S. (1994). Mating system parameters and population
genetic structure in pioneer populations of Prosopis velutina (Legumi-nosae). Am. J. Bot. 81: 1013-1020.
Leakey, R.B. and Last, F.T. (1980). Biology and potential of Prosopis
spe-cies in arid environment,with particular reference to P. cineraria. J. Arid Environ. 3: 9-24.
Lynch, M. and Milligan, B.G. (1994). Analysis of population genetic
struc-ture with RAPD markers. Mol. Ecol. 3: 31-99.
regression approach. Cancer Res. 27: 209-220.
Microsoft Encarta World Atlas (1995-1996). Microsoft Corporation.
Morello, J., Crudelli, N. and Saraceno, M. (1971). Los Vinalares de Formosa.
INTA, Serie fitogeográfica No.11, Buenos Aires.
Nei, M. (1978). Estimation of average heterozygosity and genetic distance
from a small number of individuals. Genetics 89: 583-590.
Nei, M. (1987). Molecular Evolutionary Biology. Columbia University Press,
New York, USA.
Ohta, T. (1982). Linkage disequilibrium due to random genetic drift in finite
subdivided populations. Proc. Natl. Acad. Sci. USA 79: 1940-1944.
Palacios, C. and Gonzalez-Candelas, F. (1997). Analysis of population
ge-netic structure and variability using RAPD markers in the endemic and endangered Limonium dufourii (Plumbaginaceae). Mol. Ecol. 6: 1107-1121.
Palacios, R.A. and Bravo, L.D. (1981). Hibridación natural en Prosopis
(Leguminosae) en la región chaqueña argentina. Evidencias morfológicas y cromatográficas. Darwiniana 23: 3-35.
Raymond, M. and Rousset, F. (1995). An exact test for population
differentia-tion. Evolution 49: 1280-1283.
Saidman, B.O. (1985). Estudio de la variación alozímica en el género Prosopis.
PhD thesis, Fac. Cs. Exactas y Nat., Universidad de Buenos Aires, Buenos Aires.
Saidman, B.O. (1986). Isoenzymatic studies of alcohol dehydrogenase and
glutamate oxalacetate transaminase in four South American species of
Prosopis and their natural hybrids. Silvae Genet. 35: 3-10.
Saidman, B.O. (1988). La electroforesis de isoenzimas para la medición de la
variabilidad genética en especies de Prosopis. In: Prosopis en Argen-tina (FAO - PIRB, eds.). Documento preliminar elaborado para el I Taller
Internacional sobre Recurso Genético y Conservación de Germoplasma en Prosopis. Fac. Cs. Agrarias. U. N. Córdoba, Rep. Argentina, pp. 107-118.
Saidman, B.O. (1990). Isozyme studies on hybrid swarms of Prosopis
caldenia and sympatric species. Silvae Genet. 39: 5-8.
Saidman, B.O. (1993). Las isoenzimas en el estudio de la variación genética
y las afinidades entre especies de Prosopis.Bol. Genét. Inst. Fitotéc. Castelar 16: 25-37.
Saidman, B.O. and Vilardi, J.C. (1987). Analysis of the genetic similarities
among seven species of Prosopis (Leguminosae: Mimosoideae). Theor. Appl. Genet. 75: 109-116.
Saidman, B.O. and Vilardi, J.C. (1993). Genetic variability and germplasm
conservation in the genus Prosopis. In: Nursery Technology of Forest Tree Species of Arid and Semiarid Regions (Puri, S., ed.). Winrock-Oxford & IBH Publishing Co. PVT. Ltd., New Delhi, Bombay, Calcuta, pp. 187-198.
Saidman, B.O., Montoya, S., Vilardi, J.C. and Poggio, L. (1997). Genetic
variability and ploidy level in species of Prosopis. Bol. Soc. Argent. Bot. 32: 217-225.
Saidman, B.O., Vilardi, J.C., Montoya, S., Dieguez, M.J. and Hopp, H.E.
(1998a). Molecular markers: A tool for the understanding of the relation-ships among species of Prosopis (Leguminosae, Mimosoidae). In: Tree Improvement: Applied Research and Technology Transfer (Puri, S.,
ed.). Science Publishers Inc., New Hampshire, USA, Ch 21, 311-324.
Saidman, B.O., Bessega, C., Ferreyra, L. and Vilardi, J.C. (1998b).
Ran-dom amplified polymorphic DNA (RAPDS) variation in hybrid swarms and pure populations of genus Prosopis (Leguminosae). International Foundation for Science (IFS). Proceedings of the Workshop “Recent
Advances in Biotechnology for Tree Conservation and Management,”
Florianópolis, 122-134.
Scanlan, J.C. and Archer, S. (1991). Simulated dynamics of succession in
North American subtropical Prosopis Savanna. J. Vegetation Sci. 2:
625-634.
Schlesinger, W.R.J., Reynolds, E., Cunninham, L., Huenneke, F., Jarrell,
W.M., Virginia, A. and Whitford, W.G. (1990). Biological feedback in
global desertification. Science 247: 1043-1048.
Simpson, B.B. (1977). Breeding systems of dominant perennial plants of 2
disjunct warm desert ecosystems. Oecología 27: 203-226.
Simpson, B.B. and Solbrig, O.T. (1977). Introduction. In: Mesquite. Its
Biol-ogy in Two Desert Ecosystems (Simpson, B.B., ed.). US/IBP. Series 4.
Dowden, Hutchinson y Ross, Inc, Stroudsburg, PA, USA, pp. 1-15.
Soltis, P.S., Soltis, D. and Doyle, J. (1992). Molecular Systematics of Plants.
Chapman and Hall, New York, USA.
Spooner, D.M., Tivang, J., Nienhuis, J., Miller, J.T., Douches, D.S. and
Contreras-M.A. (1996). Comparison of four molecular markers in
mea-suring relationships among the wild potato relatives Solanum section
Eutuberosum (subgenus Potatoe). Theor. Appl. Genet. 92: 532-540.
StatSoft, Inc. (1995). STATISTICA for Windows [Computer Program Manual].
Tulsa, OK: StatSoft, Inc., 2300 East 14th Street, Tulsa, OK, 74104-4442, (918) 749-1119; Fax: (918) 749-2217; E-mail: info@statsoftinc.com; WEB: http://www.statsoftinc.com.
Swoboda, I. and Bhalla, P.I. (1997). RAPD analysis of genetic variation in the
Australian fan flower, Scaevola. Genome 40: 600-606.
Swofford, D.L. and Selander, R.B. (1981). BIOSYS-1: a FORTRAN program
for the comprehensive analysis of electrophoretic data in population genetics and systematics. J. Hered. 72: 281-283.
Thormann, C.E., Ferreira, M.E., Camargo, L.E.A., Tivang, J.G. and Osborn,
T.C. (1994). Comparison of RFLP and RAPD markers to estimating ge-netic relationships within and among cruciferous species. Theor. Appl. Genet. 88: 973-980.
Verga, A.R. (1995). Genetische Untersuchungen an Prosopis chilensis und
Prosopis flexuosa (Mimosaceae) im trockenen Chaco Argentiniens. PhD thesis, in Göttingen Research Notes in Forest Genetics, Göttinger Fortge-netische Berichte. Abteilung für Forstgenetik und Forstpflanzen-züchtung der Universität Göttingen, ISSN 0940-7103.
Wachira, F.N., Waugh, R., Hachett, C.A. and Powell, W. (1995). Detection of
genetic diversity in tea (Camellia sinesis) using RAPD markers. Ge-nome 38: 201-210.
Waugh, R. and Powell, W. (1992). Using RAPD markers for crop
improve-ment. Tibtech 10: 186-191.
Wolff, K. and Peters-van Rijn, J. (1993). Rapid detection of genetic
variabil-ity in chrysanthemum (Dendanthema grandiflora Tzvelev) using
ran-dom primers. Heredity 71:335-341.
Wright, S. (1951). The genetical structure of populations. Ann. Eugenics
15: 323-354.
Wright, S. (1978). Evolution and the genetics of populations. Vol. 4.
Vari-ability Within and Among Natural Populations. University of Chicago Press, Chicago.
Yanesita, M., Nagasawa, R., Engelke, M.C. and Sasakuma, T. (1997).
Ge-netic variation and interespecific hibrydization among natural popula-tions of zoysiagrasses detected by RFLP analysis of chloroplast and nuclear DNA. Genes Genet. Syst. 72: 173-179.