www.atmos-chem-phys.net/11/1217/2011/ doi:10.5194/acp-11-1217-2011
© Author(s) 2011. CC Attribution 3.0 License.
Chemistry
and Physics
Absorption ˚
Angstr¨om coefficient, brown carbon, and aerosols:
basic concepts, bulk matter, and spherical particles
H. Moosm ¨uller1, R. K. Chakrabarty1, K. M. Ehlers2, and W. P. Arnott3
1Desert Research Institute, Nevada System of Higher Education, Reno, NV 89512, USA 2Department of Mathematics, Truckee Meadows Community College, Reno, NV 89512, USA 3Department of Physics, University of Nevada, Reno, NV 89557, USA
Received: 16 September 2010 – Published in Atmos. Chem. Phys. Discuss.: 22 October 2010 Revised: 29 January 2011 – Accepted: 2 February 2011 – Published: 14 February 2011
Abstract. The concept of wavelength-dependent absorp-tion ˚Angstr¨om coefficients (AACs) is discussed and clari-fied for both single and two-wavelengths AACs and guid-ance for their implementation with noisy absorption spectra is provided. This discussion is followed by application of the concept to models for brown carbon bulk absorption spec-tra including the damped simple harmonic oscillator model, its Lorentzian approximation, and the band-gap model with and without Urbach tail. We show that the band-gap model with Urbach tail always has an unphysical discontinuity in the first derivative of the AAC at the band-gap – Urbach-tail matching wavelength. Complex refractive indices obtained from the bulk damped simple harmonic oscillator model are used to calculate absorption spectra for spherical particles, followed by a discussion of their features. For bulk material and small particles, this model predicts a monotonic decrease of the AAC with wavelength well above the resonance wave-length; the model predicts a monotonic increase for large par-ticles.
1 Introduction
The ˚Angstr¨om coefficient was originally introduced as a independent constant to describe wavelength-dependent extinction of light by aerosols ( ˚Angstr¨om, 1929). It was concluded that it has a “very marked dependence on the size of the scattering particles, but not, in the case of un-coloured substances like MgO, ZnO, SbO, on the substance
Correspondence to:H. Moosm¨uller ([email protected])
itself” ( ˚Angstr¨om, 1929). The aerosol size dependence of the ˚Angstr¨om coefficient was known and used to deduce the average diameter of atmospheric aerosols as≈1 µm for sev-eral surface stations between 35 m and 2250 m in altitude. In addition, it was recognized that the ambient ˚Angstr¨om coef-ficient was far lower during the haziest days of the summer of 1912, after the eruption of Mount Katmai, and it was con-cluded that the size of volcanic particles from this eruption must have been considerably larger than the ordinary size of dust particles in the atmosphere with an estimated diameter of≈1.5–2.0 µm ( ˚Angstr¨om, 1929).
in describing the wavelength-dependent absorption of bulk and particulate brown carbon (BrC) in connection with dif-ferent bulk theoretical models including the damped simple harmonic oscillator model and its Lorentzian approximation (Demtr¨oder, 2003) and the band-gap model with and without Urbach tail (Sun et al., 2007). The bulk complex refractive index prescribed by the damped simple harmonic oscillator model is used to calculate absorption spectra for spherical particles with a small size parameter approximation (Bohren and Huffman, 1998) and Mie theory (Mie, 1908).
2 Absorption ˚Angstr¨om coefficients
The absorption ˚Angstr¨om coefficient AAC is the exponent in a power law expressing the ratio of the absorption coeffi-cientsα(λ) at two vacuum wavelengthsλ1andλ2as a func-tion of the ratio of these wavelengths as (Moosm¨uller et al., 2009)
α (λ1) α (λ2)
=
λ 1 λ2
−AAC
. (1a)
The AAC can be written explicitly as AAC(λ1,λ2)= −
ln(α (λ1))−ln(α (λ2)) ln(λ1)−ln(λ2)
. (1b)
Measurement or calculation of the AAC requires determina-tion of the absorpdetermina-tion coefficientα(λ) at two wavelengthsλ1 andλ2making the AAC specific for this wavelength pair and complicating comparison of different determinations if the AAC is wavelength dependent. Therefore, definition of the AAC as a function of a single wavelength can be useful.
Figure 1 gives two examples of wavelength dependent ab-sorption coefficientsα(λ) with ln(α)(plotted on the y-axis) shown as a function of ln(λ)(plotted on the x-axis). Here the AAC is the negative slope in log-log space. The thin solid line is an example for black carbon (BC) aerosol in the Rayleigh regime, where the size parameterx(i.e., the ratio of particle circumference and wavelengths; see Eq. 11) is much smaller than one and the imaginary part of the refractive in-dex is independent of wavelength, resulting in a straight line with a constant slope of−1 and an AAC of one, independent of wavelength (Bohren and Huffman, 1998; Moosm¨uller and Arnott, 2009; Moosm¨uller et al., 2009). The thick solid line is a hypothetical example of what the absorption coefficient of a mixture of BC and BrC may look like, that is the sum of a function with the inverse wavelength dependence of BC and a resonance peak in the UV (in this example, at 0.3 µm) (Andreae and Gelencs´er, 2006). Note that for the BrC-BC mixture, the slope and therefore the AAC are dependent on wavelength. For both example absorption spectra, Fig. 1 il-lustrates measurement of the two-wavelength AAC (λ1,λ2) forλ1=0.4 µm andλ2=1.0 µm, resulting in AACs of 1.0 for BC and 2.4 for the hypothetical BrC-BC mixture. Obvi-ously for this BrC-BC mixture example, measurements for a different wavelength pair would result in a different AAC.
Fig. 1. Illustration of the concept of the absorption ˚Angstr¨om co-efficient being the negative slope of the absorption coco-efficient as a function of wavelength in a log-log plot. The thin solid line is an ex-ample for BC aerosol in the Rayleigh regime, while the thick solid line is a hypothetical example of what the absorption coefficient of a mixture of BC and BrC may look like, that is the sum of a func-tion with the inverse wavelength dependence of BC and a resonance peak in the UV.
From this discussion and Fig. 1, the definition of a single wavelength AAC is obvious. It is the negative log-log slope of the absorption spectrum at a wavelength λas shown in Fig. 1 by a dotted line tangential to the absorption spectrum at wavelengthλ. Therefore, the single-wavelength AAC can be written as
AAC(λ)= −dln(α)
dln(λ) = − dln(α)
dλ dλ dln(λ)= −
λ α (λ)
dα dλ. (2) Expressions for single-wavelength AACs can be obtained di-rectly from analytical expressions of the absorption coeffi-cient using Eq. (2) or from multi-wavelength measurements with the help of analytical interpolation and/or numerical dif-ferentiation.
Single and two-wavelength AACs can be connected by in-tegrating the single-wavelength AAC in ln(λ)space and di-viding by the distance in ln(λ)space, thereby yielding the two wavelength ˚Angstr¨om coefficient as
AAC(λ1,λ2)=
λ2 R
λ1
AAC(λ)dln(λ) ln(λ2)−ln(λ1) =
−
λ2 R
λ1 λ α(λ)
dα dλdln(λ)
ln(λ2)−ln(λ1)
= −
λ2 R
λ1 dα α(λ)
ln(λ2)−ln(λ1)
= −ln(α (λ2))−ln(α (λ1))
ln(λ2)−ln(λ1)
, (3)
While the discussion and definitions above are useful for analysis of line shape models, it may be difficult to ap-ply them directly to the analysis of experimental absorption spectra. Experimental data generally contain high-frequency noise and numerical differentiation further increases such noise if directly applied to raw data. However, the AAC concept seeks to describe low-frequency spectral changes. Therefore, noisy spectra first need to be fitted or approxi-mated with theoretical or empirical expressions that reduce high frequency noise and consequently can be used to calcu-late AACs as discussed above. A simple example is anal-ysis of experimental absorption spectra that have a near-linear wavelength dependence on a log-log plot between two wavelengthsλ1andλ2. Such an analysis can define a two-wavelength AAC (λ1,λ2)as the negative log-log slope de-termined by linear regression of the absorption spectrum be-tween the two wavelengthsλ1andλ2(e.g., Hecobian et al., 2010), taking the linear dependence in the log-log plot as an empirical or theoretical model for the wavelength depen-dence of the absorption coefficient. More sophisticated mod-els have been used for extinction ˚Angstr¨om coefficients, fit-ting the relationship between aerosol extinction coefficient and wavelength in log-log space with a second-order poly-nomial (Schuster et al., 2006). This yields an offset, a slope, and a curvature describing the wavelength dependence of ex-tinction, where for zero curvature the negative slope corre-sponds to the extinction ˚Angstr¨om coefficient.
3 Brown carbon (BrC) absorption spectra
We discuss models of BrC absorption spectra, first for bulk BrC where the absorption coefficient is directly proportional to the imaginary part of the refractive index. This is followed by use of complex refractive indices calculated with the bulk damped, simple harmonic oscillator model in the approxima-tion of absorpapproxima-tion spectra of small BrC spheres and in Mie theory calculation of absorption spectra of BrC spheres of arbitrary size.
3.1 Bulk absorption spectra
Models for BrC bulk absorption spectra discussed in the fol-lowing are the damped simple harmonic oscillator model and its Lorentzian approximation plus the band-gap model with-out and with Urbach tail.
3.1.1 Damped simple harmonic oscillator model
Very little is known about the spectrum of the complex re-fractive index m (m=n+ik) of BrC; therefore, it is de-scribed here with a very basic physical expression: the Kramers-Kronig dispersion relations for the damped simple harmonic oscillator (Demtr¨oder, 2003) as
nSHO =1+a
ν02−ν2 ν20−ν22
+(γ ν)2
(4a)
and kSHO=a
γ ν
ν02−ν22
+(γ ν)2
, (4b)
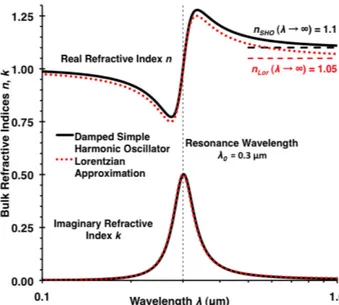
wherenSHOandkSHOare the real and imaginary part of the complex refractive indexmSHOfor the damped simple har-monic oscillator model, respectively;ν=c/λandν0=c/λ0 are the frequency and resonance frequency of the oscillator, respectively; withcbeing the speed of light,ais a constant, and γ is a line width parameter. An example of the real and imaginary part of the complex refractive index mSHO is shown in Fig. 2, plotted as a function of wavelength λ as solid black lines fora=1029s−2,γ=2×10¹⁴s−1, and λ0=300 nm corresponding toν0=1015 s−1. The real part nSHOhas the typical dispersion shape with normal dispersion (i.e., n decreasing with increasing wavelengthλ for wave-lengths well above the resonance wavelength), and a limit of nSHO=1+a (λ0/c)2 (= 1.1 for the parameters above) for λ→ ∞. The imaginary part has the shape of a typical ab-sorption line with its peak at the resonance wavelengthλ0. Note that the assumption of a single resonance frequency is overly simplistic, especially for describing spectral proper-ties in the ultraviolet below the resonance wavelength λ0, where, for most materials, multiple absorption lines, often re-sulting in continuous, strong absorption bands are expected. Spectral properties in this region are shown more for an ap-preciation of the mathematical equations than for a realis-tic description of spectral properties, and the wavelength re-gion well above the resonance wavelength is most relevant for most applications.
The imaginary partkof the complex refractive index is di-rectly related to the bulk absorption coefficientαbulkthrough (Bohren and Huffman, 1998)
αbulk =4π k
λ (4c)
andαbulk can be written for the damped simple harmonic oscillator as
αbulk SHO =4πkSHO
λ =
4π a c
γ ν2
ν20−ν22
+(γ ν)2
. (4d)
Fig. 2.Real (top lines) and imaginary (bottom lines) refractive in-dices for the damped simple harmonic oscillator (solid black lines) and its Lorentzian approximation (dotted red lines) as a function of wavelengthλ(logarithmic scale) with the resonance wavelength λ0=0.3 µm shown as vertical dashed line and the long wavelength limits ofnas horizontal dashed lines.
3.1.2 Lorentzian approximation of the damped simple harmonic oscillator model
Close to the resonance frequency (i.e., |ν0−ν| ≪ν0), the term (ν0+ν) in the Kramers-Kronig dispersion relations for the damped simple harmonic oscillator (Eqs. 4a, b) can be approximated as
ν+ν0=2ν0, (5a)
yielding simplified expressions for the complex refractive in-dex as (Demtr¨oder, 2003)
nLor =1+ a 2ν0
ν0−ν
(ν0−ν)2+(0.5γ )2 and (5b) kLor =
a 4ν0
γ
(ν0−ν)2+(0.5γ )2, (5c)
wherekLor has a Lorentzian line shape and bothnLor and kLorare shown in Fig. 2 as dotted red lines for the same pa-rameters used for the curves of the damped simple harmonic oscillator shown in the same figure. Note that the Lorentzian approximation results in sizeable changes for the real part of the complex refractive index away from the resonance wave-length, while the imaginary part is largely unchanged.
The bulk absorption coefficient is proportional to the imaginary part of the complex refractive index (Eq. 4c) and can be written as (Demtr¨oder, 2003)
αbulk Lor =4π kLor
λ =
π a c
γ
(ν0−ν)2+(0.5γ )2. (5d)
Fig. 3. Bulk absorption ˚Angstr¨om coefficient for the damped sim-ple harmonic oscillator (AACbulk SHO; solid black line) and its Lorentzian approximation (AACbulk Lor; dotted red line) shown as a function of wavelengthλ(logarithmic scale) with the resonance wavelengthλ0=0.3 µm shown as the vertical dashed line and the long wavelength limits of AACbulkas horizontal dashed lines.
The resulting AACbulk Lor of this Lorentzian line shape (Eq. 5d) can be calculated with Eq. (2) and is shown in Fig. 3 as a red dotted line. As expected, agreement with the damped simple harmonic oscillator is excellent near the resonance. Away from the resonance, however, AACbulk Lorhas an ab-solute value substantially smaller than that of AACbulk SHO, and its limit forλ→ ∞is one instead of two. This is due to the fact that in this limit, the assumption for the Lorentzian approximation (i.e.,|ν0−ν| ≪ν0)is not fulfilled and results cannot be expected to be in agreement with the damped sim-ple harmonic oscillator model.
3.1.3 Band-gap model
The band-gap model (Tauc et al., 1966) has attributed the AAC=1 of BC to its zero band gap and also has been used to discuss the absorption spectrum of BrC (Bergstrom et al., 2007; Bond, 2001; Sun et al., 2007). This model relates the bulk absorption coefficientαbulk BG to the band-gap energy EBG, the difference between the highest occupied and lowest unoccupied energy state as (Sun et al., 2007)
αbulk BG(λ) =C λ
1 λ−
1 λBG
2
=C 1 λ−
2 λBG+
λ
λ2BG !
∀ 0≤ λ≤λBG
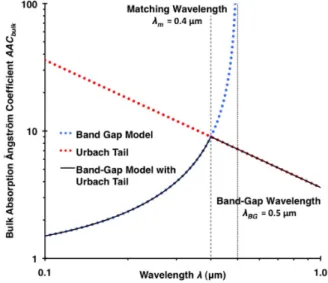
Fig. 4.Bulk absorption coefficientαcalculated with the band-gap model (blue dotted line), the Urbach-tail extension (red dotted line), and the band-gap model with Urbach tail (black solid line). Param-eters used for this example areC=1,λBG=0.5 µm,λm=0.4 µm, λ0=3.6 µm, andαm=0.1 µm−1.
where λBG is the wavelength corresponding to EBG (i.e., λBG=hc/EBG;his Planck’s constant), andCis a constant (i.e.,C=B2hc in the notation of Sun et al., 2007). Note, however, that some of Sun et al.’s notation is not consistent. For example, withBin the units given in the caption of their Fig. 1,αin their Eq. (5) would have to be replaced byα/ρ as can be shown by simple dimensional analysis. An exam-ple of a bulk absorption coefficientαbulk BGcalculated with the band-gap model (blue dotted line), is shown in Fig. 4 for C=1 andλBG=0.5 µm. Note thatαbulk BG is zero at and above the band-gap wavelengthλBG.
Using Eq. (2), the AAC of the band-gap model AACbulk BGreadily can be calculated as
AACbulk BG(λ) =
λBG+λ λBG−λ
∀ 0≤ λ≤λBG
AACbulk BG(λ) =0 ∀ λ > λBG, (7) in agreement with Sun et al. (2007). An example of AACbulk BG is shown in Fig. 5 (blue dotted line) for λBG=0.5 µm as a function of wavelength, demonstrating that AACBGmonotonically increases with increasing wave-length, diverging toward AACBG= ∞ atλBG. This theo-retical behavior is opposite to experimental measurements reporting that BrC AAC generally decreases with increas-ing wavelength without showincreas-ing any divergence at a band-gap wavelength (Russell et al., 2010; Chen and Bond, 2010; Lewis et al., 2008). The drop of the band-gap model ab-sorption coefficient towards the band-gap wavelength, how-ever, is a well-known shortcoming of the simple band-gap model, as displayed in Fig. 5. To mitigate this shortcoming, the band-gap model often is combined with an empirical
ex-Fig. 5. Bulk absorption ˚Angstr¨om coefficient AACbulkcalculated with the band-gap model (blue dotted line), the Urbach-tail exten-sion (red dotted line), and the band-gap model with Urbach tail (black solid line). Parameters used for this example are λBG=
0.5 µm,λm=0.4 µm, andλ0=3.6 µm.
ponential decay of the absorption coefficient towards longer wavelength, the Urbach tail, which is discussed in the fol-lowing section.
3.1.4 Band-gap model with Urbach tail
Because a few energy states exist within the band gap, ab-sorption spectra exhibit a tail beyond the band-gap wave-lengthλBG, rather than a sharp cutoff (Sun et al., 2007; Ur-bach, 1953). This tail can be described with an exponential decay of the absorption coefficient αbulk Urb as (Sun et al., 2007)
αbulk Urb(λ)=αmexp
−λ0
1 λm−
1 λ
, (8)
where λ0 is a characteristic decay width and αm = αbulk Urb(λm) is the absorption coefficient at a matching wavelengthλm. An example of an Urbach-tail absorption co-efficientαbulk Urbspectrum is shown in Fig. 4 as a red dotted line forλ0=3.6 µm,λm=0.4 µm, andαm=0.1 µm−1.
The AAC of the Urbach tail AACbulk Urbcan be calculated from Eq. (8) using Eq. (2) as
AACbulk Urb(λ) = λ0
λ . (9)
with limits of AACbulk Urb(λ=0)= ∞and AACbulk Urb(λ=
λm< λBG). The resulting band-gap/Urbach-tail model uses the band-gap model at wavelengths shorter than the matching wavelength and the Urbach-tail model at longer wavelengths. Starting this matching process with the absorption coeffi-cient (i.e.,αbulk BG(λm)=αbulk Urb(λm))gives the parame-terαmin the Urbach-tail model as
αm =C λm
1 λm
− 1
λBG 2
=C 1 λm
− 2
λBG
+ λm
λ2BG !
(10a)
and yields a continuous function for the absorption co-efficientαbulk BG Urb in the resulting band-gap/Urbach-tail model as
αbulk BG Urb(λ)=αbulk BG(λ)=C λ 1
λ− 1 λBG
2
∀ λ≤λm
αbulk BG Urb(λ)=αbulk Urb(λ)
=C λm
1 λm
− 1
λBG 2
exp
−λ0
1 λm
−1
λ
∀λ≥λm.(10b) In addition to obtaining a continuous function for the absorp-tion coefficient, it also is desirable to obtain a continuous function for the AAC of the resulting band-gap/Urbach-tail model AACbulk BG Urb, which is equivalent to a continuous first derivative of the absorption coefficient. This match gives the characteristic decay widthλ0of the Urbach model as λ0=λm
λBG+λm λBG−λm
, (10c)
for use in Eq. (10b).
Unfortunately, additional matching of the first derivatives of the AACs cannot be achieved. Therefore, the first deriva-tive of AACbulk BG Urbremains discontinuous at the match-ing wavelength. An example of this can be seen in Fig. 5, where the slope of AACbulk BG Urb“jumps” from a positive to a negative value at the matching wavelength. Obviously, this kind of behavior is unphysical and has, to the best of our knowledge, not been observed. Therefore, even the addition of the Urbach tail to the band-gap model does not yield a sensible model of AACbulkin agreement with observations, making the band-gap/Urbach-tail model unsuitable for ex-plaining the behavior of the bulk BrC AAC.
3.2 Absorption spectra of spherical brown carbon (BrC) particles
Absorption spectra of particles depend on the properties of the bulk matter, particle morphology, and size (Moosm¨uller et al., 2009). Here, we limit discussion of particle absorp-tion spectra to those of homogeneous, spherical particles as a function of particle diameter.
A complete analytical solution of Maxwell’s equations for the scattering of infinite electromagnetic plane waves from homogeneous, linear, isotropic, spherical particles (Bohren
and Huffman, 1998; Mie, 1908) has been developed by the German physicist Gustav Mie (Lilienfeld, 1991; Mishchenko and Travis, 2008) and is commonly known as Mie theory. This theory calculates particle optical properties from the complex refractive index of the particle and that of its sur-rounding medium (here assumed to be 1) and the size param-eterxof the particle, which is the ratio of particle circumfer-enceπd(dbeing the particle diameter) and wavelengthλof the electromagnetic wave as
x = π d
λ . (11)
Mie theory uses bulk material properties contained in the complex refractive index spectrum to obtain the absorption spectra of particles. If the complex refractive index is inde-pendent of wavelengthλ(such as for BC in the visible and near-visible spectrum), Mie theory is scale invariant and de-pends only on the size parameterx(Mishchenko, 2006). For an explicit wavelength dependence of the complex refractive index (such as for BrC), particle size and electromagnetic wavelength need to be considered separately.
While Mie theory contains solutions for all particle size parameters, it is often useful to investigate simpler solutions for specific size parameter ranges to gain additional physi-cal insight. This is done in the following section for small spherical particles, followed by a section discussing Mie cal-culations for a large range of particle sizes.
3.2.1 Small spherical particles
For small spherical particles, that is for particles with a size parameterx≪1, the absorption cross-section σabs can be written as (Bohren and Huffman, 1998; Sun et al., 2007)
σabs = 6π V
λ Im
m2−1 m2+2 !
=αbulkV ξ (λ), (12a)
where Im denotes the imaginary part of its argument; and the absorption cross-section for small spherical particles is the product of their volumeV, bulk absorption coefficientαbulk, and ofξ(λ), a weak function of the imaginary refractive index k, with (Sun et al., 2007)
ξ (λ)= 9n
n2−k2+22
+4n2k2. (12b)
Fig. 6.Functionξfor the complex refractive indexm=n+ik speci-fied in Eq. (4) as a function of wavelengthλ(logarithmic scale) with the resonance wavelengthλ0=0.3 µm shown as a vertical dashed line and the long wavelength limit ofξas a horizontal dashed line. Note thatξdepends only weakly on the wavelength resulting in ab-sorption cross-sections for small spherical particles that have wave-length dependence very similar to that of the bulk absorption coef-ficient.
absorption coefficient. The long wavelength limit of ξ is ξ∞=9n∞/(n2∞+2)2withn∞=1+a (λ0/c)2forλ→ ∞. We compare the resulting mass absorption efficiency Eabs and AAC spectra of small spherical particles with those from Mie theory and of bulk matter in Figs. 7 and 8, demonstrating agreement with small particle (i.e.,d=0.01 µm) Mie theory and similarity and a small enhancement of the AAC of small particles compared to that of bulk matter near the resonance frequency.
3.2.2 Spherical particles of arbitrary size
For homogeneous, spherical particles with a diameter rang-ing from 0.01 to 10 µm, Mie theory has been used to calculate their mass absorption efficiency as a function of wavelength λ ranging from 0.01 to 10 µm. The mass absorption effi-ciencyEabsis defined as the particle absorption cross section σabsper particle massmor
Eabs = σabs
m =
σabs
ρV =
6σabs
ρ π d3, (13)
whereρ andV are particle mass density and particle vol-ume, respectively. Results of these Mie theory calculations are shown in Fig. 7 withρ=1 g cm−3for the damped simple harmonic oscillator and parameters identical to those used for previous figures together with results for the small
spher-Fig. 7. Damped simple harmonic oscillator model wavelength de-pendence of the mass absorption efficiency (Eabs; for a mass den-sity of 1 g cm−3) for fine particles (Eq. 12 and Fig. 6) and for spherical particles with particle diameter ranging from 0.01 µm to 10 µm from Mie theory calculations using the bulk refractive index (Eqs. 4a, b and Fig. 2).
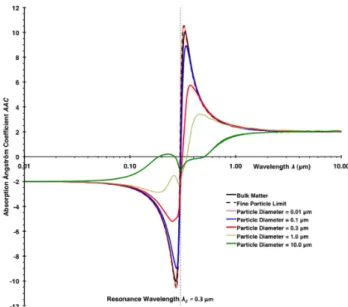
Fig. 8. Damped simple harmonic oscillator model wavelength de-pendence of the absorption ˚Angstr¨om coefficient (AAC) for bulk matter (Eqs. 4b, c and Fig. 3), fine particles (Eq. 12), and spherical particles with particle diameter ranging from 0.01 µm to 10 µm from Mie theory calculations using the bulk refractive index (Eqs. 4a, b).
of the refractive index is very small (i.e., k=7.4×10⁻⁷) corresponding to a bulk absorption coefficient of αbulk=
9.4×10⁻⁴µm−1, which allows the light to fully penetrate virtually all particle sizes, resulting in volume absorbers with nearly identical mass absorption efficiency (Sun et al., 2007) as obvious in Fig. 7. For the longest wavelength shown (i.e., λ=10 µm), the imaginary part of the refractive index is not as small (i.e.,k=6.0×10⁻⁴)as for the shortest wavelength, however the longer wavelength results in a comparable bulk absorption coefficient of αbulk=7.6×10⁻⁴µm−1. There-fore, full penetration of the spheres by incident light is ex-pected. As a particle size parameterx of about one is ap-proached, however, particle absorption is enhanced by inter-nal resonances yielding increased mass absorption efficien-cies (i.e., by≈15%) for the largest particle size (i.e., 10 µm in diameter), as clearly visible in Fig. 7.
The spectra for the small particle limit (Eq. 12) and for the particle diameter of 0.01 µm show excellent agreement with each other and peak just slightly below the resonance wave-length (i.e.,λ0=0.3 µm), where the bulk absorption coeffi-cient and imaginary part of the refractive index peak. This slight shift is related to the asymmetry of the functionξ(λ) (see Eq. 12; Fig. 6) and the real part of the refractive index n(λ) (see Eq. 4; Fig. 4). Toward larger particle diameters, the peak of the mass absorption efficiency is lowered and broadened due to incomplete light penetration of the particle, where a decreasing particle volume fraction contributes to the absorption. In addition, the peak is shifted above the res-onance wavelength, where in the geometric optics interpre-tation (x≫1), the Fresnel reflectivity is reduced and more light penetrates the sphere to be absorbed (Moosm¨uller and Arnott, 2009).
Using Eq. (2), the AAC spectra of these spherical parti-cles can be calculated readily from the absorption coefficient spectra used for Fig. 7. Results are shown in Fig. 8 together with the AAC for bulk matter. Interpretation of these AAC spectra is closely related to interpretation of the mass absorp-tion efficiencyEabsspectra in Fig. 7 discussed above and fo-cuses on the region above the resonance wavelength that is of most practical importance. Spectra for the particle diameter of 0.01 µm are in excellent agreement with those for the fine particle limit discussed in the previous section (Small Spher-ical Particles). With increasing particle size, the AAC peak above the resonance wavelength is lowered, broadened, and shifted toward longer wavelengths until it disappears for a particle diameter between 1 and 10 µm and is replaced by a monotonic increase of AAC above the resonance wavelength as seen for a particle diameter of 10 µm. We are not aware of any experimental determination of the AAC spectrum for BrC particles in this size range.
4 Conclusions
The concept of wavelength-dependent AACs has been clar-ified including the description and mathematical connection of single- and two-wavelength AACs among each other and to absorption spectra. These concepts can be applied to noisy experimental and theoretical data by utilizing theo-retical or empirical spectral models. We applied this dis-cussion of wavelength-dependent AACs to models of BrC bulk absorption spectra including the damped simple har-monic oscillator model, its Lorentzian approximation, and the band-gap model with and without Urbach tail. The sim-ple harmonic oscillator model yields bulk AAC spectra that are physically reasonable and in qualitative agreement with experimental observations and yield AACs≥2, well above the resonance wavelength. The band-gap model without Ur-bach tail yields AACs monotonically increasing with wave-length, in qualitative disagreement with experimental obser-vations, and diverging toward infinity at the band-gap wave-length. While the addition of an Urbach tail truncates this divergence, yielding a monotonic increase of AAC below and a monotonic decrease above the matching wavelength between band-gap and Urbach-tail models. This instanta-neous change in AAC slope corresponds to an unphysical discontinuity of the first derivative of the AAC spectrum at the matching wavelength and makes the use of the band-gap model with and without Urbach tail questionable for the de-scription of BrC AAC spectra.
The use of complex refractive indices obtained from the bulk damped simple harmonic oscillator model for calcula-tion of absorpcalcula-tion and AAC spectra for spherical BrC parti-cles results in prediction of a monotonic decrease of the AAC with wavelengths well above the resonance wavelength for small particles but of a monotonic increase for large parti-cles. While the decrease for small particles is commonly ob-served, we are not aware of corresponding observations for large particles.
absorption at shorter wavelengths, to quantify their absorp-tion spectra, and to thereby relate the purely optical definiabsorp-tion of BrC to its chemistry.
Acknowledgements. This material is based upon work
sup-ported by NASA EPSCoR under Cooperative Agreement No. NNX10AR89A, by NASA ROSES under Grant NNX11AB79G, by the National Science Foundation under Cooperative Support Agreement No. EPS-0814372 and under Major Research In-strumentation Grant AGS-1040046, and by the Desert Research Institute.
Edited by: V. F. McNeill
References
Andreae, M. O. and Gelencs´er, A.: Black carbon or brown car-bon? The nature of light-absorbing carbonaceous aerosols, At-mos. Chem. Phys., 6, 3131–3148, doi:10.5194/acp-6-3131-2006, 2006.
˚
Angstr¨om, A.: On the Atmospheric Transmission of Sun Radiation and on Dust in the Air, Geogr. Ann., 11, 156–166, 1929. Bergstrom, R. W., Pilewskie, P., Russell, P. B., Redemann, J., Bond,
T. C., Quinn, P. K., and Sierau, B.: Spectral absorption proper-ties of atmospheric aerosols, Atmos. Chem. Phys., 7, 5937–5943, doi:10.5194/acp-7-5937-2007, 2007.
Bohren, C. F. and Huffman, D. R.: Absorption and Scattering of Light by Small Particles, Wiley, New York, xiv, 530 pp., 1998. Bond, T. C.: Spectral Dependence of Visible Light Absorption by
Carbonaceous Particles Emitted from Coal Combustion, Geo-phys. Res. Lett., 28, 4075–4078, 2001.
Chakrabarty, R. K., Moosm¨uller, H., Chen, L.-W. A., Lewis, K., Arnott, W. P., Mazzoleni, C., Dubey, M. K., Wold, C. E., Hao, W. M., and Kreidenweis, S. M.: Brown carbon in tar balls from smoldering biomass combustion, Atmos. Chem. Phys., 10, 6363–6370, doi:10.5194/acp-10-6363-2010, 2010.
Chen, Y. and Bond, T. C.: Light absorption by organic carbon from wood combustion, Atmos. Chem. Phys., 10, 1773–1787, doi:10.5194/acp-10-1773-2010, 2010.
Demtr¨oder, W.: Laser Spectroscopy: Basic Concepts and Instru-mentation, 3 ed., Springer Verlag, Berlin, Heidelberg, New York, 380 pp., 2003.
Flowers, B. A., Dubey, M. K., Mazzoleni, C., Stone, E. A., Schauer, J. J., Kim, S.-W., and Yoon, S. C.: Optical-chemical-microphysical relationships and closure studies for mixed car-bonaceous aerosols observed at Jeju Island; 3-laser photoa-coustic spectrometer, particle sizing, and filter analysis, Atmos. Chem. Phys., 10, 10387–10398, doi:10.5194/acp-10-10387-2010, 2010.
Gyawali, M., Arnott, W. P., Lewis, K., and Moosm¨uller, H.: In situ aerosol optics in Reno, NV, USA during and after the sum-mer 2008 California wildfires and the influence of absorbing and non-absorbing organic coatings on spectral light absorption, At-mos. Chem. Phys., 9, 8007–8015, doi:10.5194/acp-9-8007-2009, 2009.
Hecobian, A., Zhang, X., Zheng, M., Frank, N., Edgerton, E. S., and Weber, R. J.: Water-Soluble Organic Aerosol material and the light-absorption characteristics of aqueous extracts measured over the Southeastern United States, Atmos. Chem. Phys., 10, 5965–5977, doi:10.5194/acp-10-5965-2010, 2010.
Lack, D. A. and Cappa, C. D.: Impact of brown and clear carbon on light absorption enhancement, single scatter albedo and ab-sorption wavelength dependence of black carbon, Atmos. Chem. Phys., 10, 4207–4220, doi:10.5194/acp-10-4207-2010, 2010. Lewis, K., Arnott, W. P., Moosm¨uller, H., and Wold, C. E.:
Strong Spectral Variation of Biomass Smoke Light Absorption and Single Scattering Albedo Observed with a Novel Dual-Wavelength Photoacoustic Instrument, J. Geophys. Res., 113, D16203, doi:10.1029/2007JD009699, 2008.
Lilienfeld, P.: Gustav Mie: The Person, Appl. Opt., 30, 4696–4698, 1991.
Liu, L., Mishchenko, M. I., and Arnott, W. P.: A Study of Radiative Properties of Fractal Soot Aggregates Using the Superposition T-Matrix Method, J. Quant. Spectrosc. Ra., 109, 2656–2663, 2008. Mie, G.: Beitr¨age zur Optik tr¨uber Medien, speziell kolloidaler
Metall¨osungen, Ann. Physik, 330, 377–445, 1908.
Mishchenko, M. I.: Scale Invariance Rule in Electromagnetic Scat-tering, J. Quant. Spectrosc. Ra., 101, 411–415, 2006.
Mishchenko, M. I. and Travis, L. D.: Gustav Mie and the Evolv-ing Discipline of Electromagnetic ScatterEvolv-ing by Particles, B. Am. Meteor. Soc., 89, 1853–1861, 2008.
Moosm¨uller, H. and Arnott, W. P.: Particle Optics in the Rayleigh Regime, J. Air Waste Manage. Assoc., 59, 1028–1031, 2009. Moosm¨uller, H., Chakrabarty, R. K., and Arnott, W. P.: Aerosol
Light Absorption and its Measurement: A Review, J. Quant. Spectrosc. Ra., 110, 844–878, 2009.
Russell, P. B., Bergstrom, R. W., Shinozuka, Y., Clarke, A. D., De-Carlo, P. F., Jimenez, J. L., Livingston, J. M., Redemann, J., Dubovik, O., and Strawa, A.: Absorption Angstrom Exponent in AERONET and related data as an indicator of aerosol com-position, Atmos. Chem. Phys., 10, 1155–1169, doi:10.5194/acp-10-1155-2010, 2010.
Schuster, G. L., Dubovik, O., and Holben, B. N.: Angstrom Expo-nent and Bimodal Aerosol Size Distributions, J. Geophys. Res., 111, D07207, doi:10.1029/2005JD006328, 2006.
Sun, H. L., Biedermann, L., and Bond, T. C.: Color of Brown Carbon: A Model for Ultraviolet and Visible Light Absorption by Organic Carbon Aerosol, Geophys. Res. Lett., 34, L17813, doi:10.1029/2007GL029797, 2007.
Tauc, J., Grigorovici, R., and Vancu, A.: Optical Properties and Electronic Structure of Amorphous Germanium, Phys. Stat. Sol., 15, 627–637, 1966.