Article
J. Braz. Chem. Soc., Vol. 26, No. 3, 458-465, 2015. Printed in Brazil - ©2015 Sociedade Brasileira de Química 0103 - 5053 $6.00+0.00
A
*e-mail: [email protected]; [email protected]
Improving Natural Biopolymeric Membranes Based on Chitosan and Collagen for
Biomedical Applications Introducing Silver
Camelia Ungureanu,a Daniela Ioniţă,*,a Elena Berteanu,b Luminiţa Tcacenco,b Adina Zuavb and Ioana Demetrescua
aUniversity POLITEHNICA of Bucharest, 1-7 Polizu, 011061 Bucharest, Romania
bThe National Institute of Research and Development for Biological Sciences,
Splaiul Independenţei nr. 296, sector 6, cod 060031, C.P. 17-16, Bucharest, Romania
The aim of this study was to obtain new films based on collagen-chitosan with and without silver for biomedical applications. Membranes with a thin transparent elastic structure were obtained and after immersion in silver nitrate new membranes with silver have been elaborated and their physicochemical properties were assessed using infrared spectroscopy as well as contact angle determinations, and sorption properties. The water absorption has permitted the evaluation of the diffusion coefficient for modified collagen membranes and the values were comparable with diffusion coefficient specific for human cornea. Adsorption and desorption studies of silver ions were investigated based on the concentration of the silver solution. This concentration was determined by an inductively coupled plasma spectrometer. Antimicrobial investigations performed on Gram-negative Escherichia coli andGram-positive Staphylococcus aureus bacteria and hemolytic properties assays have been evaluated measuring optical density. The enhancement of antibacterial activity of membranes with silver content was emphasized.
Keywords: adsorption, bioengineering, biomaterials, collagen, chitosan
Introduction
In the polymeric scaffolds for tissue regeneration domain, polymeric drugs and pro-drug systems, drug delivery and targeted delivery systems, with unique properties for bioapplications has been widely investigated in the last decade. Patients with thick skin injuries and cartilage-associated diseases need biomaterials for wound healing.1 Implant associated infections often limit the use of
biomaterials, thus, novel biopolymeric materials possessing antimicrobial activity provide the best solution to ensure a bacteria-free implant site. In this regard, chitosan, a natural biopolymer with inherent characteristics such as bio-degradability, bio-compatibility, antimicrobial, antiviral and immune-adjuvant properties could be a good choice for hybrid based materials.2,3 This biopolymer has received
considerable attention in bone tissue engineering,4,5 due
to its chance of synergetic effect in various combinations. Chitosan (CS) has numerous pharmacological advantages, such as serum cholesterol-lowering, antimicrobial (chitosan films exhibit significant antimicrobial activity6 against
molds, yeasts, Gram-positive and Gram-negative bacteria), and wound healing-promoting properties;7 it is a natural
biopolymer derived from deacetylation of chitin (a polysaccharide that is the major component in the shells of crustaceans and of fungal cell wall).8
CS is a natural environmentally friendly material found in various hybrid compounds. It is a biocompatible and biodegradable biomaterial used to enlarge effectiveness in drug delivery systems. As a scaffold material, collagen sponges have been considered the most popular 3D scaffolds for tissue regeneration because of their excellent biocompatibility and biodegradability; collagen has remarkable mechanical properties such as tensile strength, being one of the long fibrous structural proteins that gives cells structure from the outside and provides strength to various structures of the body and to various collagen-based biomaterials.9 Collagen sponges are safe and
well-characterized supports for drug delivery.10 Comparing the
biocompatibilities and biodegradation rates of the CS and collagen sponges during implantation,11 the CS sponge
known advantage is preventing the spreading of pathogenic microorganisms and cancerous cells.12
Therefore, it may be important to develop collagen blends with CS to create more suitable biomimetic microenvironments for cells.
The antibacterial property of collagen based materials could be enhanced by adding silver nanoparticles.13,14 In
the last decade, the use of silver for antimicrobial wound care is very interesting. Moreover, silver was also proven to have other effects on the wound, which in turn facilitates wound healing.15
The present paper presents a novel use of collagen materials using modified membranes with CS (in various proportions) and silver ions to improve bioperformance. Therefore, it is useful to design novel biopolymeric compounds that possess intrinsic antibacterial activity, which contains collagen, CS and silver.
Experimental
Type-I collagen of bovine origin was provided by The National Institute of Research and Development for Biological Sciences. CS, with a degree of deacetylation of about 80%, was purchased from Sigma-Aldrich Co. All the chemicals used in this work were of analytical grade and water was distilled.
We used six types of membranes: membranes with collagen gel, membranes with collagen-chitosan gel (1:1), membranes with collagen-chitosan gel (1:2), membranes with collagen gel and silver, membranes with collagen-chitosan gel (1:1) and silver and finally, membranes with collagen-chitosan gel (1:2) and silver.
Preparation of collagen-chitosan-silver films
A gel of undenatured collagen was prepared with the molecular mass 250000-300000 Da. It was obtained from bovine Achilles tendon through an extraction procedure using a solution of dilute acetic acid.
CS solutions were prepared by dissolving CS powder in 1% acetic acid to reach the mass concentration of 4 kg m−3.
The solution was stirred overnight on a magnetic stirrer to dissolve CS.
The solution was processed at 4 °C for 48 h with the following content: 12% undenatured collagen, 64% distilled water, 24% ethanol, pH 5.5. The biopolymeric membranes used in this study had the following composition: (a) 20 mL collagen (pH 5.5), (b) collagen:chitosan 1:1 (pH 6.2) and (c) collagen:chitosan 1:2 (pH 5.1).
Each composition was mixed for 5 min, left for 15 min and then poured in Petri dishes. The dishes were
previously greased with glycerine in order to facilitate the membrane unfolding. The compositions were left to dry in the oven at 37 °C, for 48-72 h. Membranes with a thin transparent elastic structure were obtained. The biopolymericmembranes with silver content were obtained by immersion of the simple membranes in the solution of 0.001 mol L−1 silver nitrate for 24 h, followed by drying at
room temperature.
FTIR analysis
Fourier transform infrared spectroscopy (FTIR) was performed using a Perkin Elmer Spectrum 100 FTIR spectrophotometer in the attenuated total reflection mode, on the spongious materials, in order to detect the presence of bonds between CS and collagen as well as the structural changes. For comparison, a collagen scaffold was also analyzed.
Water absorption analysis
Water absorption was evaluated as previously described.16,17
Spongious materials with and without CS were weighted, and after immersion in water, at different time intervals until a stable mass was obtained.
The percentage of water absorbed in spongious materials was evaluated by using the following equation:
Wa (%) = (Wt − W0) / W0 × 100 (1)
where Wtand W0 are the weights of sample at time (t)and
the dry state at23 °C, respectively.
The rates of water absorption were obtained using the Fick’s law of diffusion.18
At an early stage, the diffusion process is presented as follows:
Mt / M∞ = 2 (Dt/π l2)1/2 (2)
where Mtis the mass gain at time t, M∞ is the mass gain
at equilibrium, lis the thickness of the specimen, and Dis the diffusion coefficient.
Contact angle measurements
The contact angle of a drop of water with the films surface was measured as previously described17,19 with
contact angle of a drop of water deposited on the film surface. Each contact angle value is the mean value of 5 measurements. The investigation was carried out with an accuracy of ± 1° at a temperature of 25 °C.
Adsorption and desorption studies of silver ions
1 g of membrane was used for adsorbing Ag+ ions
in 100 mL of Ag+ solution (170 mg L−1) at pH 5. The
concentration of the silver solution was determined by an inductively coupled plasma spectrometer (ICP-MS,Perkin Elmer ELAN DRC-e). The adsorbed Ag+ concentration
was obtained from the difference between total initial Ag+
concentration and finally detected Ag+ concentration. The
amount of Ag+ ions sorption onto all membranes can be
calculated20 by:
e
c – c
i fq =
×V
m
(3)where qe is the silver adsorbed onto the membrane (mg g
−1);
ci is the initial silver concentration (mg L
−1); c
f is the final
silver ion concentration in the solution (mg L−1), V is the
volume of the solution (L). All experiments were repeated three times. The desorption experiments were carried out using phosphate buffer solution (PBS) at room temperature. 1 g of collagen modified membranes were placed in 20 mL PBS and stirred continuously (at stirring rate of 600 rpm) during the whole experiment. The Ag+ concentration
in the aqueous phase was determined by ICP-MS at 0.5, 1, 3, 6, 12 and 24 h.
Evaluation of antibacterial activity
The antibacterial activity of the samples was tested against Escherichia coli (ATCC 8738) and Staphylococcus aureus (ATTC 25923)bacteriafrom American Type Culture Collection. Common causes of implant-associated infections are firstly Staphylococcus aureus and Escherichia coli
bacteria. Our choice was these two bacteria because recently Escherichia coli became more investigated having new forms and Staphylococcus aureus is the commonest cause of SSTI (skin and soft tissue infections).
The majority of the studies on antibacterial samples rely on the calculation of the percentage inhibition of growth. The bacterial strains weregrown in a tube containing Luria Bertani (LB) medium as reported recently by Ansari et al.21 at 37 °C (LB medium composition: peptone
(Merck), 10 g L−1; yeast extract (Biolife) 5 g L−1, NaCl
(Biolife) 5 g L−1) and were inoculated individually and
kept at 37 °C overnight in a shaker incubator (Laboshake Gerhardt) at 150 rpm.
For the solid culture, bacterial strain was grown overnight on LBA (LB medium + agar (Fluka) 20 g L−1)
plates at 37 °C before being used. The stock culture was maintained at 4 °C.
To examine the bacterial growth in liquid broth, inoculations had been made from fresh colonies on LB plates.
The culture was obtained from a volume of 10 mL sterile culture medium. The sterile medium was inoculated with 0.1 mL of bacterium strain(1%). Once obtained, 1 mL of culture were placed over the samples.
All the test tubes were put on rotatory shaker Laboshake Gerhardt (150 rpm) and incubated at 37 °C. Control broths were used without samples. The bacterial growth was determined by measuring optical density after 18 h of incubation, at 600 nm using UV-Vis spectrophotometer (Jenway Spectrophotometer). Bacterial growth were quantified and compared to bacteria grown in the absence of composites materials. In this study, triplicate plates were prepared for each sample.
The antibacterial activities of modified collagen membranes (the size of samples for microbiological tests was 0.5 cm2) were determined by calculating the percentage
inhibition of growth as previously described.22
Haemolysis assay
In order to use the biopolymeric membranes in the context of biomedical applications, it is necessary to analyze the hemolytic properties of these materials. This key requirement was evaluated by conducting a haemolysis assay as described in American Society for Testing and Materials (ASTM F 756-00, 2000). Measuring hemolytic activity is important, as it is an indicator of cytotoxicities. Haemolysis is measured by determining the free haemoglobin (Hb) released into the surrounding media in relation to the total Hb contained in the unit. Membrane disruption is detected in red blood cells as release of Hb in the cell medium, which can be assessed spectrophotometrically. Due to the high molar extinction coefficient of Hb, the assay can be performed on a small amount of both the red blood cells and the test compounds, which might be available only in small quantities.
In this study, Hb was estimated by Drabkin’s method7
in samples collected by venepuncture.
The experiment was done in triplicate and percentage haemolysis was calculated using the following formula:
H% = (ODs − ODnc)/(ODpc + ODnc) × 100 (4)
where: ODs is the optical density for a single sample; ODnc
density for positive control; the haemoglobin released by haemolysis was measured by the OD of the supernatants at 540 nm using a spectrophotometer.
Results and Discussion
FTIR analysis
FTIR provides supplementary information regarding the structure of collagen-chitosan film. All spectra ranging from 4000 to 600 cm−1were recorded. Figure 1 shows
FTIR spectra for CS and collagen-chitosan samples. Collagen spectrum was also obtained and included in Figure 1 in order to identify possible interactions between the two polymers in the blend samples. According to the literature,23-25 the interactions between collagen and
CS may occur by hydrogen bonds formation or by the formation of polyanion-polycation complex. The FTIR literature investigations24 also pointed out the presence of
a novel hydrogen bonding in the CS interactions and the possibility that the collagen in the complexes is denatured. Gelation of collagen is a competitor depending of pH and CS content.26 CS content is responsible as well for the
shift of the –OH group, the –NH2 group and the amide I,
II and III characteristic absorption bands in FTIR spectra of nanostructured collagen and CS blends.27
For the collagen membranes, five characteristic absorption bands at the frequencies of 3439, 3324, 1659, 1550, and 1274 cm−1 could be observed. Collagen displayed
mainly bands at 1659, 1550 and 1274 cm−1, characteristic
of the amide I, II and III bands, respectively. Generally, amide I bands (1659 cm−1) originated from C=O stretching
vibrations coupled to N–H bending vibrations. The
amide II bands (1550 cm−1) arise from the N–H bending
vibrations coupled to C–N stretching vibrations. The amide III represented the combination peaks between N–H deformation and C–N stretching vibrations. The other two bands, arising from the stretching vibrations of N–H group in free appeared at 3324 cm−1 and the vibrations of hydroxyl
group, –OH, appeared at 3440 cm−1.
In the CS spectrum, the vibrations of hydroxyl and free amine groups appeared at 3439 and 3300 cm−1. The
absorption bands at 1655, 1560, and 1381 cm−1 indicated
C=O stretching, –NH2 bending, and C–O stretching of
primary alcohol groups, respectively and at 1152 cm−1
represented -C-O-C-glycosidic linkage between CS monomers. Additionally, bands at 2834 and 1441 cm−1
were observed, which represent the stretching of –CH3 and
pyrrolidine rings, respectively.28,29
FTIR spectra of collagen/chitosan blends at various blending compositions illustrated similar characteristic peaks of the parent molecules. No additional bands were identified. The absence of new bands was confirmed through the subtraction of collagen bands from the blend scaffold spectrum, resulting in a spectrum identical to that of CS.
Collagen’s triple helix integrity can be evaluated1 by
the ratio between the absorbance at 1274 and at 1441 cm−1,
which for intact structures is around 1. In our experiment for the blend samples, the value obtained was 1.1 and this value indicatesthat the addition of CS did not disestablish collagen’s triple helix. This is an important feature, for this structure is considered to be responsible with the collagen’s biological and mechanical properties.1 Taking into account
the complex interactions between CS and collagen and the fact that the principal components analysis (PCA) for IR data examination26 leads to the conclusion that new
hydrogen bonding networks alter the collagen helical character, more experiments need to be done in the future at various pH and CS content.
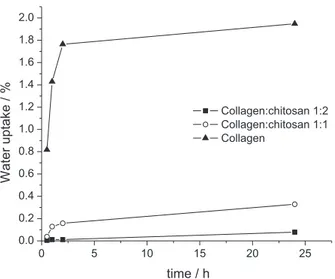
Water absorption
The behavior of water absorption of biopolymeric membranes is presented in Figure 2.
The data was plotted as Mt/M∞ against t1/2, and the
diffusion coefficients (Table 1) were obtained from the initial part of the curves.
Due to the CS, the network of composite membranes becomes denser compared with collagen membranes. Diffusion coefficient obtained for modified collagen membranes are comparable with diffusion coefficient specific for human cornea.30 We have observed (Table 1)
that increased CS content significantly reduces the diffusion coefficient.
Contact angle measurements (CA)
Controlling surfaces wettability8 with contact angle
measurements is intensively studied for understanding cell growth and proliferation of biomaterials for tissue engineering.31
These data can be used to estimate the surface tension of the solid. Calculations based on these measurements produce a parameter (surface tension, surface free energy (SFE) etc.), which quantifies the characteristic of the solid surface and its wettability.
A vital feature of CS films and biomaterials in general is SFE. The contact angle of the substrates is directly related to the surface free energy.
Also, fibroblast collagen synthesis was found to reach a maximum on surface free energy larger than 55 mJ m−2.32
The wettability expressed by the contact angle of the surface to the water, is an important property of materials that find their application in the domain of biomaterials. For the synthesized films, the contact angle for a drop of water deposed on the film surface were measured and the recorded values are presented in Table 2.
These results are according with the water absorbance values and diffusion coefficient values previously studied;33
the high values of these two parameters determined small values of contact angle (< 90o), which represent a good
hydrophilic character, important in selecting the best biomaterial devoted to proliferation and cell growth.
Adsorption and desorption studies of silver ions
The adsorption process of silver on all membranes is an exothermic process.
Adsorption of Ag+ ions into all studied membranes is
presented in Figure 3.
As expected, the amount of silver adsorbed was higher when the amount of CS in the membranes was increased, due to the fact that the surface was enriched with –OH functional groups. Within the first 5 h, a rapid silver adsorption was observed. After this period, the sorption decelerated and reached the equilibrium approximately after 12 h for collagen and collagen:chitosan 1:1 and after 7 h for collagen:chitosan 1:2.
The spontaneity of adsorption process is given by the thermodynamic parameters named Gibbs free energy (∆G). The Gibbs free energy change of the process is related to the Kc by the following equation:34
∆G = –RTlnKc (5)
0 5 10 15 20 25
0.0 0.2 0.4 0.6 0.8 1.0 1.2 1.4 1.6 1.8 2.0
W
a
te
r
uptak
e
/
%
time / h
Collagen:chitosan 1:2 Collagen:chitosan 1:1 Collagen
Figure 2. Water uptake as a function of CS content of biopolymeric membranes.
Table 1. Diffusion coefficient in water for biopolymeric membranes with different composition
Sample/composition D × 10−7 / (cm2 s−1)
Collagen 6.633
Collagen:chitosan 1:1 1.535
Collagen:chitosan 1:2 1.065
Table 2. Contact angle values for biopolymeric membranes with different composition
Sample/composition CA / degree SFE / (mJ m−2)
Collagen 68.4
68
41.5 42 Collagen:chitosan 1:1 73.2
73
48.7 49 Collagen:chitosan 1:2 75.8
76
50.7 51
0 5 10 15 20 25
50 55 60 65 70 75 80 85 90 95
Amount
of
Ag
+ absorbed
/
(mg
g
-1 )
Adsorption time / h
Collagen
Collagen:chitosan 1:1 Colagen:chitosan 1:2
a c
e c K
c
= (6)
where Kc is the distribution coefficient for the adsorption,
ca is the concentration of adsorbate adsorbed on the
adsorbent at equilibrium (mg L−1) and c
e is the equilibrium
concentration of solution (mg L−1).
The value of Gibbs free energy for all Ag+ adsorption
process is given in Table 3.
The negative values of the Gibbs free energy indicate the feasibility and spontaneity of the adsorption process of Ag+ ions on collagen and collagen modified membrane.
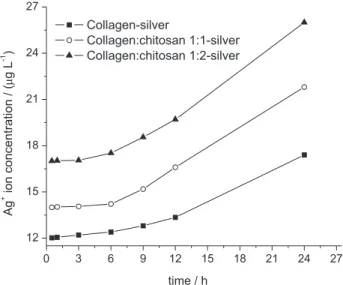
The relation between the silver ions released concentration versus time from modified membranes is presented in Figure 4.
It is observed that the Ag+ release increases as a function
of time. Silver ionization and release are dependent on water uptake.35 For the first 4-6 h, the rate of Ag+ ion
release is lower. Also, the water diffusion is lower during this period of time.
Experimental studies suggest that concentrations of 60 ppm Ag+ should be sufficient to control the majority of
bacterial and fungal, while having no toxic effect towards human fibroblasts.36
Evaluation of antibacterial activity
The antimicrobial investigations were performed on Gram-negative (Escherichia coli) bacterium and on Gram-positive (Staphylococcus aureus) bacterium.
This way, the samples have undergone an antibacterial activity evaluation.
However, the percentage inhibition of growth (Figure 5) presents an important increase for samples with silver compared to the control sample.
CS has antibacterial activity against a broad range of bacteria including Gram-negative bacteria like
Escherichia coli.37 The amine group plays an important
role in the antibacterial mechanism of CS.
It has also been shown that when silver treatment is combined with other antimicrobial agents such as UV light, CS, or some natural compound, a synergistic effect is observed.38
We observed that when treated with Ag+, E. coli, a
Gram-negative bacterium, sustained more structural damages than the Gram-positive S. aureus. As is well known, Gram-positive bacteria were much more difficult to destroy due to the more complicated cell wall structure consisting of several layers of peptidoglycan, which are thicker than Gram-negative bacteria, the last one being relatively thin and composed of a single peptidoglycan layer.39
It is possible that silver ions get access to the interior of cells through transmembrane proteins, whose normal function is to transport ions other than silver ions. This proves that there are ways for silver to be transported across the cell membrane even though specific silver transporters may not exist.40
Another one of the suggested mechanisms of the antimicrobial activity of silver was proposed by Klueh et al.41 It was proposed that Ag+ enters the cell and
intercalates between the purine and pyrimidine base pairs Table 3. Thermodynamic parameter for Ag adsorption
Sample/composition Kc ∆G / (J mol
−1)
Collagen 1.72
1.7
−1342.19
−1314
Collagen:chitosan 1:1 1.25 1.3
−552.23
−650
Collagen: chitosan 1:2 1.01 1.1
−24.64
−236
0 3 6 9 12 15 18 21 24 27
12 15 18 21 24 27
Ag
+ ion
concentration
/
(
µ
g
L
-1 )
time / h Collagen-silver
Collagen:chitosan 1:1-silver Collagen:chitosan 1:2-silver
Figure 4. Cumulative Ag+ ion release in PBS as a function of time.
0 20 40 60 80 100 120
Collagen Collagen-silver Collagen:chitosan 1:1 Collagen:chitosan 1:1 - silver Collagen:chitosan 1:2 Collagen:chitosan 1:2 - silver
Percentage inhibition of growth / %
S. aureus E. coli
disrupting the hydrogen bonding between the two anti-parallel strands and denaturing the DNA molecule.41
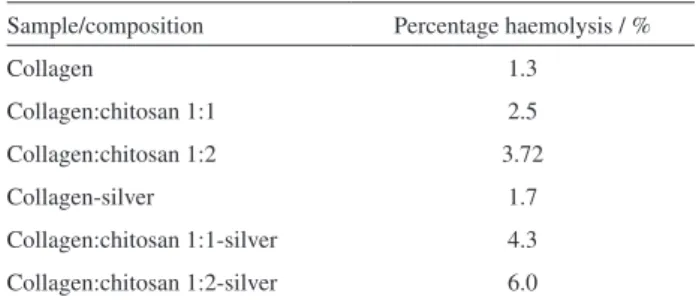
Haemolysis assay
Haemolysis is regarded as an especially significant screening test, once it provides quantification. According to ASTM F 756-00, materials can be classified in three different categories according to their percentage haemolysis (%). Materials with percentages of haemolysis over 5% are considered haemolytic; while the ones with haemolytic index between 5% and 2% are classified as slightly haemolytic. Finally, when the material presents a haemolysis percentage below 2%, it is considered as a nonhaemolytic material.
All results (Table 4) are the average of triplicate samples.
In accordance with the literature data,42 the presence
of CS in membrane promotes surface-induced hemolysis. In this study, it was observed an increase in hemolysis (indicating red blood cell destruction) induced by high concentrations of Ag+ adsorbed on collagen modified
membrane after direct contact with human blood, possibly caused by membrane destruction.43
Conclusions
This paper presented a method for elaborating and characterizing collagen-chitosan membranes with different collagen-chitosan mass ratios, with and without silver. The biopolymeric membranes were characterized by FTIR analysis, water adsorption, contact angle, silver adsorption and hemolytic tests.
We have observed that increased CS content significantly reduced diffusion coefficient, which finally have the values comparable with diffusion coefficient specific for human cornea.
The antibacterial activity assays performed with the Escherichia coli and Staphylococcus aureus strains
showed that all the three silver loaded collagen-chitosan films have bactericidal action, which is more evident in the
Escherichia coli case.
There is a need of future experiments in order to characterize completely the obtained membranes to be used in bioapplications. This is going to be done after finding a compromise between silver content, which introduces bactericidal effect and membranes biocompatibility.
References
1. Tohni, E.; Plepis, A. M. G.; Quim. Nova2002, 25, 943. 2. Paula, H. C. B.; Sombra, F. M.; Abreu, F. O. M. S.; De Paula,
R. C. M.; J. Braz. Chem. Soc. 2010, 21, 2359.
3. Williams, G. I.; Wool, R. P.; Appl. Compos. Mater.2000, 7, 421.
4. Khor, E.; Lim, L.Y.; Biomaterials2003, 24, 2339.
5. Zhang, Y.; Ni, M.; Zhang, M.; Ratner, B.; Tissue Eng. 2003, 9,
337.
6. Sadeghi-Kiakhani, M.; Arami, M.; Gharanjig, K.; Iran. Polym. J.
2013, 22, 931.
7. Takechi, M.; Miyamoto, Y.; Ishikawa, K.; Yuasa, M.; Nagayama, M.; Kon, M.; Asaoka, K.; J. Mater. Sci.: Mater. Med. 1996, 7, 317.
8. Joerger, R. D.; Packag. Technol. 2007, 20, 231.
9. Ramshaw, J. A. M.; Werkmeister, J. A.; Glattauer, V.; Biotechnol. Genet. Eng. Rev.1996, 13, 335.
10. Rao, K. P. J.; J. Biomater. Sci., Polym. Ed. 1995, 7, 623. 11. Wang, X.; Yan, Y.; Zhang, R. J.; J. Bioact. Compat. Polym. 2006,
21, 39.
12. Ruszczak, Z.; Friess, W.; Adv. Drug Delivery Rev. 2003, 55, 1679.
13. Prodana, M.; Ionita, D.; Ungureanu, C.; Bojin, D.; Demetrescu, I.;
Dig. J. Nanomater. Bios. 2011, 6, 549.
14. Ionita, D.; Grecu, M.; Ungureanu, C.; Demetrescu, I.; Appl. Surf. Sci. 2011, 257, 9164.
15. Atiyeh, B. S.; Costagliola, M.; Hayek, S. N.; Dibo, S. A.; Burns 2007, 33, 139.
16. Mao, J. S.; Liu, H. F.; Yin, Y. J.; Yao, K. D.; Biomaterials2003,
24, 1621.
17. Tihan, T. G.; Ionita, M. D.; Popescu, R. G.; Iordachescu, D.;
Mater. Chem. Phys. 2009, 118, 265.
18. Pascual, B.; Gurruchaga, M.; Ginebra, M. P.; Gil, F. J.; Planell, J. A.; Gonĩ, I.; Biomaterials1999, 20, 465.
19. Tihan, G.; Minkovska, S.; Giurginca, M.; Tite, T.; Iovu, H.; Demetrescu, I.; Mol. Cryst. Liq. Cryst.2008, 486, 1217. 20. Mishra, V.; Balomajumder, C.; Agarwal, V. K.; Water, Air, Soil
Pollut. 2010, 211, 489.
21. Ansari, M. A.; Khan, H. M.; Khan, A. A.; Malik, A.; Sultan, A.; Shahid, M.; Shujatullah, F.; Azam, A.; Biol. Med. 2011, 3, 141.
Table 4. The values of percentage haemolysis obtained for all membranes
Sample/composition Percentage haemolysis / %
Collagen 1.3
Collagen:chitosan 1:1 2.5
Collagen:chitosan 1:2 3.72
Collagen-silver 1.7
Collagen:chitosan 1:1-silver 4.3
22. Barbinta-Patrascu, M. E.; Ungureanu, C.; Iordache, S. M.; Iordache, A. M.; Bunghez, I. R.; Ghiurea, M.; Badea, N.; Fierascu, R. C.; Stamatin, I.; Mater. Sci. Eng., C.2014, 39, 177. 23. Taravel, M. N.; Domard, A.; Biomaterials 1993, 14, 930. 24. Domard, A.; Taravel, M. N.; Biomaterials 1995, 16, 865. 25. Taravel, M. N.;Domard, A.; Biomaterials 1996, 17, 451. 26. Sionkowska, A.; Wisniewski, M.; Skopinska, J.; Kennedy, C. J.;
Wess, T. J.; Biomaterials 2004, 25, 795.
27. Chen, Z.; Mo, X.; He, C.; Wang, H.; Carbohydr. Polym. 2008, 72, 410.
28. Popescu, R. G.; Morega, A.; Iordachescu, D.; Demetrescu, I.;
Mater. Plast. (Bucharest, Rom.)2009, 46, 140.
29. Sionkowska, A.; Wisniewski, M.; Skopinska, J.; Kennedy, C. J.; Wess, T. J.; J. Photochem. Photobiol., A2004, 162, 545. 30. Liu, Y.; Ren, L.; Yao, H.; Wang, Y.; Mater. Lett. 2012, 87, 1. 31. Aronov, D.; Rosen, R.; Ron, E. Z.; Rosenman, G.; Process
Biochem. 2006, 41, 2367.
32. Tajima, S.; Pinnell, S. R.; J. Invest. Dermatol. 1981, 77, 410. 33. Peppas, N. A.; Principles of Tissue Engineering, Nature,
London, 1997.
34. Sekhar, C. P.; Kalidhasan, S.; Rajesh, V.; Rajesh, N.;
Chemosphere2009, 77, 842.
35. Kumar, R.; Münstedt, H.; Biomaterials2005, 26, 2081. 36. Grade, S.; Eberhard, J.; Wagener, P.; Winkel, A.; Sajti, C. L.;
Barcikowski, S.; Stiesch, M.; Adv. Eng. Mater. 2012, 14, 231. 37. Kong, M.; Chen, X. G.; Xing, K.; Park, H. J.; Int. J. Food
Microbiol. 2010, 144, 51.
38. Silvestry-Rodriguez, N.; Sicairos-Ruelas, E. E.; Gerba, C. P.; Bright, K. R.; Rev. Environ. Contam. Toxicol.2007, 191, 23. 39. Feng, Q. L.; Wu, J.; Chen, G. Q.; Cui, F. Z.; Kim, T. N.; Kim,
J. O.; J. Biomed. Mater. Res.2000, 52, 662.
40. Solioz, M.; Odermatt, A.; J. Biol. Chem. 1995, 270, 9217. 41. Klueh, U.; Wagner, V.; Kelly, S.; Johnson, A.; Bryers, J. D.;
J. Biomed. Mater. Res. 2000, 53, 621.
42. Hirano, S.; Zhang, M.; Nakagawa, M.; Miyata, T.; Biomaterials 2000, 21, 997.
43. Choi, J.; Reipa, V.; Hitchins, V. M.; Goering, P. L.; Malinauskas, R. A.; Toxicol. Sci. 2011, 123, 133.
Submitted: June 3, 2014