ACPD
15, 33755–33788, 2015Vehicular emissions of organic particulate
matter in Sao Paulo, Brazil
B. S. Oyama et al.
Title Page
Abstract Introduction
Conclusions References
Tables Figures
◭ ◮
◭ ◮
Back Close
Full Screen / Esc
Printer-friendly Version
Interactive Discussion
Discussion
P
a
per
|
Discussion
P
a
per
|
Discussion
P
a
per
|
Discussion
P
a
per
|
Atmos. Chem. Phys. Discuss., 15, 33755–33788, 2015 www.atmos-chem-phys-discuss.net/15/33755/2015/ doi:10.5194/acpd-15-33755-2015
© Author(s) 2015. CC Attribution 3.0 License.
This discussion paper is/has been under review for the journal Atmospheric Chemistry and Physics (ACP). Please refer to the corresponding final paper in ACP if available.
Vehicular emissions of organic particulate
matter in Sao Paulo, Brazil
B. S. Oyama1,2, M. F. Andrade1, P. Herckes3, U. Dusek2,4, T. Röckmann2, and
R. Holzinger2
1
Institute of Astronomy, Geophysics and Atmospheric Sciences, University of Sao Paulo, Sao Paulo, Brazil
2
Institute for Marine and Atmospheric Research, University of Utrecht, Utrecht, the Netherlands
3
School of Molecular Sciences, Arizona State University, Tempe, USA
4
Center for Isotope Research, University of Groningen, Groningen, the Netherlands
Received: 30 September 2015 – Accepted: 16 October 2015 – Published: 1 December 2015
Correspondence to: B. S. Oyama (beatriz.oyama@iag.usp.br)
ACPD
15, 33755–33788, 2015Vehicular emissions of organic particulate
matter in Sao Paulo, Brazil
B. S. Oyama et al.
Title Page
Abstract Introduction
Conclusions References
Tables Figures
◭ ◮
◭ ◮
Back Close
Full Screen / Esc
Printer-friendly Version
Interactive Discussion
Discussion
P
a
per
|
Discussion
P
a
per
|
Discussion
P
a
per
|
Discussion
P
a
per
|
Abstract
Vehicular emissions have a strong impact on air pollution in big cities. Many factors affect these emissions: type of vehicle, type of fuel, cruising velocity, and brake use. This study focused on emissions of organic compounds by Light (LDV) and Heavy (HDV) duty vehicle exhaust. The study was performed in the city of Sao Paulo, Brazil,
5
where vehicles run on different fuels: gasoline with 25 % ethanol (called gasohol), hydrated ethanol, and diesel (with 5 % of biodiesel). The vehicular emissions are an important source of pollutants and the principal contribution to fine particulate matter (smaller than 2.5 µm, PM2.5) in Sao Paulo. The experiments were performed in two
tun-nels: Janio Quadros (TJQ) where 99 % of the vehicles are LDV, and Rodoanel Mario
10
Covas (TRA) where up to 30 % of the fleet was HDV. The PM2.5 samples were
col-lected on quartz filters in May and July 2011 at TJQ and TRA, respectively, using two samplers operating in parallel. The samples were analyzed by Thermal-Desorption Proton-Transfer-Reaction Mass-Spectrometry (TD-PTR-MS), and by Thermal-Optical Transmittance (TOT). The organic aerosol (OA) desorbed at TD-PTR-MS represented
15
around 30 % of the OA estimated by the TOT method, mainly due to the different des-orption temperatures, with a maximum of 870 and 350◦C for TOT and TD-PTR-MS, respectively. Average emission factors (EF) organic aerosol (OA) and organic carbon (OC) were calculated for HDV and LDV fleet. We found that HDV emitted more OA and OC than LDV, and that OC emissions represented 36 and 43 % of total PM2.5
20
emissions from LDV and HDV, respectively. More than 700 ions were identified by TD-PTR-MS and the EF profiles obtained from HDV and LDV exhibited distinct features. Nitrogen-containing compounds measured in the desorbed material up to 350◦C con-tributed around 20 % to the EF values for both types of vehicles, possibly associated with incomplete fuel burning. Additionally, 70 % of the organic compounds measured
25
ACPD
15, 33755–33788, 2015Vehicular emissions of organic particulate
matter in Sao Paulo, Brazil
B. S. Oyama et al.
Title Page
Abstract Introduction
Conclusions References
Tables Figures
◭ ◮
◭ ◮
Back Close
Full Screen / Esc
Printer-friendly Version
Interactive Discussion
Discussion
P
a
per
|
Discussion
P
a
per
|
Discussion
P
a
per
|
Discussion
P
a
per
|
compounds with higher volatility, mainly oxygenated (with up to 2 oxygen atoms) and longer chain hydrocarbons than LDV.
1 Introduction
The Metropolitan Area of Sao Paulo (MASP) is composed of 39 municipalities, with a fleet of more than 7 million vehicles (Cetesb, 2014), which nowadays run on three
5
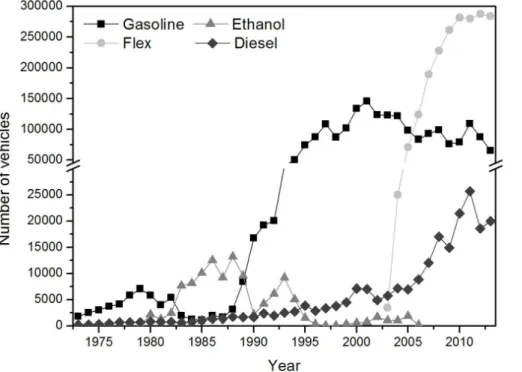
different types of fuel: diesel (with 5 % of biodiesel, shortly referred to as diesel after-wards), hydrated ethanol and gasohol (gasoline with 25 % of ethanol). The number of vehicles has grown more rapidly than the population in the last 15 years. In 2000, the population was around 10 million and the number of vehicles was 0.9 million in the city of Sao Paulo. In 2013, these values increased to 11.4 million and around 4.5 million,
10
respectively (Infocidade, 2015; Cetesb, 2014). Figure 1 presents the evolution of ini-tial registrations of new vehicles in Sao Paulo, classified by fuel usage over the past 40 years (Cetesb, 2014). In 2003, a new vehicle technology was introduced: flex fuel vehicles, which are able to operate on any proportion of ethanol and gasohol.
The implementation of the National Pro Alcohol Program (Proalcool) in Brazil during
15
the 1980s had an important influence on the increase in vehicles running on hydrated ethanol. In the early 1970’s, the ethanol production was not significantly higher than 1 million cubic meters in Brazil. However, due to the Proalcool, this value increased to more than 10 million cubic meters in the mid-1980’s (Stattman et al., 2013). This program stimulated the use of alcohol from sugarcane as fuel in order to decrease the
20
dependence on imported fuel and also to stimulate industrial and agricultural growth (Rico and Sauer, 2015; Stattman et al., 2013). Besides that, between 1973 and 1974 the addition of 10 % of ethanol to gasoline was legally mandated. Also at that time, the hydrated alcohol price was significantly lower than the price for gasoline (64.5 % less) due to governmental incentives (Stattman et al., 2013). Following a governmental
25
ACPD
15, 33755–33788, 2015Vehicular emissions of organic particulate
matter in Sao Paulo, Brazil
B. S. Oyama et al.
Title Page
Abstract Introduction
Conclusions References
Tables Figures
◭ ◮
◭ ◮
Back Close
Full Screen / Esc
Printer-friendly Version
Interactive Discussion
Discussion
P
a
per
|
Discussion
P
a
per
|
Discussion
P
a
per
|
Discussion
P
a
per
|
In the early 1990s the number of vehicles increased substantially due to a political decision of increasing the sales of vehicles to stimulate the economy. Following in-ternational regulations for vehicular emissions, the Program for Controlling Vehicular Emission (PROCONVE) was implemented in the late 1980’s. This program established emission standards for new vehicles with the aim of reducing these emissions
(Szwar-5
cfiter et al., 2005). Despite an increase in the number of vehicles, the program resulted in an improved air quality with lower concentrations of carbon monoxide (CO), sulfur dioxide (SO2) and coarse particles (with diameters between 2.5 and 10 µm), as shown
by (Carvalho et al., 2015). Pérez-Martínez et al. (2014) did not observe a decreasing trend on fine particles (PM2.5) and ozone (O3). On the other hand, Salvo and Geiger
10
(2014) demonstrated that the ozone levels have been decreased by replacing ethanol with gasoline.
In 2004, the National Program of Production and Usage of Biodiesel (PNPB) was cre-ated in order to stimulate the use of biofuels as well as the associcre-ated agricultural ac-tivities for its production. The main motivation was to decrease the dependence on
im-15
ported diesel (Stattman et al., 2013), similar to Proalcool. In the same year, the addition of 2 % of biodiesel to conventional diesel fuel was authorized, but only since 2008 this addition has become mandatory. Until 2010, the percentage has gradually increased to the current 5 % (MME, 2015). Rico and Sauer (2015) and Stattman et al. (2013) dis-cussed in detail the impact of the biodiesel production on agricultural and economical
20
activities. Nowadays, 74.7 % of the biodiesel produced in Brazil is made from soybean oil, 20.4 % from animal fat (mainly bovine), and 4.9 % from other sources (ANP, 2015). The burning of biofuels and fossil fuels causes substantial emissions of Volatile Organic Compounds (VOC) – important precursors of ozone and organic fine parti-cles and Black Carbon (BC) – mainly emitted from the burning of diesel. Andrade
25
et al. (2012) presented the fraction of BC in PM2.5for six Brazilian cities and the values ranged from 15 % in coastal regions to 30 % in urban areas.
ACPD
15, 33755–33788, 2015Vehicular emissions of organic particulate
matter in Sao Paulo, Brazil
B. S. Oyama et al.
Title Page
Abstract Introduction
Conclusions References
Tables Figures
◭ ◮
◭ ◮
Back Close
Full Screen / Esc
Printer-friendly Version
Interactive Discussion
Discussion
P
a
per
|
Discussion
P
a
per
|
Discussion
P
a
per
|
Discussion
P
a
per
|
the concentration and composition of particulate matter (Albuquerque et al., 2012; An-drade et al., 2012; Miranda and AnAn-drade, 2005; Miranda et al., 2002). The distinction between contributions from light duty vehicles (LDV) and heavy duty vehicles (HDV) is still a challenge. Different methods can be used in order to estimate the emissions from the vehicular fleet. Emission factors (EF) for gaseous and particulate compounds have
5
been calculated based on tunnel measurements, and recent results were presented by Pérez-Martínez et al. (2014). The analysis of fine particulate matter (PM2.5) in tunnels was described by Brito et al. (2013). They performed a chemical characterization of PM2.5 by separating the total mass into organic carbon, elemental carbon, and
con-tributions from other trace elements. They concluded that the organic aerosol fraction
10
estimated from OC measurements represented around 40 % of PM2.5emitted by LDV and HDV.
In spite of all the development and studies concerning the composition and sources of aerosols in the area, very few studies have analyzed the organic composition of par-ticulate matter in Sao Paulo. Previous studies estimated the contribution of OC present
15
within the particulate matter in the city of Sao Paulo, as described in Castanho and Artaxo (2001), and Miranda and Andrade (2005). In a more recent study, Albuquerque et al. (2012) attributed a part of the non-explained mass obtained from the mass bal-ance model to OA. In a study performed in 2008, Souza et al. (2014) estimated from OC measurements that around 26 % of the PM2.5was composed of particulate organic
20
matter. Recently, Brito et al. (2013) discussed the aerosol composition including the OC and PAH.
Here, we discuss the composition of OA and EF of condensed organics from LDV and HDV, obtained from aerosol filter samples (PM2.5) collected in traffic tunnels. For
the first time, TD-PTR-MS was applied to samples from Sao Paulo, where hundreds of
25
ACPD
15, 33755–33788, 2015Vehicular emissions of organic particulate
matter in Sao Paulo, Brazil
B. S. Oyama et al.
Title Page
Abstract Introduction
Conclusions References
Tables Figures
◭ ◮
◭ ◮
Back Close
Full Screen / Esc
Printer-friendly Version
Interactive Discussion
Discussion
P
a
per
|
Discussion
P
a
per
|
Discussion
P
a
per
|
Discussion
P
a
per
|
2 Methods
2.1 Field campaigns
The field campaigns were performed at two different tunnels: the first campaign took place in the Janio Quadros tunnel (TJQ), from 4 to 13 May 2011 and a sec-ond campaign was performed in the Rodoanel Mario Covas tunnel (TRA), from 6 to
5
17 July 2011. In a third campaign, daily ambient particle samples were collected dur-ing the Southern Hemisphere Winter from 8 August to 9 September 2012, on the roof of a building on the University of Sao Paulo campus
TJQ is a two-lane tunnel located in the Center of Sao Paulo and characterized mainly by light-duty vehicle (LDV) traffic. The direction of the car traffic in this tunnel alternated
10
twice a day at 6 a.m. and 9 a.m. LT TJQ has a length of 1.9 km, speed limit of 60 km h−1, and a natural wind flow velocity ranging from 1.0 to 4.9 m s−1 during congested and
normal traffic conditions, respectively as described by (Pérez-Martínez et al., 2014). TRA is located on the outskirts of the city on a highway ring. This tunnel is an important alternative route for heavy-duty vehicles (HDV) due to traffic restrictions in the center
15
of Sao Paulo. With a length of 1.7 km and a speed limit of 70 km h−1, the traffic flow is always on four lanes in one direction. Pérez-Martínez et al. (2014) described that the natural flow velocity ranged from 1.0 to 6.1 m s−1during congested and normal traffic
conditions, respectively.
In TJQ, the traffic of vehicles was monitored by cameras and vehicle numbers were
20
obtained by counting from recorded videos. The fleet was classified into four different groups: HDV, LDV, motorcycles and taxis. For this study, the motorcycles and the taxis were considered as LDV, since they use hydrated ethanol or gasohol (see Table 1). The TRA campaign had an automated counting system by weighing vehicles, which sorts the fleet into the two categories LDV and HDV. The other two kinds of vehicles were
25
ACPD
15, 33755–33788, 2015Vehicular emissions of organic particulate
matter in Sao Paulo, Brazil
B. S. Oyama et al.
Title Page
Abstract Introduction
Conclusions References
Tables Figures
◭ ◮
◭ ◮
Back Close
Full Screen / Esc
Printer-friendly Version
Interactive Discussion
Discussion
P
a
per
|
Discussion
P
a
per
|
Discussion
P
a
per
|
Discussion
P
a
per
|
about the traffic of the vehicles during these experiments is shown by Brito et al. (2013) and Pérez-Martínez et al. (2014).
Filter samples were collected at the midpoint of both tunnels. Two samplers were deployed in parallel: a low-volume sampler (Partisol Dichotomous Ambient Particle Sampler, with the sampling rate of 16.6 L min−1) collected simultaneously PM2.5 and
5
PM2.5–10on two different filters (coarse particles, comprising PM10) and a mini-volume
sampler (Airmetrics, with a sampling rate of 5 L min−1), sampled only the PM
2.5fraction.
These samples were collected on pre-heated quartz fiber filters (800◦C, for 12 h), sub-sequently wrapped in aluminum foil (pre-cleaned at 550◦C, for 8 h) and stored inside polyethylene bags in a freezer at−18◦C until analysis.
10
Measurements of carbon monoxide (CO) and carbon dioxide (CO2) were performed
inside and outside the tunnels during the whole campaigns. CO measurements were done with non-dispersive infrared photometry equipment (Thermo Electron 48B). CO2 was measured using a LICOR-6262 instrument inside and a Picarro-G1301 instrument outside the tunnels, as described in detail elsewhere (Pérez-Martínez et al., 2014).
15
Trace gas concentrations were averaged to the filter sampling times. These values as well as the information regarding the samples are summarized in Table 1 and 2. The gaseous concentration was obtained on a hourly base and the average value was calculated for the same period of particulate sample.
In order to calculate emission factors according to Kirchstetter et al. (1999) and
20
Pérez-Martínez et al. (2014), ambient samples were used to determine background concentrations that were subtracted from the inside tunnel concentrations. The venti-lation system in the tunnels brings the air from the outside to the interior, by ventiventi-lation fans on the roof of the tunnel operating continuously to provide fresh air inside. The ambient samples were collected on the roof of the Institute of Astronomy, Geophysics
25
ACPD
15, 33755–33788, 2015Vehicular emissions of organic particulate
matter in Sao Paulo, Brazil
B. S. Oyama et al.
Title Page
Abstract Introduction
Conclusions References
Tables Figures
◭ ◮
◭ ◮
Back Close
Full Screen / Esc
Printer-friendly Version
Interactive Discussion
Discussion
P
a
per
|
Discussion
P
a
per
|
Discussion
P
a
per
|
Discussion
P
a
per
|
a high volume sampler (1.13 m3min−1) for 24 h. 31 filter samples were obtained in to-tal. The analytical methods and data treatment used for these measurements were the same as for the tunnel samples. In order to minimize the effect of meteorological condi-tions, the average concentration over the sampled period was used as the background concentration for both tunnel campaigns.
5
Many studies have been performed concerning the identification of the sources of atmospheric aerosols in Sao Paulo and they have shown that the dominant source of PM2.5 is vehicular emission (Albuquerque et al., 2012; Andrade et al., 2012). These
studies, performed during the Southern Hemisphere wintertime, showed similar be-havior in different years of analysis from 2010 to 2014, in terms of concentration and
10
composition of the PM2.5. The authors performed the identification of these sources
using a multivariate analysis and found that the vehicular emissions explained 60 % of the PM2.5. Furthermore, PM2.5 concentrations from different stations in the city of
Sao Paulo showed similar yearly averages in 2011 and 2012 (Cetesb, 2012, 2013): 25±19 µg m−3. Therefore, the ambient data is considered an adequate background 15
concentration for the EF study.
2.2 Analytical methods
A Proton-Transfer-Reaction Time of Flight Mass-Spectrometer (PTR-ToF-MS, model PTR-TOF8000, Ionicon Analytik GmbH, Austria, referred to as PTR-MS hereafter) was used to perform the analysis of organic compounds on the filters (collected by the low
20
volume sampler, Partisol). Briefly, the PTR-MS uses a soft chemical ionization tech-nique, reducing the fragmentation compared to electron impact ionization. Reactions between protonated water (H3O+) and organic species in the sample lead to mostly
non-dissociative proton transfers, with the advantage that most organic compounds can be detected quantitatively. A detailed discussion on the system, using a quadrupole
25
ACPD
15, 33755–33788, 2015Vehicular emissions of organic particulate
matter in Sao Paulo, Brazil
B. S. Oyama et al.
Title Page
Abstract Introduction
Conclusions References
Tables Figures
◭ ◮
◭ ◮
Back Close
Full Screen / Esc
Printer-friendly Version
Interactive Discussion
Discussion
P
a
per
|
Discussion
P
a
per
|
Discussion
P
a
per
|
Discussion
P
a
per
|
et al. (2010) and Jordan et al. (2009) describe the PTR-MS using the Time of Flight Mass Spectrometer.
The PTR-ToF-MS used in this study operated with the following settings: drift tube temperature at 120◦C; inlet tube temperature at 180◦C; and ion source voltages of Us=140 V, Uso=92 V, E/N 130 Td. The extraction voltage at the end of the drift tube
5
(Udx) was 28 V.
A thermal desorption system was used for the filter sample analysis, as described by Timkovsky et al. (2015). In short, the setup consisted of a cylindrical quartz glass tube surrounded by two ovens: the first oven, where the sample was inserted using a filter holder, can be controlled over a temperature range of 50 to 350◦C. The second
10
oven worked at a constant temperature of 180◦C. A piece of 0.20 cm2
area from each filter was introduced to the first oven at 50◦C and heated in temperature steps of 50◦C from 100 to 350◦C, allowing 3 min for the measurement at each temperature. The N2
flow rate (ultrapure nitrogen, 5.7 purity, Airproducts) was usually adjusted by a thermal mass-flow controller (MKS Instruments, Germany) at 100 mL min−1, except for a few
15
tunnel samples, which were measured at a flow rate of 50 mL min−1. Pure N2was used
as carrier gas and transported organic molecules desorbed from the sample to the PTR-MS. The heating steps were performed under inert atmosphere, where no other gas besides N2 was present in the oven system, in order to exclude oxidation during
desorption. Each filter was measured three times and unless otherwise mentioned the
20
average of the three replicas is presented and discussed hereafter.
The quartz filters were collected by the mini-volume sampler and were used for the quantification of Total Carbon (TC) separated in Organic (OC) and elemental (EC) carbon using Thermal-Optical Transmittance (TOT) with a Sunset Laboratory Inc. in-strument (Sunset labs, Tigard, USA) as described by Brito et al. (2013). The evaluation
25
of OC occurred at temperature steps of 310, 475, 615, and 870◦C, with heating times
ACPD
15, 33755–33788, 2015Vehicular emissions of organic particulate
matter in Sao Paulo, Brazil
B. S. Oyama et al.
Title Page
Abstract Introduction
Conclusions References
Tables Figures
◭ ◮
◭ ◮
Back Close
Full Screen / Esc
Printer-friendly Version
Interactive Discussion
Discussion
P
a
per
|
Discussion
P
a
per
|
Discussion
P
a
per
|
Discussion
P
a
per
|
Pérez-Martínez et al. (2014) presented emission factors of the total PM2.5mass con-centration, for the same tunnels campaigns described here. Briefly, PM2.5 was
sam-pled on polycarbonate filter by a dichotomous sampler, and its mass concentration was gravimetrically determined, using an electronic microbalance with a sensitivity of 1 µg under controlled conditions.
5
2.3 TD-PTR-MS data treatment
The TD-PTR-MS data evaluation was performed with custom routines described in Holzinger et al. (2010) by implementing the widget-tool, using Interactive Data Lan-guage (IDL, version 7.0, ITT Visual Information Solutions), described in Holzinger (2015). In total, 762 ions were detected in the mass spectra. In order to avoid primary
10
ions and inorganic ions, all ions withm/z <40 Da were excluded, exceptm/z31.077 (CH2OH+) and 33.033 (CH4OH+). Additionally, ions associated with the inorganic ion
NO+2 and higher water clusters ((H2O)2H3O+) were removed. After this screening, the
final mass list contained 712 ions that were attributed to organic molecules.
The data (volume mixing ratios, VMR, in nmol mol−1) had a temporal resolution of
15
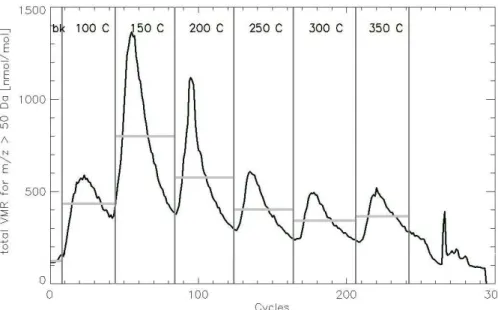
5 s. Similar to the procedure described by Timkovsky et al. (2015), the instrument back-ground (VMRi,instrbgd), identified in Fig. 2 by the first horizontal gray line, was subtracted from the measured volume mixing ratio (VMRi,measeured) for an ion “i” at each
temper-ature step:
VMRi =VMRi,measured−VMRi,instrbgd (1)
20
Where: VMRi is the volume mixing ratio corrected by the background. This calculation
was done for all filters samples and all field blanks. Figure 2 presents an example of this procedure: the sum of the volume mixing ratios for all m/z >50 Da per time interval of 5 s (also called cycles). The different temperature plateaus are separated by the vertical gray lines. The background is calculated by averaging the first eight cycles
25
ACPD
15, 33755–33788, 2015Vehicular emissions of organic particulate
matter in Sao Paulo, Brazil
B. S. Oyama et al.
Title Page
Abstract Introduction
Conclusions References
Tables Figures
◭ ◮
◭ ◮
Back Close
Full Screen / Esc
Printer-friendly Version
Interactive Discussion
Discussion
P
a
per
|
Discussion
P
a
per
|
Discussion
P
a
per
|
Discussion
P
a
per
|
All filter samples were measured three times. From these measurements, the av-erage of the VMR per filter was calculated for each ion i at each temperature step (VMRi). Note that all VMRi values have been normalized to a N2 carrier gas flow of
100 mL min−1.
Attest was performed in order to confirm the statistical significance of the ion signals
5
compared to the blank filters. After this test, 605 (TJQ), 627 (TRA) and 440 (winter) ion masses were kept in the database as their signal was significantly above the signal of the blank filters.
For the remaining masses, the median VMR of the field blanks (fb) was subtracted from the average VMR of the sampled filters (VMRi,sampled
) for each ion “i” and each
10
temperature step.
VMRi,final=
VMRi,sampled
−
VMRi,fb
MED (2)
The VMRi,finalwas used to calculate the concentration (ng m− 3
) for a specific ion “i”, at a specific temperature step (Ci), according to Timkovsky et al. (2015):
Ci =VMRi,final·Mi·VNitrogen
Vsamp·f
(3)
15
Where:Mi is the molecular weight of the ion “i” (minus one atomic mass unit, once
TD-PTR-MS measures protonated ions),VNitrogen is the amount of N2carrier gas (in mol),
Vsamp is the volume of air during sampling (in m 3
), andf is the area of the measured filter aliquot divided by the area of the whole filter (Timkovsky et al., 2015).
2.4 Vehicular Emission Factors of organic species
20
ACPD
15, 33755–33788, 2015Vehicular emissions of organic particulate
matter in Sao Paulo, Brazil
B. S. Oyama et al.
Title Page
Abstract Introduction
Conclusions References
Tables Figures
◭ ◮
◭ ◮
Back Close
Full Screen / Esc
Printer-friendly Version
Interactive Discussion
Discussion
P
a
per
|
Discussion
P
a
per
|
Discussion
P
a
per
|
Discussion
P
a
per
|
assuming that under normal driving conditions the fuel is converted to CO and CO2 while contributions from other carbon compounds are negligible:
EFP=103
∆[P]
∆[CO2]+ ∆[CO]
ωc (4)
Where: EFP is the emission factor of pollutant P (mg of P per kg of burned fuel);∆[P]
is the increase of [P] above the background levels (in ng m−3);∆[CO2] and∆[CO] are
5
the increases of the CO2and CO concentrations, respectively, above the background levels [µg of carbon m−3]. Theω
c term is the fuel carbon weight fraction (in g of C g− 1
of fuel) for a fuel c−ωG=0.757 for gasohol (26.5 % ethanol, 73.5 % gasoline) and
ωD=0.818 for diesel (5 % biodiesel, and 95 % diesel).
The emission factors for LDV were directly calculated from the filters sampled in
10
the TJQ tunnel due to the fact that LDV dominated the emissions in the TJQ tunnel. However, the HDV EF just can be estimated after subtracting LDV emissions from the samples collected in the TRA. Previous studies, also performed in tunnels, have shown that HDV and LDV emit comparable amounts of CO per travelled distance (Kirchstetter et al., 1999; Miguel et al., 1998; Pierson et al., 1996). The CO2 emissions from the
15
diesel burning could be estimated according to the following equation:
∆[CO2]D ∆[CO2]
= fDUDρDωD
fDUDρDωD+((1−fD) .UGρGωG)
(5)
Where∆[CO2]D is the component of∆[CO2] related to the emissions from diesel
ve-hicles (equal to HDV), fD is the fraction of HDV, U is the average fuel consumption
rate in g km−1 (75 g km−1 for gasohol and 251 g km−1 for diesel),ρ is the fuel density
20
(765 g L−1for gasohol, 854 g L−1for biodiesel). The subscripts G and D denote gasohol
ACPD
15, 33755–33788, 2015Vehicular emissions of organic particulate
matter in Sao Paulo, Brazil
B. S. Oyama et al.
Title Page
Abstract Introduction
Conclusions References
Tables Figures
◭ ◮
◭ ◮
Back Close
Full Screen / Esc
Printer-friendly Version
Interactive Discussion
Discussion
P
a
per
|
Discussion
P
a
per
|
Discussion
P
a
per
|
Discussion
P
a
per
|
The contribution of HDV to the concentration of a pollutant P can be estimated by the equation:
∆[P]HDV= ∆[P]−∆[CO] (1−fD)
∆[P]LDV ∆[CO] LDV
TJQ
(6)
Where∆[P]HDV is the contribution of∆[P], related to HDV emissions, ∆[CO] (1−fD) is
the fraction of ∆[CO] attributed to the LDV emissions. The last term in Eq. (6) was
5
calculated from the measurements in the TJQ campaign.
The presented EF’s are the averages of several filters. The HDV emission factors are averages from all filters collected in the TRA tunnel, and the LDV emission factors are averages of all afternoon and 12 h weekday samples from the TJQ tunnel, as these samples were less impacted by background ambient aerosol (see discussion below).
10
3 Results and discussion
Table 3 shows EFs (in mg of pollutant per kg of burned fuel) for OC, OA, and total PM2.5, as obtained by TOT, TD-PTR-MS, and gravimetrical analyses (Pérez-Martínez
et al., 2014), respectively. All EF’s were higher for HDV than for LDV.
The EF of OC represented 36 and 43 % of the EF of PM2.5 for LDV and HDV,
re-15
spectively. Brito et al. (2013) used OA/OC ratios of 1.6 and 1.5 for the TJQ and TRA campaigns, respectively. Using these ratios and measured OC (TOT, up to 310◦C) and OA (TD-PTR-MS, up to 300◦C) we infer that TD-PTR-MS quantified
∼90 and∼75 %
of LDV and HDV emissions, respectively, which is in line with known loss processes in TD-PTR-MS discussed by Holzinger et al. (2010 and 2013). It is difficult to compare the
20
ACPD
15, 33755–33788, 2015Vehicular emissions of organic particulate
matter in Sao Paulo, Brazil
B. S. Oyama et al.
Title Page
Abstract Introduction
Conclusions References
Tables Figures
◭ ◮
◭ ◮
Back Close
Full Screen / Esc
Printer-friendly Version
Interactive Discussion
Discussion
P
a
per
|
Discussion
P
a
per
|
Discussion
P
a
per
|
Discussion
P
a
per
|
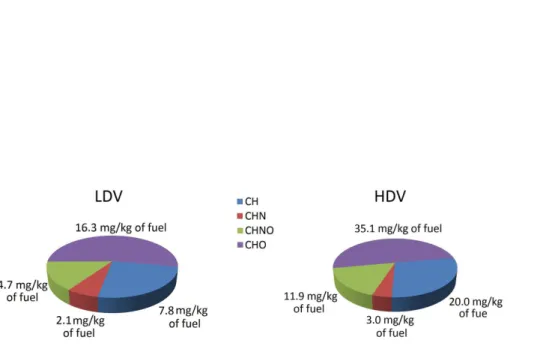
Table 3 also presents the EF of compounds containing oxygen (O) for LDV and HDV. We found high contributions from oxygenated compounds of around 70 % for both, LDV and HDV. This indicates that the fraction of oxygenated compounds in particulate matter is substantially higher than in the fuel. This can be associated to significant oxidation during the combustion, since photochemical processes are negligible inside
5
tunnels due to the absence of sunlight.
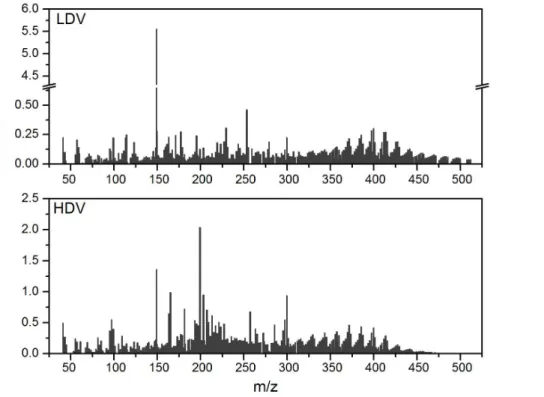
Figure 3 shows the average EF (in mg kg−1 of fuel) profiles for LDV and HDV, ob-tained from the TD-PTR-MS. As discussed above, HDV emitted higher concentrations of organic particulate compounds than the vehicles using gasohol. Differences between LDV and HDV are also seen from the chemical composition of the emitted particles.
10
Several ions above 475 Da were detected from LDV emissions with the TD-PTR-MS, and only two compounds exceeded EF’s of 0.250 mg kg−1 of fuel. In contrast, many compounds emitted by HDV exceeded 0.250 mg kg−1 of fuel, especially at m/z’s at around 200 Da, however, no ions above 475 Da were detected.
Table 4 and 5 show the ten highest average EF values for both types of vehicles,
15
as well as their m/z, their estimated empirical formula, the median, maximum and minimum EF values. The complete list of all compounds is shown in the Supplement Material. Using improved routines described in Holzinger et al. (2010), it was possi-ble to attribute empirical formulas to the m/z identified by the TD-PTR-MS, namely compounds with up to 16 atoms of oxygen and 2 atoms of nitrogen.
20
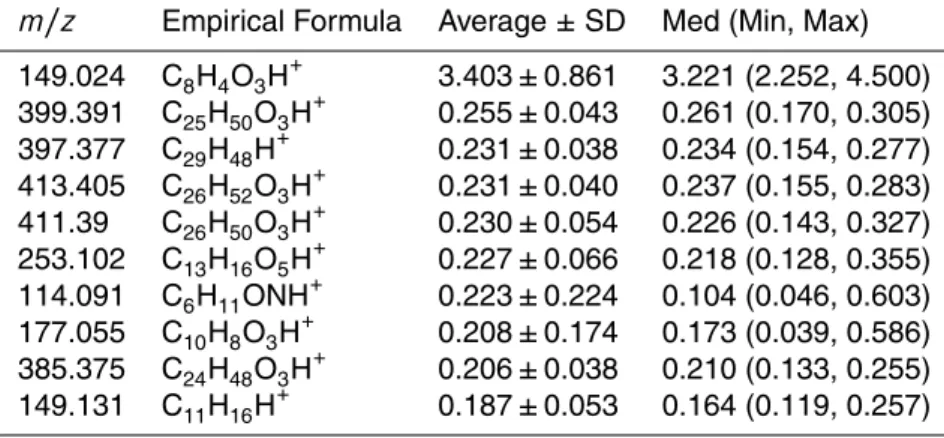
The highest average EF was found form/z 149.024 for the LDV with the value of 5.6 mg kg−1 of fuel. This compound was identified as C8H4O3, tentatively attributed to
phthalic anhydride. This compound is known for its use as plasticizers (responsible for the flexibility, resilience and transparency of the plastic) and it is also present in the plastic bags in which the filters (wrapped in aluminum foil) have been stored.
There-25
ACPD
15, 33755–33788, 2015Vehicular emissions of organic particulate
matter in Sao Paulo, Brazil
B. S. Oyama et al.
Title Page
Abstract Introduction
Conclusions References
Tables Figures
◭ ◮
◭ ◮
Back Close
Full Screen / Esc
Printer-friendly Version
Interactive Discussion
Discussion
P
a
per
|
Discussion
P
a
per
|
Discussion
P
a
per
|
Discussion
P
a
per
|
showed only little influence on real AMS measurements. Although these considerations indicate them/z149.024 as a possible contamination/artifact, it is important to point out that the instrumental background, field blank, and ambient air background sub-tractions were performed before calculating the emission factors. Therefore this ion is most likely originating from the collected aerosol on the filters. Furthermore, phthalic
5
anhydride (C8H4O3, detected onm/z149.024) has been positively identified in the
at-mosphere (Chan et al., 2009; Samy and Zielinska, 2010). Another possibility would be that this compound is produced from octane present in gasoline. Higher values of oc-tane in the fuel results in a higher resistance to auto ignition and consequently a lower chance for engine knocking (Cerri et al., 2013; Westbrook et al., 2011). However, this
10
dataset does not suggest thatm/z 149.024 might be a unique tracer for gasohol be-cause this compound was also substantially emitted from HDV (1.363 mg g−1 of fuel, see Table 5). This can be due to the procedure used for the calculation of the HDV EF, which considers the subtraction of the LDV EF. It can be cautiously argued thatm/z
149.024 may be a general tracer for aerosol from vehicles engine exhaust. However,
15
more research is necessary to clarify the origin of this compound.
The ion detected at m/z 149.131 (C11H16H+), as presented in Table 4, was ten-tatively attributed to pentyl benzene. Pentyl benzene is a potential unique tracer for gasoline, as this compound is a known constituent of gasoline, e.g. Ramadhan and Al-Hyali (1999) used pentyl benzene to calculate the octane number in the fuel. For HDV
20
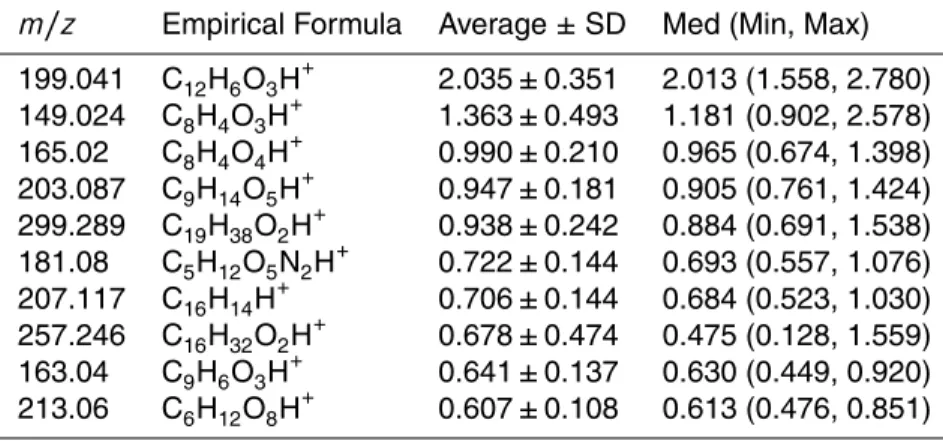
emissions,m/z 299.289 is a potentially unique tracer for this source. This ion was at-tributed to the formula C19H38O2H+, and tentatively attributed to methyl stearate, which
is one of the main components found in biodiesel (Naik et al., 2011). The emission fac-tor for LDV was approximately a facfac-tor of 6 lower (see the Supplement) than for HDV and this signal might originate from the low number of diesel fueled vehicles moving in
25
the TJQ tunnel.
ACPD
15, 33755–33788, 2015Vehicular emissions of organic particulate
matter in Sao Paulo, Brazil
B. S. Oyama et al.
Title Page
Abstract Introduction
Conclusions References
Tables Figures
◭ ◮
◭ ◮
Back Close
Full Screen / Esc
Printer-friendly Version
Interactive Discussion
Discussion
P
a
per
|
Discussion
P
a
per
|
Discussion
P
a
per
|
Discussion
P
a
per
|
around a third. Oxygenated hydrocarbons (CHO) showed highest contribution to emis-sions for both vehicle types, where LDV exhibited a slightly larger fraction than HDV. The nitrogen-containing groups contributed above 20 % to the measured OA. Since the presence of nitrogen in the fuels is significantly lower than in the air, such a high percentage in the aerosol can be attributed to NOx chemistry during the combustion
5
process (thermal effect).
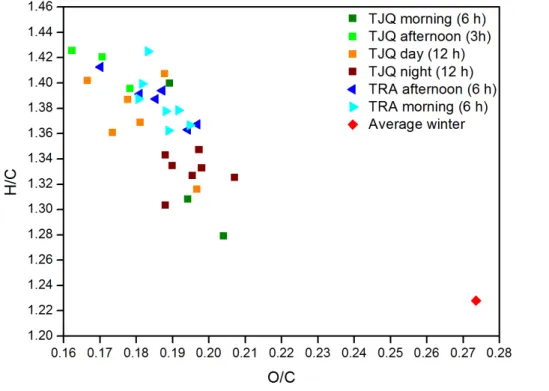
Figure 5 shows the relation between the atomic ratios H/C and O/C (Van Kreve-len Diagram). The average O/C ratio calculated from the ambient air samples (winter campaign) was higher than that measured in the tunnels. This can be associated to photochemical reactions in presence of sunlight producing oxygenated aerosol. The
10
high H/C ratios found for tunnel samples indicated that fresh aerosols were collected on the filters due to primary emission from vehicle exhausts.
The O/C and H/C ratios varied more for the samples collected during the TJQ cam-paign than for the samples collected in TRA, possibly due to the different sampling times (see Table 1). In general, the samples collected during the morning (for 6 h) and
15
at night (for 12 h) were more oxidized than the others. This can be related to a smaller number of cars and consequently to less POA emissions. In addition, the contribution of external air was more significant during these times. The afternoon samples (sam-pled for 3 h) were collected during the traffic congestion periods (between 5 and 8 p.m. – Brito et al., 2013) suggesting that POA dominated the burden sampled on the filters.
20
Samples collected during the day (for 12 h) were mainly dominated by afternoon traf-fic congestion profile. Consequently, we used the 12 h day samples and the afternoon samples from the TJQ tunnel to calculate LDV emission factors.
The O/C ratios considered for EF calculation ranged between 0.16 and 0.20 (O/C), indicating a higher amount of oxygen in POA for the OA desorbed up to 350◦C than
25
ACPD
15, 33755–33788, 2015Vehicular emissions of organic particulate
matter in Sao Paulo, Brazil
B. S. Oyama et al.
Title Page
Abstract Introduction
Conclusions References
Tables Figures
◭ ◮
◭ ◮
Back Close
Full Screen / Esc
Printer-friendly Version
Interactive Discussion
Discussion
P
a
per
|
Discussion
P
a
per
|
Discussion
P
a
per
|
Discussion
P
a
per
|
(Holzinger et al., 2013), the values found here indicate a more oxidized aerosol origi-nated from the fuels used in Brazil, which may be related to the use of ethanol.
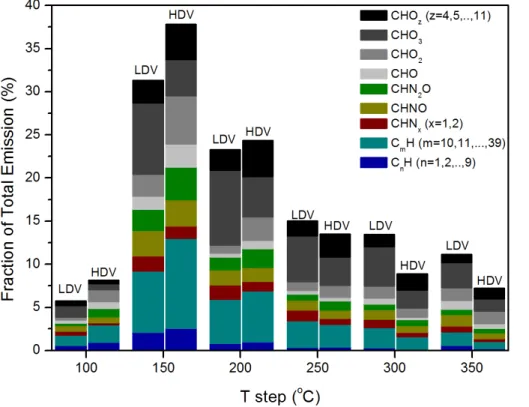
The distribution of the total emissions over the different desorption temperatures is presented in Fig. 6. This analysis indicated that OA produced from HDV were more volatile than OA from LDV. This can be seen by the higher amounts of HC and HCO
5
ions derived from HDV up to 200◦C.
Hydrocarbons (HC) represented the most volatile group. Their volatility was related to the number of carbons present in molecules: short-chain hydrocarbons (up to 9 carbon atoms) were more volatile than the long-chain ones (more than 9 carbon atoms). The short-chain HC contribution was substantially low at 250◦C and higher temperatures
10
while the long-chain HC contribution was still significant at 350◦C.
HDV emitted more volatile nitrogen compounds than LDV. Such distinction between the two categories of vehicular fleet was not observed in previous studies.
The oxygenated hydrocarbon compounds containing up to 2 oxygen atoms emitted by HDV were more volatile, as can be seen by the histogram in the 150–200◦C
tem-15
perature steps. LDV emitted more volatile compounds containing three oxygen atoms due to the high contribution of phthalic anhydride (C8H4O3), as presented in Table 4. Compounds containing more than 4 oxygen atoms were less volatile than compounds from other groups.
4 Conclusions
20
The main objective was the characterization of average emission factors of organic particulate compounds for Light (LDV) and Heavy (HDV) duty vehicles. The study was performed in the city of Sao Paulo, Brazil. Its atmosphere is impacted by the burning of different fuels: gasohol (gasoline with 25 % of ethanol), ethanol, and diesel (95 % diesel and 5 % biodiesel). The organic aerosol has an important contribution to the
25
ACPD
15, 33755–33788, 2015Vehicular emissions of organic particulate
matter in Sao Paulo, Brazil
B. S. Oyama et al.
Title Page
Abstract Introduction
Conclusions References
Tables Figures
◭ ◮
◭ ◮
Back Close
Full Screen / Esc
Printer-friendly Version
Interactive Discussion
Discussion
P
a
per
|
Discussion
P
a
per
|
Discussion
P
a
per
|
Discussion
P
a
per
|
and one campaign in ambient air were performed in the city of Sao Paulo, collecting aerosol samples on quartz filters. The quantification and identification of the organic compounds was performed by TD-PTR-MS and TOT. Additional data from previous studies in this area were used for comparison and interpretation.
We observed, with all methods, that HDV emitted more fine particles than LDV (per
5
kg fuel burned). OC represented a significant fraction of emitted PM2.5: 36 % of LDV
and 43 % of HDV, respectively. The amount of oxygen found in the desorbed aerosol up to 350◦C samples was higher than that found in the fuels. The emission of oxygenated compounds represented around 70 % of total organic aerosol for both types of vehicles measured by the TD-PTR-MS.
10
A comparison between EF’s of organic compounds (obtained by the TD-PTR-MS) from LDV and HDV showed distinct spectrum profiles. Them/z 149.024 (C8H4O3H+)
may be a tracer for aerosol formed in the exhaust from vehicle engines. However, possible contamination could not be completely excluded. Furthermore,m/z149.131 (C11H16H+) tentatively attributed to pentylbenzene may be a unique tracer for
gaso-15
line, and,m/z299.289 (C19H38O2H+) tentatively attributed to methyl stearate, may be
a unique tracer for aerosols originating from biodiesel combustion.
A comparison among chemical groups (CH, CHO, CHON, and CHN) did show dif-ferences between LDV and HDV emissions. The nitrogen-containing compound found in the particulate phase contributed around 20 % to the total OA emissions,
proba-20
bly related to NOx chemistry during fuel combustion. The thermal desorption analysis showed that HDV emitted more volatile compounds for the aerosol desorbed up to 350◦C, mainly oxygenated hydrocarbons containing up to two oxygen atoms and
long-chain hydrocarbons, than LDV.
Our results show that OA emission from LDV and HDV is a complex process
in-25
ACPD
15, 33755–33788, 2015Vehicular emissions of organic particulate
matter in Sao Paulo, Brazil
B. S. Oyama et al.
Title Page
Abstract Introduction
Conclusions References
Tables Figures
◭ ◮
◭ ◮
Back Close
Full Screen / Esc
Printer-friendly Version
Interactive Discussion
Discussion
P
a
per
|
Discussion
P
a
per
|
Discussion
P
a
per
|
Discussion
P
a
per
|
found markers may prove useful to constrain the contribution of traffic to the OA burden at different locations in Brazil.
The Supplement related to this article is available online at doi:10.5194/acpd-15-33755-2015-supplement.
Acknowledgements. The collection and analysis of tunnel samples from Brazil has been
5
funded by the Foundation for Research Support of the São Paulo State, (projects: 2011/17754-2 and 2011/17754-2012011/17754-2/2011/17754-21456-0), Improvement of Higher Education Personnel (CAPES) and National Council for Scientific and Technological Development (CNPq). The TD-PTR-MS has been funded by the Netherlands Organization for Scientific Research (NWO) under the ALW-Middelgroot program (Grant 834.08.002). U. Dusek acknowledges funding by the Netherlands 10
Organization for Scientific Research (NWO), Grant no. 820.01.001.
References
Albuquerque, T. A., Andrade, M. F., and Ynoue, R. Y.: Characterization of atmospheric aerosols in the city of Sao Paulo, Brazil: comparisons between polluted and unpolluted periods, Envi-ron. Monit. Assess., 184, 969–984, doi:10.1007/s10661-011-2013-y, 2012.
15
Andrade, M. F., Miranda, R. M., Fornaro, A., Kerr, A., Oyama, B., Andre, P. A., and Saldiva, P.: Vehicle emissions and PM2.5 mass concentrations in six Brazilian cities, Air Qual. Atmos. Heal., 5, 79–88, doi:10.1007/s11869-010-0104-5, 2012.
ANP: Boletim Mensal do Biodiesel – Fevereiro 2015 Agência Nacional do Petróleo, Gás Natural e Biocombustíveis, 22, available at: http://www.anp.gov.br/?pg=62809&m=&t1=&t2=&t3=
20
&t4=&ar=&ps=&cachebust=1356027285119 (last access: 3 November 2015), 2015. Brito, J., Rizzo, L. V., Herckes, P., Vasconcellos, P. C., Caumo, S. E. S., Fornaro, A.,
Ynoue, R. Y., Artaxo, P., and Andrade, M. F.: Physical–chemical characterisation of the par-ticulate matter inside two road tunnels in the São Paulo Metropolitan Area, Atmos. Chem. Phys., 13, 12199–12213, doi:10.5194/acp-13-12199-2013, 2013.
25
ACPD
15, 33755–33788, 2015Vehicular emissions of organic particulate
matter in Sao Paulo, Brazil
B. S. Oyama et al.
Title Page
Abstract Introduction
Conclusions References
Tables Figures
◭ ◮
◭ ◮
Back Close
Full Screen / Esc
Printer-friendly Version
Interactive Discussion
Discussion
P
a
per
|
Discussion
P
a
per
|
Discussion
P
a
per
|
Discussion
P
a
per
|
emission control policies, Environ. Sci. Policy, 47, 68–79, doi:10.1016/j.envsci.2014.11.001, 2015.
Castanho, D. A. and Artaxo, P.: Wintertime and summertime São Paulo aersol source appor-tionment study, Atmos. Environ., 35, 4889–4902, 2001.
Cerri, T., D’Errico, G., and Onorati, A.: Experimental investigations on high octane 5
number gasoline formulations for internal combustion engines, Fuel, 111, 305–315, doi:10.1016/j.fuel.2013.03.065, 2013.
Cetesb: Relatório de Qualidade do Ar no Estado de São Paulo 2011: Série Relatórios, CETESB, São Paulo, SP, Brazil, ISSN 0103-4103, 2012.
Cetesb: Relatório de Qualidade do Ar no Estado de São Paulo 2012: Série Relatórios, 10
CETESB, São Paulo, SP, Brazil, ISSN 0103-4103, 2013.
Cetesb: Relatório de Qualidade do Ar no Estado de São Paulo 2013: Série Relatórios, CETESB, São Paulo, SP, Brazil, ISSN 0103-4103, 2014.
Chan, A. W. H., Kautzman, K. E., Chhabra, P. S., Surratt, J. D., Chan, M. N., Crounse, J. D., Kürten, A., Wennberg, P. O., Flagan, R. C., and Seinfeld, J. H.: Secondary organic aerosol 15
formation from photooxidation of naphthalene and alkylnaphthalenes: implications for oxida-tion of intermediate volatility organic compounds (IVOCs), Atmos. Chem. Phys., 9, 3049– 3060, doi:10.5194/acp-9-3049-2009, 2009.
Chirico, R., Prevot, A. S. H., DeCarlo, P. F., Heringa, M. F., Richter, R., Weingartner, E., and Baltensperger, U.: Aerosol and trace gas vehicle emission factors measured in a tunnel us-20
ing an Aerosol Mass Spectrometer and other on-line instrumentation, Atmos. Environ., 45, 2182–2192, doi:10.1016/j.atmosenv.2011.01.069, 2011.
Collier, S., Zhou, S., Kuwayama, T., Forestieri, S., Brady, J., Zhang, M., Kleeman, M., Cappa, C., Bertram, T., and Zhang, Q.: Organic PM Emissions from Vehicles: composi-tion, O/C Ratio, and Dependence on PM Concentration, Aerosol Sci. Tech., 49, 86–97, 25
doi:10.1080/02786826.2014.1003364, 2015.
Decarlo, P. F., Kimmel, J. R., Trimborn, A., Northway, M. J., Jayne, J. T., Aiken, A. C., Gonin, M., Fuhrer, K., Horvath, T., Docherty, K. S., Worsnop, D. R., and Jimenez, J. L.: Field-Deployable, High-Resolution, Time-of-Flight Aerosol Mass Spectrometer, Anal. Chem., 78, 8281–8289, doi:8410.1029/2001JD001213.Analytical, 2006.
30
ACPD
15, 33755–33788, 2015Vehicular emissions of organic particulate
matter in Sao Paulo, Brazil
B. S. Oyama et al.
Title Page
Abstract Introduction
Conclusions References
Tables Figures
◭ ◮
◭ ◮
Back Close
Full Screen / Esc
Printer-friendly Version
Interactive Discussion
Discussion
P
a
per
|
Discussion
P
a
per
|
Discussion
P
a
per
|
Discussion
P
a
per
|
Hansel, A., Jordan, A., Holzinger, R., Prazeller, P., Vogel, W., and Lindinger, W.: Proton transfer reaction mass spectrometry: on-line trace gas analysis at the ppb level, Int. J. Mass Spec-trom. Ion Process., 149–150, 609–619, 1995.
Holzinger, R.: PTRwid: A new widget tool for processing PTR-TOF-MS data, Atmos. Meas. Tech., 8, 3903–3922, doi:10.5194/amt-8-3903-2015, 2015.
5
Holzinger, R., Kasper-Giebl, A., Staudinger, M., Schauer, G., and Röckmann, T.: Analysis of the chemical composition of organic aerosol at the Mt. Sonnblick observatory using a novel high mass resolution thermal-desorption proton-transfer-reaction mass-spectrometer (hr-TD-PTR-MS), Atmos. Chem. Phys., 10, 13969–14011, doi:10.5194/acp-10-10111-2010, 2010.
10
Holzinger, R., Goldstein, A. H., Hayes, P. L., Jimenez, J. L., and Timkovsky, J.: Chemical evo-lution of organic aerosol in Los Angeles during the CalNex 2010 study, Atmos. Chem. Phys., 13, 10125–10141, doi:10.5194/acp-13-10125-2013, 2013.
Infocidade: Infocidade, available at: http://infocidade.prefeitura.sp.gov.br/, last access: 23 May 2015.
15
Jordan, A., Haidacher, S., Hanel, G., Hartungen, E., Märk, L., Seehauser, H., Schottkowsky, R., Sulzer, P., and Märk, T. D.: A high resolution and high sensitivity proton-transfer-reaction time-of-flight mass spectrometer (PTR-TOF-MS), Int. J. Mass Spectrom., 286, 122–128, doi:10.1016/j.ijms.2009.07.005, 2009.
Kirchstetter, T. W., Harley, R. A., Kreisberg, N. M., Stolzenburg, M. R., and Hering, S. V: On-20
road measurement of fine particle and nitrogen oxide emissions from light- and heavy-duty motor vehicles, Atmos. Environ., 33, 2955–2968, 1999.
Lindinger, W., Hansel, A., and Jordan, A.: On-line monitoring of volatile organic compounds at pptv levels by means of proton-transfer-reaction mass spectrometry (PTR-MS) medical applications, food control and environmental research, Int. J. Mass Spectrom., 173, 191– 25
241, 1998.
Martins, L. D., Andrade, M. F., Freitas, E. D., Pretto, A., Gatti, L. V., Albuquerque, E. L., Tomaz, E., Guardani, M. L., Martins, M. H. R. B., and Junior, O. M. A.: Emission factors for gas-powered vehicles traveling through road tunnels in São Paulo, Brazil., Environ. Sci. Technol., 40, 6722–6729, 2006.
30
ACPD
15, 33755–33788, 2015Vehicular emissions of organic particulate
matter in Sao Paulo, Brazil
B. S. Oyama et al.
Title Page
Abstract Introduction
Conclusions References
Tables Figures
◭ ◮
◭ ◮
Back Close
Full Screen / Esc
Printer-friendly Version
Interactive Discussion
Discussion
P
a
per
|
Discussion
P
a
per
|
Discussion
P
a
per
|
Discussion
P
a
per
|
Miranda, R. M. and Andrade, M. F.: Physicochemical characteristics of atmospheric aerosol during winter in the São Paulo Metropolitan area in Brazil, Atmos. Environ., 39, 6188–6193, doi:10.1016/j.atmosenv.2005.06.055, 2005.
Miranda, R. M., Andrade, M. F., Worobiec, A., and Van Grieken, R.: Characterisation of aerosol particles in the São Paulo Metropolitan Area, Atmos. Environ., 36, 345–352, 2002.
5
MME: Ministério de Minas e Energia, available at: http://www.mme.gov.br/programas/biodiesel/ menu/programa/objetivos_diretrizes.html, last access: 23 March 2015.
Naik, C. V., Westbrook, C. K., Herbinet, O., Pitz, W. J., and Mehl, M.: Detailed chemical ki-netic reaction mechanism for biodiesel components methyl stearate and methyl oleate, P. Combust. Inst., 33, 383–389, doi:10.1016/j.proci.2010.05.007, 2011.
10
Pérez-Martínez, P. J., Miranda, R. M., Nogueira, T., Guardani, M. L., Fornaro, A., Ynoue, R., and Andrade, M. F.: Emission factors of air pollutants from vehicles measured inside road tunnels in São Paulo: case study comparison, Int. J. Environ. Sci. Technol., doi:10.1007/s13762-014-0562-7, 2014.
Pierson, W. R., Gertler, A. W., Robinson, N. F., Sagebiel, J. C., Zielinska, B., Bishop, G. A., 15
Stedman, D. H., Zweidinger, R. B., and Ray, W. D.: Real-world automotive emissions – sum-mary of studies in the Fort McHenry and Tuscarora Mountain Tunnels, Atmos. Environ., 30, 2233–2256, doi:10.1016/1352-2310(95)00276-6, 1996.
Ramadhan, O. M. and Al-Hyali, E. A.: New experimental and theoretical relation to determine the research octane number (Ron) of authentic aromatic hydrocarbons could be present 20
in the gasoline fraction, Pet. Sci. Technol., 17, 623–635, doi:10.1080/10916469908949737, 1999.
Rico, J. A. P. and Sauer, I. L.: A review of Brazilian biodiesel experiences, Renew. Sust. Energ. Rev., 45, 513–529, doi:10.1016/j.rser.2015.01.028, 2015.
Salvo, A. and Geiger, F. M.: Reduction in local ozone leves in urban São Paulo due to a shift 25
from ethanol to gasoline use, Nat. Geosci., 7, 450–458, doi:10.1038/NGEO2144, 2014. Samy, S. and Zielinska, B.: Secondary organic aerosol production from modern diesel engine
emissions, Atmos. Chem. Phys., 10, 609–625, doi:10.5194/acp-10-609-2010, 2010.
Sánchez-Ccoyllo, O. R. and Andrade, M. F.: The influence of meteorological conditions on the behavior of pollutants concentrations in São Paulo, Brazil., Environ. Pollut., 116, 257– 30
ACPD
15, 33755–33788, 2015Vehicular emissions of organic particulate
matter in Sao Paulo, Brazil
B. S. Oyama et al.
Title Page
Abstract Introduction
Conclusions References
Tables Figures
◭ ◮
◭ ◮
Back Close
Full Screen / Esc
Printer-friendly Version
Interactive Discussion
Discussion
P
a
per
|
Discussion
P
a
per
|
Discussion
P
a
per
|
Discussion
P
a
per
|
Souza, D. Z., Vasconcellos, P. C., Lee, H., Aurela, M., Saarnio, K., Teinilä, K., and Hillamo, R.: Composition of PM2.5and PM10collected at urban sites in Brazil, Aerosol Air Qual. Res., 14, 168–176, doi:10.4209/aaqr.2013.03.0071, 2014.
Stattman, S. L., Hospes, O., and Mol, A. P. J.: Governing biofuels in Brazil: a comparison of ethanol and biodiesel policies, Energ. Policy, 61, 22–30, doi:10.1016/j.enpol.2013.06.005, 5
2013.
Szwarcfiter, L., Mendes, F. E., and La Rovere, E. L.: Enhancing the effects of the Brazilian pro-gram to reduce atmospheric pollutant emissions from vehicles, Transp. Res. Part D Transp. Environ., 10, 153–160, doi:10.1016/j.trd.2004.12.002, 2005.
Timkovsky, J., Dusek, U., Henzing, J. S., Kuipers, T. L., Röckmann, T., and Holzinger, R.: Of-10
fline thermal-desorption proton-transfer-reaction mass spectrometry to study composition of organic aerosol, J. Aerosol Sci., 79, 1–14, doi:10.1016/j.jaerosci.2014.08.010, 2015.
Westbrook, C. K., Pitz, W. J., Mehl, M., and Curran, H. J.: Detailed chemical kinetic reaction mechanisms for primary reference fuels for diesel cetane number and spark-ignition octane number, P. Combust. Inst., 33, 185–192, doi:10.1016/j.proci.2010.05.087, 2011.
15
ACPD
15, 33755–33788, 2015Vehicular emissions of organic particulate
matter in Sao Paulo, Brazil
B. S. Oyama et al.
Title Page
Abstract Introduction
Conclusions References
Tables Figures
◭ ◮
◭ ◮
Back Close
Full Screen / Esc
Printer-friendly Version
Interactive Discussion
Discussion
P
a
per
|
Discussion
P
a
per
|
Discussion
P
a
per
|
Discussion
P
a
per
|
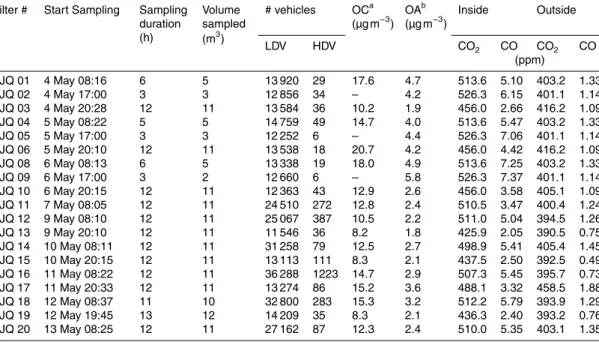
Table 1.Filter identification, sampling time start, sampling duration, volume sampled (for OA samples), vehicle counts, OC and OA concentrations, and average CO and CO2concentrations during sampling in the TJQ tunnel in the year 2011.
Filter # Start Sampling Sampling duration (h)
Volume sampled (m3)
# vehicles OCa (µg m−3) OA
b
(µg m−3) Inside Outside
LDV HDV CO2 CO CO2 CO
(ppm)
TJQ 01 4 May 08:16 6 5 13 920 29 17.6 4.7 513.6 5.10 403.2 1.33 TJQ 02 4 May 17:00 3 3 12 856 34 – 4.2 526.3 6.15 401.1 1.14 TJQ 03 4 May 20:28 12 11 13 584 36 10.2 1.9 456.0 2.66 416.2 1.09 TJQ 04 5 May 08:22 5 5 14 759 49 14.7 4.0 513.6 5.47 403.2 1.33
TJQ 05 5 May 17:00 3 3 12 252 6 – 4.4 526.3 7.06 401.1 1.14
TJQ 06 5 May 20:10 12 11 13 538 18 20.7 4.2 456.0 4.42 416.2 1.09 TJQ 08 6 May 08:13 6 5 13 338 19 18.0 4.9 513.6 7.25 403.2 1.33
TJQ 09 6 May 17:00 3 2 12 660 6 – 5.8 526.3 7.37 401.1 1.14
TJQ 10 6 May 20:15 12 11 12 363 43 12.9 2.6 456.0 3.58 405.1 1.09 TJQ 11 7 May 08:05 12 11 24 510 272 12.8 2.4 510.5 3.47 400.4 1.24 TJQ 12 9 May 08:10 12 11 25 067 387 10.5 2.2 511.0 5.04 394.5 1.26 TJQ 13 9 May 20:10 12 11 11 546 36 8.2 1.8 425.9 2.05 390.5 0.75 TJQ 14 10 May 08:11 12 11 31 258 79 12.5 2.7 498.9 5.41 405.4 1.45 TJQ 15 10 May 20:15 12 11 13 113 111 8.3 2.1 437.5 2.50 392.5 0.49 TJQ 16 11 May 08:22 12 11 36 288 1223 14.7 2.9 507.3 5.45 395.7 0.73 TJQ 17 11 May 20:33 12 11 13 274 86 15.2 3.6 488.1 3.32 458.5 1.88 TJQ 18 12 May 08:37 11 10 32 800 283 15.3 3.2 512.2 5.79 393.9 1.29 TJQ 19 12 May 19:45 13 12 14 209 35 8.3 2.1 436.3 2.40 393.2 0.76 TJQ 20 13 May 08:25 12 11 27 162 87 12.3 2.4 510.0 5.35 403.1 1.35 ameasured by TOT
ACPD
15, 33755–33788, 2015Vehicular emissions of organic particulate
matter in Sao Paulo, Brazil
B. S. Oyama et al.
Title Page
Abstract Introduction
Conclusions References
Tables Figures
◭ ◮
◭ ◮
Back Close
Full Screen / Esc
Printer-friendly Version
Interactive Discussion
Discussion
P
a
per
|
Discussion
P
a
per
|
Discussion
P
a
per
|
Discussion
P
a
per
|
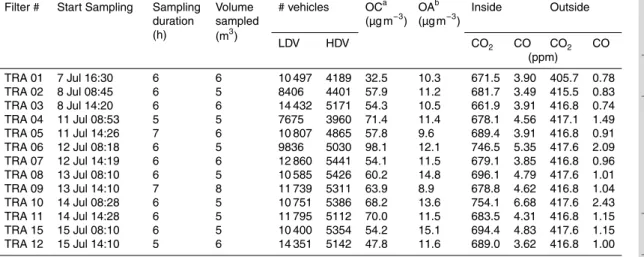
Table 2.Filter identification, sampling time start, sampling duration, volume sampled (for OA samples), vehicle counts, OC and OA concentration, and average CO and CO2concentrations during sampling in the TRA tunnel in the year 2011.
Filter # Start Sampling Sampling duration (h)
Volume sampled (m3)
# vehicles OCa (µg m−3) OA
b
(µg m−3) Inside Outside
LDV HDV CO2 CO CO2 CO
(ppm)
TRA 01 7 Jul 16:30 6 6 10 497 4189 32.5 10.3 671.5 3.90 405.7 0.78 TRA 02 8 Jul 08:45 6 5 8406 4401 57.9 11.2 681.7 3.49 415.5 0.83 TRA 03 8 Jul 14:20 6 6 14 432 5171 54.3 10.5 661.9 3.91 416.8 0.74 TRA 04 11 Jul 08:53 5 5 7675 3960 71.4 11.4 678.1 4.56 417.1 1.49 TRA 05 11 Jul 14:26 7 6 10 807 4865 57.8 9.6 689.4 3.91 416.8 0.91 TRA 06 12 Jul 08:18 6 5 9836 5030 98.1 12.1 746.5 5.35 417.6 2.09 TRA 07 12 Jul 14:19 6 6 12 860 5441 54.1 11.5 679.1 3.85 416.8 0.96 TRA 08 13 Jul 08:10 6 5 10 585 5426 60.2 14.8 696.1 4.79 417.6 1.01 TRA 09 13 Jul 14:10 7 8 11 739 5311 63.9 8.9 678.8 4.62 416.8 1.04 TRA 10 14 Jul 08:28 6 5 10 751 5386 68.2 13.6 754.1 6.68 417.6 2.43 TRA 11 14 Jul 14:28 6 5 11 795 5112 70.0 11.5 683.5 4.31 416.8 1.15 TRA 15 15 Jul 08:10 6 5 10 400 5354 54.2 15.1 694.4 4.83 417.6 1.15 TRA 12 15 Jul 14:10 5 6 14 351 5142 47.8 11.6 689.0 3.62 416.8 1.00 ameasured by TOT
ACPD
15, 33755–33788, 2015Vehicular emissions of organic particulate
matter in Sao Paulo, Brazil
B. S. Oyama et al.
Title Page
Abstract Introduction
Conclusions References
Tables Figures
◭ ◮
◭ ◮
Back Close
Full Screen / Esc
Printer-friendly Version
Interactive Discussion
Discussion
P
a
per
|
Discussion
P
a
per
|
Discussion
P
a
per
|
Discussion
P
a
per
|
Table 3.OA (TD-PTR-MS), OC (TOT) and PM2.5averages emission factors (mg kg−1
of burned fuel) and SD of the filters, for LDV and HDV.
PTR-MS TOT Gravimetryb
up to 300◦C Totala
at 310◦C From 310–870◦C PM 2.5
All compounds Compounds with O
LDV 27.4±10.4 30.9±12.2 21.0±8.8 28.0±7.9 108.3±35.7 300±100a
HDV 69.1±15.0 74.5±15.0 50.0±11.0 58.6±8.9 304.0±81.4 700±300a a
The sum of all EF per temperature step (from 100 until 350◦C) b
ACPD
15, 33755–33788, 2015Vehicular emissions of organic particulate
matter in Sao Paulo, Brazil
B. S. Oyama et al.
Title Page
Abstract Introduction
Conclusions References
Tables Figures
◭ ◮
◭ ◮
Back Close
Full Screen / Esc
Printer-friendly Version
Interactive Discussion
Discussion
P
a
per
|
Discussion
P
a
per
|
Discussion
P
a
per
|
Discussion
P
a
per
|
Table 4.The ten highest EFs (mg kg−1
of fuel) for LDV.
m/z Empirical Formula Average±SD Med (Min, Max)
ACPD
15, 33755–33788, 2015Vehicular emissions of organic particulate
matter in Sao Paulo, Brazil
B. S. Oyama et al.
Title Page
Abstract Introduction
Conclusions References
Tables Figures
◭ ◮
◭ ◮
Back Close
Full Screen / Esc
Printer-friendly Version
Interactive Discussion
Discussion
P
a
per
|
Discussion
P
a
per
|
Discussion
P
a
per
|
Discussion
P
a
per
|
Table 5.The ten highest EFs (mg kg−1
of fuel) for HDV.
m/z Empirical Formula Average±SD Med (Min, Max)
ACPD
15, 33755–33788, 2015Vehicular emissions of organic particulate
matter in Sao Paulo, Brazil
B. S. Oyama et al.
Title Page
Abstract Introduction
Conclusions References
Tables Figures
◭ ◮
◭ ◮
Back Close
Full Screen / Esc
Printer-friendly Version
Interactive Discussion
Discussion
P
a
per
|
Discussion
P
a
per
|
Discussion
P
a
per
|
Discussion
P
a
per
|
Figure 2.Result of an analysis of filter TRA 10 by TD-PTR-MS. The figure shows the total volume mixing ratios (VMR) of all ions above 50 Da (in nmol mol−1
ACPD
15, 33755–33788, 2015Vehicular emissions of organic particulate
matter in Sao Paulo, Brazil
B. S. Oyama et al.
Title Page
Abstract Introduction
Conclusions References
Tables Figures
◭ ◮
◭ ◮
Back Close
Full Screen / Esc
Printer-friendly Version
Interactive Discussion
Discussion
P
a
per
|
Discussion
P
a
per
|
Discussion
P
a
per
|
Discussion
P
a
per
|