ACPD
12, 19349–19370, 2012Selective measurements of
isoprene and 2-methyl-3-buten-2-ol
T. Karl et al.
Title Page
Abstract Introduction
Conclusions References
Tables Figures
◭ ◮
◭ ◮
Back Close
Full Screen / Esc
Printer-friendly Version Interactive Discussion
Discussion
P
a
per
|
Dis
cussion
P
a
per
|
Discussion
P
a
per
|
Discussio
n
P
a
per
|
Atmos. Chem. Phys. Discuss., 12, 19349–19370, 2012 www.atmos-chem-phys-discuss.net/12/19349/2012/ doi:10.5194/acpd-12-19349-2012
© Author(s) 2012. CC Attribution 3.0 License.
Atmospheric Chemistry and Physics Discussions
This discussion paper is/has been under review for the journal Atmospheric Chemistry and Physics (ACP). Please refer to the corresponding final paper in ACP if available.
Selective measurements of isoprene and
2-methyl-3-buten-2-ol based on NO
+
ionization mass spectrometry
T. Karl1, A. Hansel2, L. Cappellin2,3, L. Kaser2, I. Herdlinger2, and W. Jud2
1
NCAR Earth System Laboratory, National Center for Atmospheric Research, P.O. Box 3000, Boulder, Colorado 80307, USA
2
Institut f ¨ur Ionenphysik und Angewandte Physik, Leopold Franzens Universit ¨at Innsbruck, Technikerstrasse 25, 6020, Innsbruck, Austria
3
IASMA Research and Innovation Centre, Fondazione Edmund Mach, Food Quality and Nutrition Area, Via E. Mach, 1, 38010, S. Michele a/A, Italy
Received: 9 July 2012 – Accepted: 10 July 2012 – Published: 3 August 2012
Correspondence to: T. Karl ([email protected])
ACPD
12, 19349–19370, 2012Selective measurements of
isoprene and 2-methyl-3-buten-2-ol
T. Karl et al.
Title Page
Abstract Introduction
Conclusions References
Tables Figures
◭ ◮
◭ ◮
Back Close
Full Screen / Esc
Printer-friendly Version Interactive Discussion
Discussion
P
a
per
|
Dis
cussion
P
a
per
|
Discussion
P
a
per
|
Discussio
n
P
a
per
|
Abstract
Biogenic VOC emissions are often dominated by 2-methyl-1,3-butadiene (isoprene) and 2-methyl-3-buten-2-ol (232 MBO). Here we explore the possibility for selectively distinguishing these species using NO+ as primary ion based on PTR-MS technol-ogy. High purity of NO+ (>90 %) as a primary ion was achieved in laboratory and field 5
experiments using a PTR-TOF-MS. Isoprene is ionized via charge transfer leading to the major product ion C5H+8 (>99 %) (e.g. Spanel and Smith, 1998). 232 MBO un-dergoes a hydroxide ion transfer reaction resulting in the major product ion channel C5H+9 (>95 %) (e.g. Amelynck et al., 2005). We show that both compounds are ionized
with little fragmentation (<5 %) under standard PTR-MS operating conditions. Typi-10
cal sensitivities of 11.1±0.1 (isoprene) and 12.9±0.1 (232 MBO) ncps ppbv−1 were achieved, which correspond to limit of detections of 18 and 15 pptv, respectively for a 10 s integration time. Sensitivities decreased at higher collisional energies. Calibra-tion experiments showed little humidity dependence. We tested the setup at a field site in Colorado dominated by ponderosa pine, a 232 MBO emitting plant species. Our 15
measurements confirm 232 MBO as the dominant biogenic VOC at this site, exhibit-ing typical average daytime concentrations between 0.2–1.4 ppbv. The method is able to detect the presence of trace levels of isoprene (90–250 ppt) without any interfer-ence from 232 MBO, which would not be feasible using H3O+ ionization chemistry,
and which currently also remains a challenge for other analytical techniques (e.g. gas 20
chromatographic methods).
1 Introduction
Isoprene (2-methyl-1,3-butadiene) plays an important global and regional role in pho-tochemistry and climate. It was first discovered by Rasmussen (1969) and Sanadze et al. (1976) that plants can synthesize and subsequently emit this chemical. Cur-25
rently the global emission strength of isoprene is estimated to be 560 Tg y−1(Guenther
ACPD
12, 19349–19370, 2012Selective measurements of
isoprene and 2-methyl-3-buten-2-ol
T. Karl et al.
Title Page
Abstract Introduction
Conclusions References
Tables Figures
◭ ◮
◭ ◮
Back Close
Full Screen / Esc
Printer-friendly Version Interactive Discussion
Discussion
P
a
per
|
Dis
cussion
P
a
per
|
Discussion
P
a
per
|
Discussio
n
P
a
per
|
et al., 2006) (uncertainty range: 230–700 Tg y−1, e.g. Stevenson et al., 2006), which could exceed that of methane (IPCC, 2007). Many different VOCs are emitted into the atmosphere and together the global VOC emission source is currently estimated to be in the range of 1200–1350 Tg y−1 (Goldstein and Galbally, 2007). Chameides et al. (1988) showed that isoprene was the single most important reactive VOC fuel-5
ing ozone chemistry in the South Eastern US. Oxidation of isoprene leads to complex organic compounds, which will be oxidized further to CO2, or deposit in the form of
highly soluble organic species or organic aerosol (e.g. Karl et al., 2010). It has re-cently been suggested that oxidation of isoprene is still poorly understood questioning our understanding of the oxidizing capacity of the atmosphere (Lelieveld et al., 2008; 10
Hofzumahaus et al., 2009). Through these processes isoprene along with other VOCs exhibits a direct and indirect climate forcing on the Earth’s atmosphere.
While isoprene is a dominant emission from many deciduous ecosystems, Goldan et al. (1993) reported the ubiquitous presence of 2-methyl-3-butene-2-ol (232 MBO) in a coniferous forest in the USA. Since then many studies (e.g. Harley et al., 1998; 15
Schade and Goldstein, 2001; Baker et al., 2001; Kim et al., 2010) have confirmed the presence of this alcohol throughout coniferous ecosystems in the Western US. Due to the large emission source 232 MBO is sometimes also termed the “isoprene of the west”.
The ecological roles of isoprene and 232 MBO have not been entirely elucidated, but 20
might reflect a plant’s ability to protect against oxidative stress (Loreto and Schnitzler, 2010), act as a biochemical stat (Rosenstiel et al., 2004) or mitigate high temperature exposure (Sharkey et al., 2008).
With the emergence of fast online measurement techniques, ecosystem fluxes of both species are increasingly obtained by the eddy covariance technique. Proton-25
alco-ACPD
12, 19349–19370, 2012Selective measurements of
isoprene and 2-methyl-3-buten-2-ol
T. Karl et al.
Title Page
Abstract Introduction
Conclusions References
Tables Figures
◭ ◮
◭ ◮
Back Close
Full Screen / Esc
Printer-friendly Version Interactive Discussion
Discussion
P
a
per
|
Dis
cussion
P
a
per
|
Discussion
P
a
per
|
Discussio
n
P
a
per
|
hols and aldehydes, which collisionally dissociate and could potentially interfere with the detection of isoprene using hydronium ion chemistry in PTR-MS. In many places isoprene dominates over most other BVOCs and these interferences are often shown to be minor (Karl et al., 2004; Warneke et al., 2010; Misztal et al., 2011); however mea-surements, particularly in coniferous ecosystems, can be more challenging due to the 5
concomitant emission of isoprene and 232 MBO. Need for improved detection of these species is also corroborated by the fact that conventional GC (gas chromatographic) techniques can be prone to humidity and oxidant dependent detection uncertainties (Golden et al., 1995). Baker et al. (2001) have shown that anytime a sample treatment involves heating, 232 MBO can dehydrate (e.g. GC sample treatment). Here we test 10
the feasibility of using NO+ ion chemistry to selectively distinguish isoprene and 232 MBO using PTR-MS technology.
2 Method and field site description
2.1 Field site and sampling inlet
The study was located at the Manitou Forest Observatory near Woodland Park, Col-15
orado, USA (2290 m elev., lat. 39◦6′0′′N, long. 105◦5′30′′W) and took place in July 2011. The site has been described previously (e.g. Kim et al., 2010) and is representa-tive of the montane ponderosa pine zone in the front range which extends from South-ern Wyoming to NorthSouth-ern New Mexico. The canopy is open and of varying density, with mixed age ponderosa pine up to 100 yr old and a surface cover of grasses, sage, cro-20
cus, forbs and exposed cryptogrammic soils. The average tree height surrounding the measurement tower was 18.5 m.
Measurements were taken from a 30 m tall tower. All instruments sampled off an approximately 35 m long Teflon line (OD: 3/8′′), pumped at a speed of about 30 l min−1, so that overall delay times were measured between 3 and 5 s.
25
ACPD
12, 19349–19370, 2012Selective measurements of
isoprene and 2-methyl-3-buten-2-ol
T. Karl et al.
Title Page
Abstract Introduction
Conclusions References
Tables Figures
◭ ◮
◭ ◮
Back Close
Full Screen / Esc
Printer-friendly Version Interactive Discussion
Discussion
P
a
per
|
Dis
cussion
P
a
per
|
Discussion
P
a
per
|
Discussio
n
P
a
per
|
2.2 PTR-TOF-MS (H3O+)
A proton-transfer reaction time of flight mass spectrometer (PTR-TOF-MS) based on a high resolution time of flight mass spectrometer (HTOF-MS, Tofwerks, Switzerland) and developed at the University of Innsbruck (Graus et al., 2010) was operated using protonated water (H3O+) as reagent ion. De Gouw and Warneke (2007) reviewed the
5
operational mode for H3O+ chemistry using the PTR-MS technique in detail. Here we operated the instrument at 60◦C, a drift tube voltage of 580 V and a drift tube pressure of 2.3 mbar. These conditions resulted in an E N−1 ratio of about 125 Townsend (Td) (E being the electric field strength andN the gas number density; 1 Td=10−17V cm2). 6 min average concentration measurements are used for the analysis presented in this 10
manuscript. Details about TOF-MS data acquisition and data post processing can be found in M ¨uller et al. (2010).
2.3 PTR-TOF-MS (NO+
)
Measurements using NO+ ionization were performed using a PTR-TOF-MS 8000 ap-paratus from Ionicon Analytik GmbH, Innsbruck (Austria) (Jordan et al., 2009a). The 15
ionization conditions in the drift tube were controlled by drift voltage (530 V), drift tem-perature (60◦C) and drift pressure (2.3 mbar) resulting in anE N−1of about 115 Td. In NO+mode the hollow cathode was supplied with dry, purified air entering the ionization region leading to the following ionization sequence:
N++O2
k1
→NO++O (1a)
20
O++N2→k2NO++N (1b)
N+2+O2
k3
→O+2+N2 (1c)
ACPD
12, 19349–19370, 2012Selective measurements of
isoprene and 2-methyl-3-buten-2-ol
T. Karl et al.
Title Page
Abstract Introduction
Conclusions References
Tables Figures
◭ ◮
◭ ◮
Back Close
Full Screen / Esc
Printer-friendly Version Interactive Discussion
Discussion
P
a
per
|
Dis
cussion
P
a
per
|
Discussion
P
a
per
|
Discussio
n
P
a
per
|
where rate coefficientsk2 andk3 are much smaller than the collisional rate (i.e.k3≪
kc) and rate coefficientsk1andk4proceed close tokc(Federer et al., 1985).
The instrument utilized in this study is equipped with a dynamically adjustable source valve, which can be used to control the gas exchange rate in the ion-source via a dif-ferential pumping stage (e.g. Jordan et al., 2009b). The achieved purity of the NO+ 5
signal was 93 % in the field and 95 % for laboratory calibration experiments. Knighton et al. (2009) have observed high purity of NO+ production and concluded that NO+2 formation can be largely suppressed by adjusting the ion source extraction voltage. Here settings of 6–8 mA ion current, an extraction voltage of 120 V and a source valve setting of 35 % led to a fraction of about 1 % NO+2 relative to NO+. O+2 and H3O+varied
10
between 2–4 % and 1–3 %, respectively relative to the NO+ signal.
The sampling time per channel in the TOF was set to 0.2 ns, amounting to 174 499 channels for a mass spectrum up to about 428.5 Th. More detail on data acquisition and treatment can be found in Cappellin et al. (2012).
2.4 Calibration setup
15
A custom built calibration system was used to dilute gravimetrically prepared VOC stan-dards including isoprene and 232 MBO. Gas standard 1 was gravimetrically prepared and provided by NOAA according to protocols published by Montzka et al. (1993). The standard contained methanol (1.89 ppmv), acetonitrile (2.00 ppmv), acetaldehyde (3.53 ppmv), acetone (1.99 ppmv), methylvinylketone (1.1 ppmv), limonene (2.1 ppmv), 20
2-methyl-3-buten-2-ol (2.2 ppmv), pyrrole (2.1 ppmv), benzene (1.49 ppmv), toluene (2.3 ppmv), methylethylketone (2.2 ppmv) with an uncertainty of±5 %. Gas standards 2 and 3 were gravimetrically prepared in house and contained isoprene (gas standard 2: 7.25 ppmv; gas standard 3: 147.2 ppbv) and camphene (gas standard 2: 4.87 ppmv, gas standard 3: 96.6 ppbv). Both standards were cross-validated with GC-FID based 25
on a NIST traceable hydrocarbon standard with an uncertainty of±5 % (Greenberg and Zimmerman, 1984). Gas standard 4 was gravimetrically prepared by Apel-Riemer En-vironmental Inc (CO, USA) and contained isoprene (10 ppbv) and camphene (10 ppbv)
ACPD
12, 19349–19370, 2012Selective measurements of
isoprene and 2-methyl-3-buten-2-ol
T. Karl et al.
Title Page
Abstract Introduction
Conclusions References
Tables Figures
◭ ◮
◭ ◮
Back Close
Full Screen / Esc
Printer-friendly Version Interactive Discussion
Discussion
P
a
per
|
Dis
cussion
P
a
per
|
Discussion
P
a
per
|
Discussio
n
P
a
per
|
with an uncertainty of±5 % each. All VOC standards were prepared in ultrapure nitro-gen.
Zero air was obtained by flowing ambient air through a small membrane pump (KNF, model MPU 2099-N8611.07, USA) pressurizing a flow controller (1 slm, Bronkhorst, model: F-201CV-K0ABD-22-V, Netherland), which was connected to a catalytic con-5
verter. Gas standards were selectively connected to a second flow controller (10 sccm, Bronkhorst, model: F-201CV-020-ABD-22-V, Netherland). The outflow from both flow controllers was connected via PFA Teflon fittings allowing a dynamic dilution range between 1/1000 and 1/10. Large flows were calibrated using a dry calibration system (Bios International, model DCL-MH, USA) and small flows (<10 sccm) were calibrated 10
using the bubble meter technique. The uncertainty due to the dynamic dilution system is estimated to be±10 %, leading to a combined uncertainty of±15 %. This setup al-lowed performing calibration experiments at ambient humidity (30 % RH). Calibration experiments under dry conditions (<1 % RH) were performed by passing dry zero air through the dilution flow controller.
15
3 Results
3.1 Ion chemistry
Previous ion chemistry investigations (e.g. Spanel and Smith, 1998; Amelynck et al., 2005; Jordan et al., 2009b; Knighton et al., 2009) identified four dominant reaction pathways using NO+as primary ion. These include charge transfer,
20
NO++AH→k AH++NO, (2a)
hydride ion transfer,
ACPD
12, 19349–19370, 2012Selective measurements of
isoprene and 2-methyl-3-buten-2-ol
T. Karl et al.
Title Page
Abstract Introduction
Conclusions References
Tables Figures
◭ ◮
◭ ◮
Back Close
Full Screen / Esc
Printer-friendly Version Interactive Discussion
Discussion
P
a
per
|
Dis
cussion
P
a
per
|
Discussion
P
a
per
|
Discussio
n
P
a
per
|
hydroxide ion transfer,
NO++AOH→k A++HNO2, (2c)
and three body association reactions,
NO++A+N2→k NO+
·A+N2. (2d)
The ionization potential (IP) of NO (IP: 9.26 eV) is often much lower than for common 5
VOCs detected in the atmosphere. Therefore Reaction (2a) only proceeds in selected cases. One such example is isoprene, exhibiting an IP of 8.84 eV. NO+ ionization via charge transfer can typically be regarded as “soft”, leading to very little or no frag-mentation (e.g. Spanel and Smith, 1998). Figure 1a depicts mass spectra for isoprene ionized by NO+. No significant fragmentation is observed and the major product ion 10
appears on m z−168 0618+Th, corresponding to (C5H+8):
NO++C5H8→k C5H+8+NO (3)
Similarly, Knighton et al. (2009) have used NO+ to selectively measure an anthro-pogenic pollutant (1,3 butadiene) and isoprene via charge transfer and reported negli-gible fragmentation for both compounds.
15
Due to the low IP of NO, many reactions will proceed via hydride ion transfer (Eq. 2b) or hydroxide ion transfer (Eq. 2c). Association (i.e. clustering) reactions (Eq. 2d) are largely suppressed under standard PTR-MS operating conditions (i.e. 115 Td) as a con-sequence of the high collisional energy (KEcm=0.16 eV). This is an important diff
er-ence to other chemical ionization mass spectrometers, where collisional dissociation 20
cells are often de-coupled from the reaction region, leading to potential nonlinear be-havior masked by ligand switching reactions (Eisele et al., 1992).
The reaction between NO+ and 232 MBO proceeds via hydroxide ion transfer ac-cording to
NO++C5H9OH→k C5H+9+HNO2, (Amelynck et al., 2005). (4) 25
ACPD
12, 19349–19370, 2012Selective measurements of
isoprene and 2-methyl-3-buten-2-ol
T. Karl et al.
Title Page
Abstract Introduction
Conclusions References
Tables Figures
◭ ◮
◭ ◮
Back Close
Full Screen / Esc
Printer-friendly Version Interactive Discussion
Discussion
P
a
per
|
Dis
cussion
P
a
per
|
Discussion
P
a
per
|
Discussio
n
P
a
per
|
Figure 1b shows mass spectra of 232 MBO ions measured during field and labora-tory experiments. The major product ion (>98 %) for 232 MBO is detected on molec-ular ion m z−1 69 0704+Th corresponding to (C5H+9); isoprene is observed on m z
−1
68 0626+Th. These measured signals are accurate to within 7×10⁻⁴Th of the exact molecular ion. During field experiments a contamination peak at m z−168 995+Th was 5
present, which was absent during laboratory investigations. The nature of this peak remains unclear, but it was confirmed as internal contamination, when it remained high after passing ambient air through a catalytic converter. The peak did not interfere with any of the presented analysis.
3.2 Calibration
10
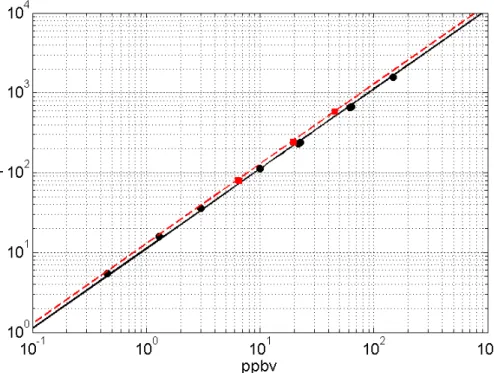
Figure 2 shows results from a typical calibration experiment performed for isoprene (black) and 232 MBO (red) at standard conditions (here defined as 115 Td). For isoprene data from 3 different standards (gas standard 2, 3 and 4) were included. The 3 point calibration curve for 232 MBO was based on gas standard 1. Each set of calibrations included two repetitions. Table 1 summarizes results for isoprene 15
and 232 MBO, which exhibit typical normalized sensitivities of 11.2±0.1 ncps ppbv−1 and 12.9±0.1 ncps ppbv−1, respectively. For a primary ion count rate of 4×10⁶cps, the corresponding actual sensitivities would be on the order of 44.8 cps ppbv−1 and 51.6 cps ppbv−1 for isoprene and 232 MBO. These values are comparable to sen-sitivities obtained with a similar PTR-TOF-MS instrument using H3O+ ionization.
20
Graus et al. (2010) for example reported sensitivities for isoprene on the order of 44.4 cps ppbv−1. Jordan et al. (2009a) reported typical normalized sensitivities for aromatic compounds (e.g. benzene and 1,3,5-trichlorobenzene) in the range of 11– 13 ncps ppbv−1. Normalized sensitivities for isoprene reported here are about a fac-tor of 2 lower than those reported by Knighton et al. (2009). The value presented 25
ACPD
12, 19349–19370, 2012Selective measurements of
isoprene and 2-methyl-3-buten-2-ol
T. Karl et al.
Title Page
Abstract Introduction
Conclusions References
Tables Figures
◭ ◮
◭ ◮
Back Close
Full Screen / Esc
Printer-friendly Version Interactive Discussion
Discussion
P
a
per
|
Dis
cussion
P
a
per
|
Discussion
P
a
per
|
Discussio
n
P
a
per
|
Spanel and Smith (1998) and Amelynck et al. (2005) reported rate constants for the {isoprene + NO+} and {232 MBO + NO+} reactions of 1.7×10⁻⁹cm3s−1 and 2.3×10⁻⁹cm3s−1, respectively. The present data suggest that the reaction of NO+with these VOCs proceeds at the collisional limiting value under typical PTR-MS conditions, here characterized by a center of mass energy (KEcm) of∼0.16 eV.
5
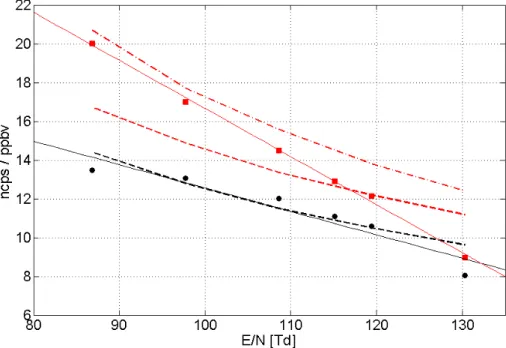
Figure 3 depicts the dependence of normalized sensitivities as a function of col-lisional energy (E N−1), expressed in units of Td. For this experiment the drift tube pressure was held constant at 2.3 mbar and the drift voltage was varied between 400 V and 600 V. Isoprene (black) closely follows a predicted slope based on the change in reaction time, while 232 MBO (red) exhibits a more pronounced change as a function 10
ofE N−1. Regression lines fitted through the measured data are depicted by the solid lines with individual regression coefficients listed in the figure caption.
In order to probe any potential interference we performed a test where separate mixtures of 232 MBO and Isoprene were added to a sample flow of 1.5 lpm (Fig. 4). A 6.7 ppbv concentration of 232 MBO was added at measurement cycle 30. At cycle 67 15
an isoprene mixing ratio of 41.6 ppbv was added to this flow. Isotopic ratios of isoprene were subtracted from m z−169. At cycle 150 the 232 MBO concentration was increased to 26.3 ppbv. The isoprene and 232 MBO standard addition was subsequently turned offas indicated on the graph. This test suggests that selective measurement of these chemical species can be performed interference free and could also potentially be used 20
for conventional PTR-MS applications.
3.3 Field measurements
A field test was performed between 8 and 16 August 2011, when two PTR-TOF-MS in-struments were deployed side by side. One instrument was operated in standard H3O+ mode (Kaser et al., 2012) while the other instrument was operated in NO+ mode. Fig-25
ure 5 depicts diurnal cycles averaged over the entire 8 day period. The sum of isoprene and 232 MBO measured by both instruments agrees well (blue and green trace, up-per panel). As confirmed before (Kim et al., 2010; Kaser et al., 2012) 232 MBO (red)
ACPD
12, 19349–19370, 2012Selective measurements of
isoprene and 2-methyl-3-buten-2-ol
T. Karl et al.
Title Page
Abstract Introduction
Conclusions References
Tables Figures
◭ ◮
◭ ◮
Back Close
Full Screen / Esc
Printer-friendly Version Interactive Discussion
Discussion
P
a
per
|
Dis
cussion
P
a
per
|
Discussion
P
a
per
|
Discussio
n
P
a
per
|
is the dominant biogenic VOC at this site. Isoprene is depicted in black and exhibits typical daytime concentrations of about 200–250 pptv. As expected for light dependent biogenic VOC (BVOC) emissions, the concentration of isoprene and 232 MBO rapidly declines after sunset. The lower panel shows the ratio between isoprene and 232 MBO with an average daytime value of about 0.2. The ratio increases to about 0.5 during 5
night, which could be indicative of different emission patterns between these BVOCs or the influence of non-local isoprene sources. For the 2011 campaign the OH reactiv-ity due to isoprene would amount to up to 40 % relative to that of 232 MBO for typical daytime conditions. Future eddy covariance measurements are needed to elucidate emission patterns of these two species in more detail at this site.
10
4 Conclusions
We have demonstrated that two dominant biogenic VOCs (isoprene and 232 MBO) can be selectively measured by chemical ionization mass spectrometry based on NO+ ion-ization. Our results confirm that isoprene is ionized via charge transfer, while 232 MBO undergoes a hydroxide transfer reaction. This allows the interference free detection 15
of both species using PTR-MS technology, which is prone to collisional dissociation of 232 MBO interfering with the detection of isoprene using conventional H3O+ ion-ization. The proposed method will also help assessing uncertainties of conventional gas-chromatography associated with the detection of isoprene in the presence of 232 MBO. Field measurements confirm 232 MBO as an important BVOC emitted from 20
a coniferous ecosystem in Colorado. Our measurements also show the presence of trace amounts of isoprene. These findings will pave the way for more selective mea-surements of these compounds, which are often concomitantly emitted in semi-arid ecosystems throughout the Western United States.
Acknowledgements. The National Center for Atmospheric Research is operated by the
Uni-25
ACPD
12, 19349–19370, 2012Selective measurements of
isoprene and 2-methyl-3-buten-2-ol
T. Karl et al.
Title Page
Abstract Introduction
Conclusions References
Tables Figures
◭ ◮
◭ ◮
Back Close
Full Screen / Esc
Printer-friendly Version Interactive Discussion
Discussion
P
a
per
|
Dis
cussion
P
a
per
|
Discussion
P
a
per
|
Discussio
n
P
a
per
|
project number L518-N20. Lisa Kaser is a recipient of a DOC-fFORTE-fellowship of the Austrian Academy of Science. The authors would like to thank Ralf Schnitzhofer, Rene Gutmann and Alfons Jordan for their help with preparing the UIBK PTR-TOF-MS for the BEACHON-ROMBAS field campaign.
References
5
Amelynck, C., Schoon, N., Kuppens, T., Bultinck, P., and Arijs, E.: A selected ion flow tube study of the reactions of H3O+, NO+and O+2 with some oxygenated biogenic volatile organic compounds, Int. J. Mass Spectrom., 247, 1–9, 2005.
Baker, B., Guenther, A., Greenberg, J., and Fall, R.: Canopy level fluxes of 2-methyl-3-buten-2-ol, acetone, and methanol by a portable relaxed eddy accumulation system, Environ. Sci.
10
Technol., 35, 1701–1708, 2001.
Cappellin, L., Karl, T., Probst, M., Ismailova, O., Winkler, P. M., Soukoulis, C., Aprea, E., Maerk, T. D., Gasperi, F., and Biasioli, F.: On quantitative determination of volatile organic compound concentrations using proton transfer reaction time-of-flight mass spectrometry, Environ. Sci. Technol., 46, 2283–2290, 2012.
15
Chameides, W. L., Lindsay, R. W., Richardson, J., and Kiang, C. S.: The role of biogenic hydro-carbons in urban photochemical smog – Atlanta as a case-study, Science, 241, 1473–1475, 1988.
deGouw, J. and Warneke, C.: Measurements of volatile organic compounds in the earth’s at-mosphere using proton-transfer-reaction mass spectrometry, Mass Spectrom. Rev., 26, 223–
20
257, 2007.
Eisele, F. L. and Berresheim, H.: High-pressure chemical ionization flow reactor for real-time mass-spectrometric detection of sulfur gases and unsaturated hydrocarbons in air, Anal. Chem., 64, 283–288, 1992.
Fall, R., Karl, T., Jordan, A., and Lindinger, W.: Biogenic C5 VOCs: release from leaves after
25
freeze-thaw wounding and occurrence in air at a high mountain observatory, Atmos. Environ., 35, 3905–3916, 2001.
Federer, W., Dobler, W., Howorka, F., Lindinger, W., Durupferguson, M., and Ferguson, E. E.: Collisional relaxation of vibrationally excited NO+(V) ions, J. Chem. Phys., 83, 1032–1038, 1985.
30
ACPD
12, 19349–19370, 2012Selective measurements of
isoprene and 2-methyl-3-buten-2-ol
T. Karl et al.
Title Page
Abstract Introduction
Conclusions References
Tables Figures
◭ ◮
◭ ◮
Back Close
Full Screen / Esc
Printer-friendly Version Interactive Discussion
Discussion
P
a
per
|
Dis
cussion
P
a
per
|
Discussion
P
a
per
|
Discussio
n
P
a
per
|
Goldan, P. D., Kuster, W. C., Fehsenfeld, F. C., and Montzka, S. A.: The observation of a C5 alcohol emission in a North American pine forest, Geophys. Res. Lett., 2, 1039–1042, 1993. Goldan, P. D., Kuster, W. C., and Fehsenfeld F. C.: Nonmethane hydrocarbon measurements
during the tropospheric OH photochemistry Experiment, J. Geophys. Res., 102, 6315–6324, 1997.
5
Graus, M., M ¨uller, M., and Hansel., A.: High resolution PTR-TOF: quantification and for-mula confirmation of VOC in real time, J. Am. Soc. Mass Spectr., 21, 1037–1044, doi:10.1016/j.jasms.2010.02.006, 2010.
Greenberg, J. P. and Zimmerman, P. R.: Nonmethane hydrocarbons in remote tropical, conti-nental, and marine atmospheres, J. Geophys. Res., 89, 4767–4778, 1984.
10
Guenther, A., Karl, T., Harley, P., Wiedinmyer, C., Palmer, P. I., and Geron, C.: Estimates of global terrestrial isoprene emissions using MEGAN (Model of Emissions of Gases and Aerosols from Nature), Atmos. Chem. Phys., 6, 3181–3210, doi:10.5194/acp-6-3181-2006, 2006.
Hansel, A., Jordan, A., Holzinger, R., Prazeller, P., Vogel, W., and Lindinger, W.: Proton transfer
15
reaction mass spectrometry: online trace gas analysis at the ppb level, Int. J. Mass Spec-trom., 149, 609–619, 1995.
Harley, P., Fridd-Stroud, V., Greenberg, J., Guenther, A., and Vasconcellos, P.: Emission of 2-methyl-3-buten-2-ol by pines: a potentially large natural source of reactive carbon to the atmosphere, J. Geophys. Res., 103, 25479–25486, 1998.
20
Hofzumahaus, A., Rohrer, F., Lu, K. D., Bohn, B., Brauers, T., Chang, C. C., Fuchs, H., Holand, F., Kita, K., Kondo, Y., Li, X., Lou, S. R., Shao, M., Zeng, L. M., Wahner, A., and Zhang, Y. H., Amplified trace gas removal in the troposphere, Science, 324, 1702–1704, 2009.
IPCC: Climate change 2007 – synthesis report,Cambridge University Press, Cambridge, UK
25
and New York, NY, USA, Geneva, Switzerland, 2007.
Jordan, A., Haidacher, S., Hanel, G., Hartungen, E., Mark, L., Seehauser, H., Schottkowsky, R., Sulzer, P., and Mark, T. D.: A high resolution and high sensitivity proton-transfer-reaction time-of-flight mass spectrometer (PTR-TOF-MS), Int. J. Mass Spectrom., 286, 122–128, 2009a. Jordan, A., Haidacher, S., Hanel, G., Hartungen E., Hrbig, J., Maerk, L., Schottkowsky, R.,
30
ACPD
12, 19349–19370, 2012Selective measurements of
isoprene and 2-methyl-3-buten-2-ol
T. Karl et al.
Title Page
Abstract Introduction
Conclusions References
Tables Figures
◭ ◮
◭ ◮
Back Close
Full Screen / Esc
Printer-friendly Version Interactive Discussion
Discussion
P
a
per
|
Dis
cussion
P
a
per
|
Discussion
P
a
per
|
Discussio
n
P
a
per
|
Karl, T., Guenther, A., Jordan, A., Fall, R., and Lindinger, W.: Eddy covariance measurements of biogenic oxygenated VOC emissions from hay harvesting, Atmos. Environ., 35, 491–495, 2001.
Karl, T., Potosnak, M., Guenther, A., Clark, D., Walker, J., Herrick, J. D., and Geron, C.: Ex-change processes of volatile organic compounds above a tropical rain forest: implications for
5
modeling tropospheric chemistry above dense vegetation, J. Geophys. Res., 109, D18306, doi:10.1029/2004JD004738, 2004.
Karl, T., Harley, P., Emmons, L., Thornton, B., Guenther, A., Basu, C., Turnipseed, A., and Jardine, K.: Efficient atmospheric cleansing of oxidized organic trace gases by vegetation, Science, 330, 816–819, doi:10.1126/science.1192534, 2010.
10
Kaser, L., Karl, T., Schnitzhofer, R., Graus, M., Herdlinger-Blatt, I. S., DiGangi, J. P., Horn-brook, R. S., Zheng, W., Flocke, F. M. Guenther, A., Keutsch, F. N., Apel, E., and Hansel, A.: Comparison of different real time VOC measurement techniques in a ponderosa pine forest, submitted, 2012.
Kim, S., Karl, T., Guenther, A., Tyndall, G., Orlando, J., Harley, P., Rasmussen, R., and Apel, E.:
15
Emissions and ambient distributions of Biogenic Volatile Organic Compounds (BVOC) in a ponderosa pine ecosystem: interpretation of PTR-MS mass spectra, Atmos. Chem. Phys., 10, 1759-1771, doi:10.5194/acp-10-1759-2010, 2010.
Knighton, W. B., Fornter, E. C., Herndon, S. C., Wood, E. C., and Miake-Lye, R. C.: Adaption of a proton transfer reaction mass spectrometer instrument to employ NO+ as reagent ion
20
for the detection of 1,3 butadiene in the ambient atmosphere, Rapid Commun. Mass Sp., 23, 3301–3308, 2009.
Lelieveld, J., Butler, T. M., Crowley, J. N., Dillon, T. J., Fischer, H., Ganzeveld, L., Harder, H., Lawrence, M. G., Martinez, M., Taraborrelli, D., and Williams, J.: Atmospheric oxidation ca-pacity sustained by a tropical forest, Nature, 452, 737–740, 2008.
25
Lindinger, W., Hansel, A., and Jordan, A.: On-line monitoring of volatile organic compounds at pptv levels by means of proton transfer- reaction mass spectrometry (PTR-MS) medical applications, food control and environmental research, Int. J. Mass Spectrom., 173, 191–241, 1998.
Misztal, P. K., Nemitz, E., Langford, B., Di Marco, C. F., Phillips, G. J., Hewitt, C. N.,
MacKen-30
zie, A. R., Owen, S. M., Fowler, D., Heal, M. R., Cape, J. N.: Direct ecosystem fluxes of volatile organic compounds from oil palms in South-East Asia, Atmos. Chem. Phys., 11, 8995–9017, doi:10.5194/acp-11-8995-2011, 2011.
ACPD
12, 19349–19370, 2012Selective measurements of
isoprene and 2-methyl-3-buten-2-ol
T. Karl et al.
Title Page
Abstract Introduction
Conclusions References
Tables Figures
◭ ◮
◭ ◮
Back Close
Full Screen / Esc
Printer-friendly Version Interactive Discussion
Discussion
P
a
per
|
Dis
cussion
P
a
per
|
Discussion
P
a
per
|
Discussio
n
P
a
per
|
Montzka, S. A., Trainer, M., Goldan, P. D., Kuster, W. C., and Fehsenfeld F. C.: Isoprene and its oxidation products, methyl vinyl ketone and methacrolein, in the rural troposphere, J. Geophys. Res., 98, 1101–1111, 1993.
M ¨uller, M., Graus, M., Ruuskanen, T. M., Schnitzhofer, R., Bamberger, I., Kaser, L., Titz-mann, T., Hoertnagl, L., Wohlfahrt, T., Karl, T., and Hansel, A.: First eddy covariance flux
5
measurements by PTR-TOF, Atmos. Meas. Tech., 3, 387–395, doi:10.5194/amt-3-387-2010, 2010.
Loreto, F. and Schnitzler, J. P.: Abiotic stresses and induced BVOCs, Trends Plant Sci., 15, 154–166, 2010.
Sanadze, G. A., Chiabrishvili, N. G., and Kalandadze, A. N.: Identification of phytogenic
iso-10
prene by method of nuclear magnetic resonance spectroscopy, Sov. Plant Physiol., 23, 898– 900, 1976.
Schade, G. W. and Goldstein, A. H.: Fluxes of oxygenated volatile organic compounds from a ponderosa pine plantation, J. Geophys. Res., 106, 3111–3123, 2001.
Sharkey, T. D., Wieberley, A. E., and Donohye, A. R.: Isoprene emission from plants: why and
15
how, Ann. Bot.-London, 101, 5–18, 2008.
Spanel, P. and Smith, D.: Selected ion flow tube studies of the reactions of H3O+NO+, and O−2(+) with several aromatic and aliphatic hydrocarbons, Int. J. Mass Spectrom., 181, 1–10, 1998.
Stevenson, D. S., Dentener, F. J., Schultz, M. G., Ellingsen, K., van Noije, T. P. C., Wild, O.,
20
Zeng, G., Amann, M., Atherton, C. S., Bell, N., Bergmann, D. J., Bey, I., Butler, T., Co-fola, J., Collins, W. J., Derwent, R. G., Doherty, R. M., Drevet, J., Eskes, H. J., Fiore, A. M., Gauss, M., Hauglustaine, D. A., Horowitz, L. W., Isaksen, I. S. A., Krol, M. C., Lamar-que, J. F., Lawrence, M. G., Montanaro, V., Muller, J. F., Pitari, G., Prather, M. J., Pyle, J. A., Rast, S., Rodgrigues, J. M., Sanderson, M. G., Savage, N. H., Shindell, D. T., Strahan, S. E.,
25
Sudo, K., and Szopa, S.: Multi-model ensemble simulations of present-day and near-future tropospheric ozone, J. Geophys. Res., 111, D08301, doi:10.1029/2005JD006338, 2006. Rasmussen, R. A.: Isoprene that missing link in terpene biosynthesis, identified as a foliage
volatile, Plant Physiol., S44, 40–42, 1969.
Rosenstiel, T. N., Ebbets, A. L., Khatri, W. C., Fall, R., and Monson, R. K.: Induction of poplar
30
ACPD
12, 19349–19370, 2012Selective measurements of
isoprene and 2-methyl-3-buten-2-ol
T. Karl et al.
Title Page
Abstract Introduction
Conclusions References
Tables Figures
◭ ◮
◭ ◮
Back Close
Full Screen / Esc
Printer-friendly Version Interactive Discussion
Discussion
P
a
per
|
Dis
cussion
P
a
per
|
Discussion
P
a
per
|
Discussio
n
P
a
per
|
Taipale, R., Ruuskanen, T. M., and Rinne, J.: Lag time determination in DEC measurements with PTR-MS, Atmos. Meas. Tech., 3, 853–862, doi:10.5194/amt-3-853-2010, 2010.
Warneke, C., Luxembourg, S. L., de Gouw, J. A., Rinne, H. J. I., Guenther, A. B., and Fall, R.: Disjunct eddy covariance measurements of oxygenated volatile organic com-pounds fluxes from an alfalfa field before and after cutting, J. Geophys. Res., 107, 4067,
5
doi:10.1029/2001JD000594, 2002.
Warneke, C., de Gouw, J. A., Del Negro, L., Grioude, J., McKeen, S., Stark, H., Kuster, W. C., Goldan, P. D., Trainer, M., Fehsenfeld, F. C., Wiedinmyer, C., Guenther, A. B., Hansel, A., Wisthaler, A., Atlas, E., Holloway, J. S., Ryerson, T. B., Peischl, J., Huey, L. G., Hanks, A. T. C.: Biogenic emission measurement and inventories determination of biogenic emissions in the
10
Eastern United States and Texas and comparison with biogenic emission inventories, J. Geophys. Res., 115, D00F18, doi:10.1029/2009JD012445, 2010.
ACPD
12, 19349–19370, 2012Selective measurements of
isoprene and 2-methyl-3-buten-2-ol
T. Karl et al.
Title Page
Abstract Introduction
Conclusions References
Tables Figures
◭ ◮
◭ ◮
Back Close
Full Screen / Esc
Printer-friendly Version Interactive Discussion
Discussion
P
a
per
|
Dis
cussion
P
a
per
|
Discussion
P
a
per
|
Discussio
n
P
a
per
|
Table 1.Sensitivities in ncps ppbv−1(=1×10⁶×VOC+[cps]/NO+[cps]/ppbv) obtained for a drift pressure of 2.3 mbar, a drift voltage of 530 V and a drift tube temperature of 60◦C corresponding toE N−1=115 Td.
Humidity Isoprene 232 MBO
ACPD
12, 19349–19370, 2012Selective measurements of
isoprene and 2-methyl-3-buten-2-ol
T. Karl et al.
Title Page
Abstract Introduction
Conclusions References
Tables Figures
◭ ◮
◭ ◮
Back Close
Full Screen / Esc
Printer-friendly Version Interactive Discussion
Discussion
P
a
per
|
Dis
cussion
P
a
per
|
Discussion
P
a
per
|
Discussio
n
P
a
per
|
Fig. 1.Observed mass spectra for field and laboratory measurements depicting the molecular ion distribution on m z−168+Th(A)and m z−1 69+Th (B). Spectra are normalized by the 232 MBO count rate.
ACPD
12, 19349–19370, 2012Selective measurements of
isoprene and 2-methyl-3-buten-2-ol
T. Karl et al.
Title Page
Abstract Introduction
Conclusions References
Tables Figures
◭ ◮
◭ ◮
Back Close
Full Screen / Esc
Printer-friendly Version Interactive Discussion
Discussion
P
a
per
|
Dis
cussion
P
a
per
|
Discussion
P
a
per
|
Discussio
n
P
a
per
|
Fig. 3.Normalized sensitivities plotted as a function ofE N−1. Isoprene (black) and 232 MBO (red) exhibit higher sensitivities at lower collisional energies. The dashed lines indicate a the-oretically calculated response curve based on a change in reaction time for a constant rate coefficient; the red dashed dotted line indicates the case using a varying rate coefficient for 232 MBO; the thin solid lines depict a linear fit (y=ax+b) through measured data yielding the following fitting coefficients: isoprene:a=−0.12,b=24.6 and 232 MBOa=−0.25,b=41.5.
ACPD
12, 19349–19370, 2012Selective measurements of
isoprene and 2-methyl-3-buten-2-ol
T. Karl et al.
Title Page
Abstract Introduction
Conclusions References
Tables Figures
◭ ◮
◭ ◮
Back Close
Full Screen / Esc
Printer-friendly Version Interactive Discussion
Discussion
P
a
per
|
Dis
cussion
P
a
per
|
Discussion
P
a
per
|
Discussio
n
P
a
per
|
Fig. 5.Diurnal concentrations of isoprene and 232 MBO using two PTR-TOF-MS instruments (upper panel); one instrument was operated in H3O+ mode depicting 232 MBO + isoprene (blue trace); the other instrument was operated in NO+ mode separating 232 MBO (red) and isoprene (black). The sum of the two is also plotted for comparison (green trace). The lower panel depicts the ratio between isoprene and 232 MBO.
![Table 1. Sensitivities in ncps ppbv −1 ( = 1×10 6 ×VOC + [cps]/NO + [cps]/ppbv) obtained for a drift pressure of 2.3 mbar, a drift voltage of 530 V and a drift tube temperature of 60 ◦ C corresponding to E N −1 = 115 Td.](https://thumb-eu.123doks.com/thumbv2/123dok_br/18434671.362502/17.918.684.899.65.676/table-sensitivities-obtained-drift-pressure-voltage-temperature-corresponding.webp)