Article
Plasma Adiponectin Levels in Elderly Patients with
Prediabetes
Si Eun Kong*, Yea Eun Kang*, Kyong Hye Joung, Ju Hee Lee, Hyun Jin Kim, Bon Jeong Ku
Department of Internal Medicine, Chungnam National University School of Medicine, Daejeon, Korea
Background: The significance of adiponectin levels in elderly individuals with prediabetes has yet to be determined. Thus, the present study was performed to evaluate the relationships between adiponectin levels and anthropometric variables, body compo-sition parameters, insulin sensitivity, and lipid profiles in elderly prediabetic patients.
Methods: The present study included 120 subjects with prediabetes who were >65 years of age and were selected from among
1,993 subjects enrolled in the Korea Rural Genomic Cohort Study. All subjects underwent a 75 g oral glucose tolerance test and tests for measurement of insulin sensitivity. All diagnoses of prediabetes satisfied the criteria of the American Diabetes Association.
Results: Plasma adiponectin levels were lower in elderly prediabetic subjects than elderly subjects with normal glucose tolerance (P<0.01) as well as in elderly prediabetic patients with metabolic syndrome (MetS) than in those without MetS (P<0.02). When
the subjects were categorized into two groups according to plasma adiponectin levels, the waist-to-hip ratio and 2-hour insulin levels were significantly lower in individuals with high plasma adiponectin levels than in those with low plasma adiponectin lev-els. Additionally, the plasma adiponectin levels of elderly prediabetic subject were inversely correlated with body mass index (BMI), waist circumference (WC), waist-to-hip ratio, visceral fat, visceral fat ratio, and 2-hour insulin levels.
Conclusion: The present findings demonstrated that the major factors correlated with adiponectin levels in elderly prediabetic subjects were BMI, WC, waist-to-hip ratio, visceral fat, visceral fat ratio, and 2-hour insulin levels.
Keywords: Aged; Prediabetic state; Adiponectin; Metabolic syndrome
INTRODUCTION
Type 2 diabetes mellitus (T2DM) and obesity are major public health problems, the incidences of which are rapidly increasing worldwide [1,2]. Furthermore, the global population is aging rapidly, and all countries, including Korea, have undergone a rapid increase in the rates of obesity among the elderly. For ex-ample, a recent report from the Korea Centers for Disease Con-trol and Prevention found that the mean prevalence of obesity in
individuals >65 years of age increased from 25.0% in 1998 to
34.2% in 2012 [3] and another study found that aging is associ-ated with an increased body fat mass and insulin resistance [4]. Obesity, particularly central obesity, is associated with insulin resistance, dyslipidemia, and hypertension and is a strong risk factor of cardiovascular disease (CVD) [5,6]. Taken together, these data suggest that obesity, insulin resistance, and aging are closely related.
Adiponectin is an adipose tissue-specific adipokine that plays
Received: 13 November 2014, Revised: 12 December 2014, Accepted: 27 March 2015
Corresponding author: Bon Jeong Ku
Department of Internal Medicine, Chungnam National University School of Medicine, 282 Munhwa-ro, Jung-gu, Daejeon 35015, Korea
Tel: +82-42-280-7149, Fax: +82-42-280-7995, E-mail: bonjeong@cnu.ac.kr *These authors contributed equally to this work.
Copyright © 2015 Korean Endocrine Society
a protective role against insulin resistance and inflammation and also protects the body against metabolic diseases [7,8]. T2DM and the accumulation of visceral fat decrease adiponec-tin levels [9] via the inhibitory actions of tumor necrosis
factor-α on the adiponectin gene [10]. A prospective cohort
study that analyzed 372 elderly Korean subjects established a relationship between reduced plasma adiponectin levels and T2DM or metabolic syndrome (MetS) [11]. Additionally, a cross-sectional study of patients with impaired fasting glucose (IFG) revealed that plasma adiponectin levels are associated with the risk of CVD [12]. According to the majority of studies investigating prediabetic patients, adiponectin levels are related to a number of body composition parameters, lipid profiles, in-sulin resistance factors (such as the homeostasis model assess-ment of insulin resistance [HOMA-IR] index), and various se-rum biomarkers of CVD. However, the significance of adipo-nectin levels in elderly prediabetic individuals has yet to be de-termined.
Thus, the present study evaluated the relationship between plasma adiponectin levels and clinical factors including anthro-pometric variables, body composition parameters, insulin sen-sitivity, and lipid profiles in elderly patients with prediabetes.
METHODS
Subjects
The present study included 120 individuals with prediabetes who were >65 years of age and were selected from among 1993
subjects enrolled in the Korea Rural Genomic Cohort Study (Geumsan County). Institutional Review Board of Chungnam National University Hospital approval was obtained prior to commencement of the study and all participants provided writ-ten informed consent prior to participation.
MetS was diagnosed in accordance with the updated Interna-tional Diabetes Federation guidelines [13] and all diagnoses of prediabetes satisfied the 2014 criteria of the American Diabetes Association [14]. Subjects who were newly diagnosed with dia-betes were excluded from the present study. Each subject com-pleted a standardized questionnaire concerning their personal medical history of chronic and acute illnesses and medication use.
Anthropometric and body composition measurements
All subjects underwent measurements of several anthropomet-ric variables including height, body weight, waist circumfer-ence (WC), blood pressure (BP), and body mass index (BMI).
A single experimenter performed both the height and weight measurements, WC was measured from the midpoint between the lowest rib and the iliac crest upon expiration, and BP was measured after at least 5 minutes of rest while in a seated posi-tion using the right arm of the patients. BMI was calculated as weight (kg) divided by height squared (m2
) and body composi-tion was calculated using a bioelectric impedance analysis (In-Body 4.0, Biospace Co., Seoul, Korea) that included fat mass, percent body fat, and lean mass.
Laboratory analysis
After a 12-hour overnight fast, all subjects underwent a 75 g oral glucose tolerance test, blood chemistry analysis, and mea-surement of their plasma adiponectin levels. Serum insulin lev-els were measured with the Coat-A-Count radioimmunoassay (RIA, DPC, Los Angeles, CA, USA) and plasma adiponectin levels were measured using a Human Adiponectin RIA kit (Lin-co Research Inc., Saint Louis, MO, USA). Insulin resistance was estimated using the HOMA-IR index and the quantitative insulin sensitivity check index (QUICKI) using the following formulae: HOMA-IR=(fasting insulin [μU/mL]×fasting
plas-ma glucose [mmol/L])/405 and QUICKI=1/(log fasting insulin
[μU/mL]+log fasting plasma glucose [mg/dL]).
Pulse-wave velocity
Brachial-ankle pulse-wave velocity (baPWV) was measured using a pulse wave analyzer (BP-203RPE, Colin, Komaki, Ja-pan) and defined as the mean of the left- and right-sided baP-WV values. The pulse waves of the brachial and tibial arteries were simultaneously recorded using an oscillometric method.
Statistical analysis
RESULTS
Characteristics of the subjects
The present study included 120 newly diagnosed elderly
predia-betic subjects and 100 elderly NGT subjects. The glucose and glycated hemoglobin (HbA1c) levels of the elderly prediabetic subjects were higher than those of the elderly NGT subjects. Ad-ditionally, the prediabetic subjects had significantly higher
Table 1. Baseline Characteristics of the Study Subjects
Characteristic NGT Prediabetes Male Female
NGT Prediabetes NGT Prediabetes
No. of subjects 100 120 33 55 67 65
Age, yr 67.13±1.69 67.20±1.81 67.09±1.82 67.38±1.94 67.15±1.64 67.05±1.69
BMI, kg/m2 23.92±3.25 24.30±3.14 24.14±2.37 23.90±3.41 23.82±3.62 24.64±2.88
WC, cm 80.77±8.14 82.42±8.54 82.21±6.94 80.87±8.48 80.05±8.62 83.72±8.43a
HC, cm 91.45±6.23 92.78±6.53 91.11±6.45 91.16±6.69 91.61±6.16 94.14±6.11a
Waist-to-hip ratio 0.88±0.07 0.88±0.05 0.90±0.10 0.88±0.05 0.87±0.05 0.88±0.05
Total body fat, kg 16.68±5.52 17.7±5.86 17.34±3.75 17.54±6.92 16.36±6.21 17.89±4.83
Visceral fat, kg 2.11±0.88 2.36±0.91a 2.14±0.61 2.27±0.97 2.09±0.99 2.44±0.86a
Total body fat ratio 27.59±6.31 28.53±6.99 29.31±5.10 28.71±7.82 26.74±6.70 28.38±6.27a
Visceral fat ratio 10.33±2.95 11.49±2.67b 10.54±2.64 11.50±2.91 10.23±3.10 11.48±2.48a
Total muscle, kg 39.42±6.98 39.90±7.03 37.33±6.21 37.95±5.91 40.45±7.15 41.58±7.52
Fasting glucose, mmol/L 4.91±6.35 5.38±0.55b 4.94±0.36 5.36±0.55b 4.90±0.35 5.39±0.55b
2-Hour glucose, mmol/L 6.13±1.06 8.10±1.74b 6.34±0.84 8.21±1.59b 6.03±1.15 8.01±1.86b
Fasting insulin, pmol/L 52.16±17.15 64.31±36.18b 53.48±11.95 65.84±40.98a 51.46±19.24 62.99±31.81a
2-Hour insulin, pmol/L 281.76±158.00 362.74±300.30b
274.05±132.02 358.29±207.79a
285.51±170.15 366.56±362.95
HbA1c, % 5.25±0.27 5.63±0.36b 5.29±0.19 5.66±0.31b 5.23±0.22 5.60±0.40b
HOMA-IR index 1.65±0.58 2.24±1.40b
1.69±0.42 2.29±1.57a
1.62±0.65 2.21±1.25b
QUICKI 0.35±0.02 0.34±0.02b 0.35±0.01 0.34±0.02b 0.36±0.02 0.34±0.02b
TC, mmol/L 5.30±0.96 5.72±1.00b
5.59±0.88 5.73±1.09 5.15±0.98 5.72±0.92b
TG, mmol/L 1.69±0.97 2.04±1.19a 1.77±0.88 2.14±1.22 1.66±1.02 1.96±1.17
HDL-C, mmol/L 1.18±0.27 1.18±0.30 1.17±0.28 1.20±0.33 1.19±0.26 1.18±0.23
LDL-C, mmol/L 3.14±0.83 3.41±0.83b 3.44±0.76 3.39±0.89 2.99±0.82 3.43±0.78b
Adiponectin, µg/mL 12.71±4.76 10.39±4.56b 14.07±4.68 10.72±4.74a 11.91±4.67 9.86±4.14a
PWV, m/s 15.30±2.70 16.13±3.40a 18.29±2.33 18.86±2.60 13.83±1.28 14.04±1.03
SBP, mm Hg 131.17±15.99 136.87±16.60b 139.58±15.25 145.76±16.43 127.03±14.77 129.34±12.67
DBP, mm Hg 82.66±9.51 85.78±10.14b 86.97±9.28 88.89±10.84 80.54±8.95 83.15±8.77
AST, U/L 27.04±7.82 29.30±10.32 26.51±6.62 30.85±11.56 27.29±8.38 27.98±13.47
ALT, U/L 22.29±12.07 26.49±12.28a 21.78±10.50 26.14±10.81 22.53±12.83 26.78±13.47
γ-GTP, U/L 24.54±23.29 34.21±42.06a 21.42±13.36 32.23±31.80a 26.07±26.83 35.89±49.29
hs-CRP, mg/dL 1.47±2.11 1.98±3.84 1.49±2.13 1.47±2.11 1.45±2.03 2.41±4.83a
Ferritin, µg/L 67.64±50.06 102.31±97.67b 68.87±43.86 102.06±93.80 67.03±53.15 102.53±101.56a
Values are expressed as mean±SD. Two-hour glucose and 2-hour insulin represent glucose and insulin levels at 120 minutes after a glucose challenge. NGT, normal glucose tolerance; BMI, body mass index; WC, waist circumference; HC, hip circumference; HbA1c, glycated hemoglobin; HOMA-IR, homeostasis model assessment of insulin resistance; QUICKI, quantitative insulin sensitivity check index; TC, total cholesterol; TG, triglyceride; HDL-C, high density lipoprotein cholesterol; LDL-C, low density lipoprotein cholesterol; PWV, pulse-wave velocity; SBP, systolic blood pressure;
DBP, diastolic blood pressure; AST, aspartate aminotransferase; ALT, alanine aminotransferase; γ-GTP, gamma-glutamyl transpeptidase; hs-CRP,
high-sensitivity C-reactive protein.
amounts of visceral fat, a higher visceral fat ratio, a higher HOMA-IR index, higher fasting and 2-hour insulin levels, and higher levels of HbA1c, total cholesterol (TC), triglyceride (TG), low density lipoprotein cholesterol (LDL-C), PWV, BP, and fer-ritin but lower QUICK scores than the elderly NGT subjects. On the other hand, the NGT subjects had significantly higher plasma adiponectin levels than the prediabetic subjects (12.71±4.76 μg/
mL vs. 10.39±4.56 μg/mL, respectively; P<0.01). Additionally,
the anthropometric variables—WC, hip circumference (HC), visceral fat, the visceral fat ratio, and the total body fat ratio— were significantly higher in prediabetic females, but not males, relative to the NGT subjects (Table 1).
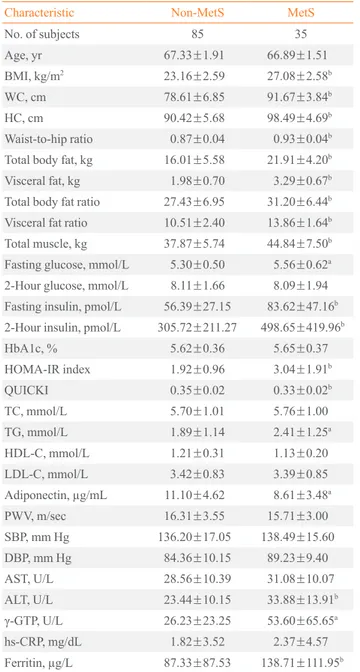
Clinical profiles of the elderly prediabetic subjects according to the presence of MetS
The elderly prediabetic subjects were separated into two groups based on the presence or absence of MetS. There were signifi-cant differences between subjects with and without MetS in all of the anthropometric variables and body composition parame-ters, fasting glucose levels, fasting insulin levels, 2-hour insulin levels, and insulin resistance-related factors, including the HOMA-IR index and QUICK. However, there were no signifi-cant differences in high density lipoprotein cholesterol (HDL-C), LDL-C, TC, and BP levels. The subjects without MetS had significantly higher plasma adiponectin levels than did those with MetS (11.10±4.62 μg/mL vs. 8.61±3.48 μg/mL, respec
-tively; P<0.02) (Table 2).
Clinical profiles according to plasma adiponectin levels
When the subjects were categorized into two groups according to plasma adiponectin levels, the high plasma adiponectin group had significantly lower waist-to-hip ratio and 2-hour insulin levels than the low plasma adiponectin group. All of the anthro-pometric variables, except waist-to-hip ratio, all body composi-tion parameters, and the fasting glucose, 2-hour glucose, TC, LDL-C, and BP levels were higher in the high plasma adiponec-tin group than in the low plasma adiponecadiponec-tin group; however, there were no significant differences (Table 3).
Correlations between adiponectin levels and clinical profiles
The Pearson’s correlation coefficients between the subjects’ adi-ponectin levels and lipid profiles, anthropometric variables, body composition parameters, and surrogate markers of insulin resis-tance are shown in Table 4. In the elderly prediabetic subjects, ad-iponectin levels were inversely correlated with BMI (r=–0.249,
Table 2. Clinical and Biochemical Characteristics of Elderly Prediabetic Subjects with and without Metabolic Syndrome
Characteristic Non-MetS MetS
No. of subjects 85 35
Age, yr 67.33±1.91 66.89±1.51
BMI, kg/m2 23.16±2.59 27.08±2.58b
WC, cm 78.61±6.85 91.67±3.84b
HC, cm 90.42±5.68 98.49±4.69b
Waist-to-hip ratio 0.87±0.04 0.93±0.04b
Total body fat, kg 16.01±5.58 21.91±4.20b
Visceral fat, kg 1.98±0.70 3.29±0.67b
Total body fat ratio 27.43±6.95 31.20±6.44b
Visceral fat ratio 10.51±2.40 13.86±1.64b
Total muscle, kg 37.87±5.74 44.84±7.50b
Fasting glucose, mmol/L 5.30±0.50 5.56±0.62a
2-Hour glucose, mmol/L 8.11±1.66 8.09±1.94
Fasting insulin, pmol/L 56.39±27.15 83.62±47.16b
2-Hour insulin, pmol/L 305.72±211.27 498.65±419.96b
HbA1c, % 5.62±0.36 5.65±0.37
HOMA-IR index 1.92±0.96 3.04±1.91b
QUICKI 0.35±0.02 0.33±0.02b
TC, mmol/L 5.70±1.01 5.76±1.00 TG, mmol/L 1.89±1.14 2.41±1.25a
HDL-C, mmol/L 1.21±0.31 1.13±0.20 LDL-C, mmol/L 3.42±0.83 3.39±0.85
Adiponectin, µg/mL 11.10±4.62 8.61±3.48a
PWV, m/sec 16.31±3.55 15.71±3.00
SBP, mm Hg 136.20±17.05 138.49±15.60
DBP, mm Hg 84.36±10.15 89.23±9.40
AST, U/L 28.56±10.39 31.08±10.07
ALT, U/L 23.44±10.15 33.88±13.91b
γ-GTP, U/L 26.23±23.25 53.60±65.65a
hs-CRP, mg/dL 1.82±3.52 2.37±4.57
Ferritin, µg/L 87.33±87.53 138.71±111.95b
Values are expressed as mean±SD. Two-hour glucose and 2-hour in-sulin represent glucose and inin-sulin levels at 120 minutes after a glucose challenge.
MetS, metabolic syndrome; BMI, body mass index; WC, waist cir-cumference; HC, hip circir-cumference; HbA1c, glycated hemoglobin; HOMA-IR, homeostasis model assessment of insulin resistance; QUICKI, quantitative insulin sensitivity check index; TC, total choles-terol; TG, triglyceride; HDL-C, high density lipoprotein cholescholes-terol; LDL-C, low density lipoprotein cholesterol; PWV, pulse-wave veloci-ty; SBP, systolic blood pressure; DBP, diastolic blood pressure; AST,
aspartate aminotransferase; ALT, alanine aminotransferase; γ-GTP,
gamma-glutamyl transpeptidase; hs-CRP, high-sensitivity C-reactive protein.
Table 3. Clinical and Biochemical Characteristics according to Plasma Adiponectin Level
Characteristic Plasma adiponectin level
Low High
No. of subjects 36 36
Age, yr 66.94±1.63 67.14±1.80
BMI, kg/m2 24.88±2.95 24.16±3.31
WC, cm 84.24±8.85 81.40±8.85
HC, cm 92.94±6.15 92.96±7.31
Waist-to-hip ratio 0.90±0.06 0.87±0.05a
Total body fat, kg 18.65±5.08 18.09±7.23
Visceral fat, kg 2.61±0.86 2.33±0.96
Visceral fat ratio 12.13±2.16 11.58±3.11
Total muscle, kg 41.06±7.29 38.59±6.78
Fasting glucose, mmol/L 5.37±0.59 5.30±0.64
2-Hour glucose, mmol/L 8.25±1.74 7.80±1.86
Fasting insulin, pmol/L 72.99±47.85 67.37±36.46
2-Hour insulin, pmol/L 520.94±585.05 337.04±179.88a
HbA1c, % 5.68±0.41 5.70±0.30
HOMA-IR index 2.55±1.89 2.33±1.39
QUICKI 0.34±0.02 0.34±0.02
TC, mmol/L 5.83±0.96 5.77±0.97
TG, mmol/L 2.09±0.91 2.18±1.60
HDL-C, mmol/L 1.22±0.25 1.23±0.36
LDL-C, mmol/L 3.46±0.84 3.34±0.78
PWV, m/sec 16.29±3.55 16.14±4.15
SBP, mm Hg 140.03±18.17 137.47±14.35
DBP, mm Hg 88.28±11.14 86.47±8.19
AST, U/L 29.75±8.23 31.44±12.89
ALT, U/L 29.13±12.77 25.02±10.29
γ-GTP, U/L 38.00±35.40 35.19±59.99 hs-CRP, mg/dL 3.32±6.39 1.72±2.31
Ferritin, µg/L 111.76±95.52 90.74±79.92
Values are expressed as mean±SD. Two-hour glucose and 2-hour in-sulin represent glucose and inin-sulin levels at 120 minutes after a glucose challenge.
BMI, body mass index; WC, waist circumference; HC, hip circumfer-ence; HbA1c, glycated hemoglobin; HOMA-IR, homeostasis model assessment of insulin resistance; QUICKI, quantitative insulin sensi-tivity check index; TC, total cholesterol; TG, triglyceride; HDL-C, high density lipoprotein cholesterol; LDL-C, low density lipoprotein cholesterol; PWV, pulse-wave velocity; SBP, systolic blood pressure; DBP, diastolic blood pressure; AST, aspartate aminotransferase; ALT,
alanine aminotransferase; γ-GTP, gamma-glutamyl transpeptidase;
hs-CRP, high-sensitivity C-reactive protein.
aP<0.05 vs. low.
Table 4. Pearson’s Correlation Coefficients for the Relation-ships between Adiponectin Levels and the Clinical and Bio-chemical Characteristics of Elderly Prediabetic Patients and Elderly Subjects with Normal Glucose Tolerance
Characteristic
r
NGT Prediabetes
BMI, kg/m2 –0.164 –0.249a
WC, cm –0.244 –0.282a
HC, cm –0.168 –0.132
Waist-to-hip ratio –0.182 –0.321b
Total body fat, kg –0.255a 0.046
Visceral fat, kg –0.309a –0.306b
Total body fat ratio –0.110 –0.138
Visceral fat ratio –0.268a –0.326b
Total muscle, kg –0.311a –0.219
SBP, mm Hg 0.280 0.088
DBP, mm Hg –0.149 –0.112
Fasting glucose, mmol/L –0.004 –0.185
2-Hour glucose, mmol/L 0.035 –0.134
Fasting insulin, pmol/L –0.190 –0.090
2-Hour insulin, pmol/L –0.009 –0.242a
HbA1c, % –0.181 –0.015
HOMA-IR index –0.184 –0.110
QUICKI 0.153 0.175
TC, mmol/L 0.117 –0.080
TG, mmol/L –0.355b 0.013
HDL-C, mmol/L 0.323a 0.038
LDL-C, mmol/L 0.125 –0.139
AST, U/L –0.049 0.047
ALT, U/L –0.308a –0.158
γ-GTP, U/L –0.229 –0.154
hs-CRP, mg/dL –0.211 –0.185
Ferritin, µg/L 0.162 –0.034
Two-hour glucose and 2-hour insulin represent glucose and insulin levels at 120 minutes after a glucose challenge. r refers to Pearson’s correlation coefficient.
NGT, normal glucose tolerance; BMI, body mass index; WC, waist circumference; HC, hip circumference; SBP, systolic blood pressure; DBP, diastolic blood pressure; HbA1c, glycated hemoglobin; HOMA-IR, homeostasis model assessment of insulin resistance; QUICKI, quantitative insulin sensitivity check index; TC, total cholesterol; TG, triglyceride; HDL-C, high density lipoprotein cholesterol; LDL-C, low density lipoprotein cholesterol; AST, aspartate aminotransferase;
ALT, alanine aminotransferase; γ-GTP, gamma-glutamyl transpepti -dase; hs-CRP, high-sensitivity C-reactive protein.
fat ratio—were significantly higher in prediabetic females but not males. It is possible that changes in the hormonal status of females during menopause and aging result in increases in measures of central fat distribution and visceral fat accumula-tion. Previous studies have shown that testosterone decreases adiponectin levels [17] and that the adiponectin levels of males are lower than those of females [16-19]. However, in the pres-ent study, the adiponectin levels of males were higher than those of females. It has been demonstrated that effective estra-diol treatment decreases adiponectin levels in postmenopausal females [20,21] and the present study indicates that a higher visceral fat ratio and higher BMI, WC, and visceral fat levels in females influence adiponectin levels.
Clinical and experimental studies have indicated that adipo-nectin directly affects obesity-related disorders, insulin resis-tance, and atherosclerosis [22-25]. Additionally, it is known that adiponectin plays an essential role in the development of MetS because there is a general correlation between MetS and plasma adiponectin levels in normal healthy subjects [26]. Fur-thermore, large population-based studies have shown that adi-ponectin levels in individuals with IFG and MetS are signifi-cantly lower than those of subjects with IFG but without MetS [12]. Similarly, the present study found that elderly prediabetic subjects with MetS had lower levels of adiponectin than the prediabetic subjects without MetS (11.10±4.62 μg/mL vs.
8.61±3.48 μg/mL, respectively; P<0.02). Additionally, the
as-sociations between the metabolic parameters and plasma adi-ponectin levels of IFG and NGT subjects in the present study were similar to those reported in previous studies [12,20] Low adiponectin levels likely play a major role in the devel-opment of MetS [27,28]. A prospective cohort study that ana-lyzed 372 elderly subjects divided into tertiles based on adipo-nectin levels found that individuals in the lowest tertile were 3.2-fold more likely to develop T2DM (95% confidence inter-val [CI], 1.415 to 7.295; P=0.005) and 2.7-fold more likely to
develop MetS (95% CI, 0.94 to 6.70; P=0.031) than subjects
in the highest tertile [11]. A study of 661 Japanese individuals reported that the components of MetS increased as adiponectin levels decrease [29] and a study of 596 healthy Korean subjects observed an association between low adiponectin levels and MetS [26]. However, in the present study, the elderly subjects with low adiponectin levels only showed significant increases in their waist-to-hip ratio and 2-hour insulin levels.
Many studies have found a correlation between plasma adi-ponectin levels and the metabolic profiles of various popula-tions, including normal healthy adults, adults with central obesi-P<0.05), WC (r=–0.282, P<0.05), waist-to-hip ratio (r=–0.321,
P<0.01), visceral fat (r=–0.306 0, P<0.01), the visceral fat ratio
(r=–0.326, P<0.01), and the 2-hour insulin levels (r=–0.242, P<0.05). In the elderly NGT subjects, adiponectin levels were
in-versely correlated with total body fat (r=–0.255, P<0.05),
vis-ceral fat (r=–0.309, P<0.05), the visceral fat ratio (r=–0.268, P<0.05), total muscle (r=–0.311, P<0.05), alanine
aminotrans-ferase levels (r=–0.308, P<0.05) but positively correlated with
TG (r=0.355, P<0.01) and HDL-C (r=0.242, P<0.05) levels.
DISCUSSION
The findings of the present study clearly demonstrated that in-creased insulin resistance and MetS were related to low adipo-nectin levels in elderly prediabetic patients. Additionally, the plasma adiponectin levels of these patients were correlated with the waist-to-hip ratio, visceral fat, and the visceral fat ra-tio, which are indicators of central obesity.
Many studies have reported that plasma adiponectin levels decrease as insulin resistance increases. For example, diabetic and obese monkeys have decreased adiponectin levels prior to the development of diabetes, and this decrease in adiponectin levels parallels changes in insulin sensitivity [15]. In a study of 376 prediabetic patients, the prediabetic group exhibited a sig-nificantly lower mean±SD adiponectin level compared to NGT
subjects (4.6±2.3 μg/mL vs. 5.0±2.8 μg/mL in males, and
7.1±3.6 μg/mL vs. 8.1±4.6 μg/mL in females, respectively;
P<0.001) [16]. Similarly, in the present study elderly
prediabet-ic patients had signifprediabet-icantly lower adiponectin levels than elder-ly individuals with NGT (10.2±4.3 μg/mL vs. 12.7±4.7 μg/
mL, respectively; P<0.001).
Additionally, there were significant differences between the visceral fat level and visceral fat ratio of elderly prediabetic sub-jects and elderly NGT subsub-jects. This finding suggests that, simi-lar to the general population, the accumulation of visceral fat was related to insulin resistance in elderly prediabetic patients. Additionally, the BP, baPWV, and lipid profiles of the elderly prediabetic subjects exhibited significant increases compared to those of the elderly NGT subjects. This suggests that a predia-betes status in elderly patients is associated with the risk of CVD and metabolic diseases.
ty, individuals with IFG, and T2DM patients [11,12,30-34]. In a majority of these studies, adiponectin levels were found to be correlated with metabolic parameters and serum biomarkers of insulin resistance or the risk of CVD. However, in the present study, adiponectin levels were negatively correlated with BMI, WC, the waist-to-hip ratio, visceral fat, the visceral fat ratio, and 2-hour insulin levels. Therefore, central obesity, particularly in conjunction with the accumulation of visceral fat, had the high-est correlation with adiponectin levels in elderly prediabetic pa-tients.
The present study has several limitations. First, the cross-sec-tional design and small sample size of this study meant that data regarding the exact predictive values of adiponectin levels in terms of the risks of T2DM and CVD or changes in adiponectin within specific individuals could not be obtained. Second, the present study was unable to adjust for MetS-related lifestyle factors. Nevertheless, this study is the first to investigate the re-lationships between various metabolic parameters and adipo-nectin levels in elderly prediabetic subjects.
In conclusion, the present study found that the clinical and biochemical characteristics associated with adiponectin levels in elderly prediabetic subjects were similar to those of predia-betic subjects of all ages, with only a few exceptions. Large-scale longitudinal prospective studies are needed to clarify the role of adiponectin in the development of T2DM and CVD.
CONFLICTS OF INTEREST
No potential conflict of interest relevant to this article was re-ported.
ACKNOWLEDGMENTS
This work was supported by the research fund of Chungnam National University.
REFERENCES
1. Cowie CC, Rust KF, Ford ES, Eberhardt MS, Byrd-Holt DD, Li C, et al. Full accounting of diabetes and pre-diabe-tes in the U.S. population in 1988-1994 and 2005-2006. Di-abetes Care 2009;32:287-94.
2. Gill T. Epidemiology and health impact of obesity: an Asia Pacific perspective. Asia Pac J Clin Nutr 2006;15 Suppl: 3-14.
3. Kim CS, Ko SH, Kwon HS, Kim NH, Kim JH, Lim S, et al.
Prevalence, awareness, and management of obesity in Ko-rea: data from the Korea National Health and Nutrition Ex-amination Survey (1998-2011). Diabetes Metab J 2014;38: 35-43.
4. Ginter E, Simko V. Diabetes type 2 pandemic in 21st centu-ry. Bratisl Lek Listy 2010;111:134-7.
5. Koh-Banerjee P, Wang Y, Hu FB, Spiegelman D, Willett WC, Rimm EB. Changes in body weight and body fat dis-tribution as risk factors for clinical diabetes in US men. Am J Epidemiol 2004;159:1150-9.
6. Walker SP, Rimm EB, Ascherio A, Kawachi I, Stampfer MJ, Willett WC. Body size and fat distribution as predictors of stroke among US men. Am J Epidemiol 1996;144:1143-50.
7. Combs TP, Berg AH, Obici S, Scherer PE, Rossetti L. En-dogenous glucose production is inhibited by the adipose-derived protein Acrp30. J Clin Invest 2001;108:1875-81. 8. Tilg H, Moschen AR. Role of adiponectin and
PBEF/visfa-tin as regulators of inflammation: involvement in obesity-associated diseases. Clin Sci (Lond) 2008;114:275-88. 9. Yang WS, Lee WJ, Funahashi T, Tanaka S, Matsuzawa Y,
Chao CL, et al. Weight reduction increases plasma levels of an adipose-derived anti-inflammatory protein, adiponectin. J Clin Endocrinol Metab 2001; 86:3815-9.
10. Maeda N, Takahashi M, Funahashi T, Kihara S, Nishizawa H, Kishida K, et al. PPARgamma ligands increase expres-sion and plasma concentrations of adiponectin, an adipose-derived protein. Diabetes 2001;50:2094-9.
11. Choi KM, Lee J, Lee KW, Seo JA, Oh JH, Kim SG, et al. Serum adiponectin concentrations predict the developments of type 2 diabetes and the metabolic syndrome in elderly Koreans. Clin Endocrinol (Oxf) 2004;61:75-80.
12. Nam JS, Park JS, Cho MH, Jee SH, Lee HS, Ahn CW, et al. The association between pulse wave velocity and metabolic syndrome and adiponectin in patients with impaired fasting glucose: cardiovascular risks and adiponectin in IFG. Dia-betes Res Clin Pract 2009;84:145-51.
13. Alberti KG, Eckel RH, Grundy SM, Zimmet PZ, Cleeman JI, Donato KA, et al. Harmonizing the metabolic syndrome: a joint interim statement of the International Diabetes Fed-eration Task Force on Epidemiology and Prevention; Na-tional Heart, Lung, and Blood Institute; American Heart As-sociation; World Heart Federation; International Atheroscle-rosis Society; and International Association for the Study of Obesity. Circulation 2009;120:1640-5.
in diabetes: 2014. Diabetes Care 2014;37 Suppl 1:S14-80. 15. Hotta K, Funahashi T, Bodkin NL, Ortmeyer HK, Arita Y,
Hansen BC, et al. Circulating concentrations of the adipo-cyte protein adiponectin are decreased in parallel with re-duced insulin sensitivity during the progression to type 2 diabetes in rhesus monkeys. Diabetes 2001;50:1126-33. 16. Saltevo J, Kautiainen H, Vanhala M. Gender differences in
adiponectin and low-grade inflammation among individu-als with normal glucose tolerance, prediabetes, and type 2 diabetes. Gend Med 2009;6:463-70.
17. Nishizawa H, Shimomura I, Kishida K, Maeda N, Kuriya-ma H, Nagaretani H, et al. Androgens decrease plasKuriya-ma adi-ponectin, an insulin-sensitizing adipocyte-derived protein. Diabetes 2002;51:2734-41.
18. Cnop M, Havel PJ, Utzschneider KM, Carr DB, Sinha MK, Boyko EJ, et al. Relationship of adiponectin to body fat dis-tribution, insulin sensitivity and plasma lipoproteins: evi-dence for independent roles of age and sex. Diabetologia 2003;46:459-69.
19. Snehalatha C, Mukesh B, Simon M, Viswanathan V, Haff-ner SM, Ramachandran A. Plasma adiponectin is an inde-pendent predictor of type 2 diabetes in Asian indians. Dia-betes Care 2003;26:3226-9.
20. Laughlin GA, Barrett-Connor E, May S. Sex-specific deter-minants of serum adiponectin in older adults: the role of endogenous sex hormones. Int J Obes (Lond) 2007;31:457-65.
21. Morad V, Abrahamsson A, Dabrosin C. Estradiol affects extracellular leptin:adiponectin ratio in human breast tissue in vivo. J Clin Endocrinol Metab 2014;99:3460-7.
22. Ziemke F, Mantzoros CS. Adiponectin in insulin resistance: lessons from translational research. Am J Clin Nutr 2010;91: 258S-61S.
23. Villarreal-Molina MT, Antuna-Puente B. Adiponectin: anti-inflammatory and cardioprotective effects. Biochimie 2012; 94:2143-9.
24. Ouchi N, Walsh K. Adiponectin as an anti-inflammatory factor. Clin Chim Acta 2007;380:24-30.
25. Calton EK, Miller VS, Soares MJ. Factors determining the risk of the metabolic syndrome: is there a central role for
adiponectin? Eur J Clin Nutr 2013;67:485-91.
26. Yoo KH, Oh IM, Park JE, Kim MJ, Park JS, Park SJ, et al. Metabolic syndrome is associated with low adiponectin level and increased insulin resistance in apparently healthy Koreans. Korean J Obes 2012;21:175-82.
27. Nigro E, Scudiero O, Monaco ML, Palmieri A, Mazzarella G, Costagliola C, et al. New insight into adiponectin role in obe-sity and obeobe-sity-related diseases. Biomed Res Int 2014;2014: 658913.
28. Hulthe J, Hulten LM, Fagerberg B. Low adipocyte-derived plasma protein adiponectin concentrations are associated with the metabolic syndrome and small dense low-density lipoprotein particles: atherosclerosis and insulin resistance study. Metabolism 2003;52:1612-4.
29. Ryo M, Nakamura T, Kihara S, Kumada M, Shibazaki S, Takahashi M, et al. Adiponectin as a biomarker of the meta-bolic syndrome. Circ J 2004;68:975-81.
30. De Rosa A, Monaco ML, Capasso M, Forestieri P, Pilone V, Nardelli C, et al. Adiponectin oligomers as potential indica-tors of adipose tissue improvement in obese subjects. Eur J Endocrinol 2013;169:37-43.
31. Hamilton MP, Gore MO, Ayers CR, Xinyu W, McGuire DK, Scherer PE. Adiponectin and cardiovascular risk pro-file in patients with type 2 diabetes mellitus: parameters as-sociated with adiponectin complex distribution. Diab Vasc Dis Res 2011;8:190-4.
32. Mohan V, Deepa R, Pradeepa R, Vimaleswaran KS, Mohan A, Velmurugan K, et al. Association of low adiponectin lev-els with the metabolic syndrome: the Chennai Urban Rural Epidemiology Study (CURES-4). Metabolism 2005;54: 476-81.
33. Hung J, McQuillan BM, Thompson PL, Beilby JP. Circu-lating adiponectin levels associate with inflammatory mark-ers, insulin resistance and metabolic syndrome independent of obesity. Int J Obes (Lond) 2008;32:772-9.