D I A B E T E S & M E T A B O L I S M J O U R N A L
his is an Open Access article distributed under the terms of the Creative Commons At-tribution Non-Commercial License (http://creativecommons.org/licenses/by-nc/3.0/) which permits unrestricted non-commercial use, distribution, and reproduction in any medium, provided the original work is properly cited.
Efects of High Performance Inulin Supplementation
on Glycemic Control and Antioxidant Status in Women
with Type 2 Diabetes
Bahram Pourghassem Gargari1, Parvin Dehghan2, Akbar Aliasgharzadeh3, Mohammad Asghari Jafar-abadi4
1Department of Biochemistry and Diet herapy, Nutrition Research Center, Tabriz University of Medical Sciences, 2Student Research Center, Faculty of Health and Nutrition, Tabriz University of Medical Sciences,
3Endocrine and Metabolism Section, Imam Reza Teaching Hospital, Faculty of Medicine, Tabriz University of Medical Sciences, 4Department of Statistic and Epidemiology, Faculty of Health and Nutrition, Tabriz University of Medical Sciences, Tabriz, Iran
Background: he purpose of this study was to evaluate the efects of high performance inulin supplementation on blood glyce-mic control and antioxidant status in women with type 2 diabetes.
Methods: In a randomized, triple-blind controlled trial, 49 females (iber intake <30 g/day, 25<body mass index<35 kg/m2)
with type 2 diabetes were recruited from the Iran Diabetes Society and from endocrinology and metabolism clinics associated with the Tabriz University of Medical Science. he participants were divided into one of two groups in which the participants ei-ther received 10 g/day of inulin (intervention, n=24) or maltodextrin (control, n=25) for 2 months. Fasting blood samples were obtained and both glycemic control and antioxidant status were determined at baseline and at the end of the study.
Results: At the end of the study period, there were signiicant decreases in fasting plasma glucose (8.47%), glycosylated hemo-globin (10.43%), and malondialdehyde (37.21%) levels and signiicant increases in total antioxidant capacity (18.82%) and su-peroxide dismutase activity (4.36%) in the inulin group when compared to the maltodextrin group (P<0.05). Changes in fasting insulin, homeostasis model assessment of insulin resistance, and catalase activity were not signiicant in the inulin group when compared with the maltodextrin group. Glutathione peroxidase activity remained unchanged in both groups.
Conclusion: Inulin supplementation may improve some glycemic and antioxidant indices and decrease malondialdehyde levels in women with type 2 diabetes. Further investigations are needed in order to conirm the positive efects that inulin may have on the glycemic and antioxidant indices of patients with type 2 diabetes.
Keywords: Antioxidants; Diabetes mellitus, type 2; Insulin resistance; Inulin; Malondialdehyde
Corresponding author: Parvin Dehghan
Student Research Center, Faculty of Health and Nutrition, Tabriz University of Medical Sciences, Attar Nishaboori St., Golghasht St., Tabriz 51664, Iran E-mail:[email protected]
INTRODUCTION
Diabetes mellitus (DM) is a common health problem and is the main cause of morbidity in developing and developed coun-tries. he number of people with diabetes is gradually increas-ing, and its prevalence was reported to be 171 million people in 2000. It is estimated that at least 366 million people will sufer from DM by the year 2030 [1]. In 2010, the prevalence of DM was 8% and its health expenditure was equal to 600 million
U.S. dollars in the country of Iran [2]. DM is a metabolic dis-ease that is characterized by the existence of hyperglycemia along with having biochemical alterations of glucose, lipid pro-ile, lipid peroxidation, insulin resistance and β-cell dysfunc-tion [3]. Prolonged exposure to hyperglycemia causes oxidative stress and an imbalance of the oxidant/antioxidant status. Oxi-dative stress has been suggested to play a key role in the patho-physiology of type 2 diabetes and its complications [4]. Nowadays, functional foods are of interest due to their po-http://dx.doi.org/10.4093/dmj.2013.37.2.140
tential health beneits [5]. he potential consequence of oxida-tive stress could be attenuated by the dietary consumption of functional foods. Inulin-type fructans, a well-deined type of functional foods, are naturally found in vegetables and fruits such as: onions, garlic, chicory root, banana, and wheat, and are used as prebiotic and dietary iber in various food items. Inulin-type fructans are indigestible carbohydrates, contain fructose monomers that are linked by β (1→2) bounds, and are arranged as nonviscous, soluble, and fermentable ibers. High performance (HP) inulin is a prebiotic that has a long-chain, high-molecular weight mixes of inulin-type fructans, without any fructans that have a degree of polymerization <10 [5]. This type of inulin is incorporated into baked goods, milk products, drinks, and desserts as a substitute for sugar and/or fat [6]. HP Inulin has a speciic colonic fermentation property that is able to change the composition of the gut microlora to-ward biidobacteria. Ingestion of 5 to 8 g/day of inulin should be suicient to exhibit a positive efect on the gut microlora. Possible side efects of inulin-type fructans can be seen at dos-es that are higher than 20 g/day [5].
he efects that inulin-type fructans have on reducing blood glucose and oxidative stress has been shown in previous ani-mal based studies [7,8]. To our knowledge, all of the human studies to date have only assessed the efects of fructooligosac-charides (FOS), which have a lower molecular weight than HP inulin, on diabetic patients and that there has been no study that has yet assessed the efects of HP inulin on diabetic tients [9-11]. The results of the FOS studies on diabetic pa-tients have been inconsistent. Yamashita et al. [9] has shown that beneicial efects of oligofructose exist in regards to the blood glucose and lipid proile of diabetic patients. In contrast, a couple of other studies have failed to show any beneicial ef-fects of inulin-type fructans in diabetic patients [10,11]. Due to the probably beneicial efects of inulin-type fructans, es-pecially on the carbohydrate metabolism [9, 12] and the anti-oxidant status [7,8], and the scarcity of data that exist on the HP inulin efect on glycemic and antioxidant status, the pres-ent study was designed to assess the hypoglycemic and antiox-idant efects of HP inulin in women with type 2 diabetes.
METHODS
Subjects
Sixty-ive females with DM that were between the ages of 20 and 65 years of age had participated in the study. Participants
were recruited from the Iranian Diabetic Society and from en-docrinology and metabolism clinics that were associated with the Tabriz University of Medical Science. Inclusion criteria was deined as: having DM for more than 6 months, currently having anti-diabetic treatment, having a stable diet and a body mass index (BMI) >25 kg/m2 for the past 3 months. DM was
deined as having a fasting glucose level that is ≥126 mg/dL [13]. Subjects were excluded if they had a history of gastroin-testinal, pancreatic, or cardiovascular disease, renal, thyroid or liver disturbance, being pregnant or lactating, consuming pre-biotics, or propre-biotics, antipre-biotics, antacids, alcohol, antidiar-rheal, anti-inlammatory or laxatives drugs, or lipid-lowering medications 2 months prior to the intervention or during the intervention, or if the individual had a typical iber intake >30 g. Prior to the intervention, an appointment time was set for each subjects to provide study information and to complete their individual questionnaire and to provide their written in-formed consent. Demographic data including age, medica-tion, and diabetes duration (in years) was obtained by using the questionnaire. The study was approved by the Ethical Committee of the Tabriz University of Medical Sciences and it was registered on the Iranian Registry of Clinical Trials web-site (http://www.irct.ir/, IRCT201110293253N4).
Experimental design
he phone number of the researcher was provided to all of the participants to help answer any question or concerns that may arise throughout the intervention. Subjects were recommend-ed to return all of their packets regardless of whether they were (full or empty) in order to assess the consumption status of each participant. The volunteers were recommended to have stable physical activity throughout the duration of the study. A diagram of the study design is shown in Fig. 1.
Body weight and food intake assessment
A research assistant measured the anthropometric indices, in-cluding body weight and height, at the beginning and at the end of the trial. Weight was measured to the nearest 0.1 kg, and the height was measured, to the nearest 0.1 cm. BMI was calculated as weight in kilograms divided by the square of the height in meters. Nutrient intake data was also collected at the beginning and at the end of the trial period. Diet evaluations were performed with the use of 3-day diet record at the base-line and at the end of the study. All of the subjects attended a training meeting prior to the start of the intervention where they were instructed on how to properly use the food scale and record their food intake. Subjects were instructed to report all of the food they had consumed for 2-week days and 1-week-end day at the beginning and at the 1-week-end of the study. Dietary data were analyzed using the Nutritionist 4 sotware (First Da-tabank Inc., Hearst Corp., San Bruno, CA, USA).
Blood sampling and biochemical assays
At the beginning and at the end of the trial period, 10 mL of venous blood were collected between 7:00 to 9:00 AM ater an overnight fast, into two vacutainer tubes, in which one tube contained ethylene-diamine-tetraacetic acid in order to mea-sure the blood levels of glycosylated hemoglobin (HbA1c) and the other tube contained sodium fluoride in order to deter-mine glucose, insulin and antioxidant indices including the total antioxidant capacity (TAC), superoxide dismutase (SOD), glutathione peroxidase (GSH-Px), catalase, and malo-ndialdehyde (MDA). The serum and plasma samples were separated from whole blood by centrifugation at 2,500 rpm for 10 minutes (Beckman Avanti J-25; Beckman Coulter, Brea, CA, USA) at room temperature. The serum samples were stored at -20°C immediately after centrifugation until they were used for their respective assays. Fasting plasma glucose (FPG), HbA1c, and insulin were analyzed on the day of sam-pling. FPG was measured by using the enzymatic method us-ing an Abbot Model Aclyon 300, USA autoanalyzer with kits from Pars-Azmone (Tehran, Iran). HbA1c was determined using the sample of whole blood by using an automated HP liquid chromatography analyzer with commercially available kits from Bio-Rad D-10 Laboratories, Schiltigheim, France. Serum insulin was measured using the chemiluminescent im-munoassay method (LIAISON analyzer 310360; Diasorin S.P.A, Verecelli, Italy).
Homeostasis model assessment of insulin resistance (HOMA-IR) was calculated according to the following formula: [fasting insulin (μU/mL)×FPG (mg/dL)]/405 [14]. Measurement of TAC in serum and SOD and GSH-Px in whole blood was per-formed by using the colorimetric method with commercial kits (TAS, RANDOX kits; SOD, RANSOD kits; and GSH-Px, RAN-SEL kits; RANDOX Laboratory, Crumlin, UK), on an automatic analyzer (Abbott model Alcyon 300; Abbott Laboratories, Ab-bott Park, IL, USA). he serum MDA level, which is used as a marker for lipid peroxidation and oxidative stress, was measured by using a reaction with thiobarbituric acid (TBA) as a TBA re-active substance (TBARS) in order to produce a pink colored complex. his luorescence intensity was measured at 547 nm with an excitation at 525 nm with a spectroluorimeter (model SFM 25A; Kontron, Milan, Italy) [15]. Catalase activity was esti-mated using the method described by Aebi [16]. Catalase can degrade H202 and this can be measured directly by the reduc-tion in the absorbance at 240 nm. he H202 was diluted with phosphate bufer that was at a pH 7.0 and its initial absorbance Fig. 1. Study design.
65 Women assessed for eligibility
11 Did not meet the criteria for study
54 Randomized
24 Completed 25 Completed
2 Medication change 1 Moved
was adjusted between 0.5 to 0.6 absorbance units at 240 nm. he reduction in the absorbance was measured. One unit of catalase activity was deined as the amount of catalase that is fully ab-sorbed in 30 seconds at 25°C. he catalase activity was then cal-culated from the change in absorbance and was inally expressed as units per milliliter [16].
Statistical analysis
Data were analyzed using the SPSS sotware version 17.0 (SPSS Inc., Chicago, IL, USA). he results were expressed as mean± standard deviation. The normality of the distribution of data was evaluated by the one-sample Kolmogorov-Smirnov test. For quantitative variables, paired and unpaired sample t-tests were used for means comparisons. he medications used in the two groups were compared using the Mann-Whitney U test. Anal-ysis of covariance (ANCOVA) was used to identify any difer-ences between the two groups ater intervention, and was adjust-ed for the baseline measurements and covariates. Diferences with a P<0.05 were considered to be statistically signiicant.
RESULTS
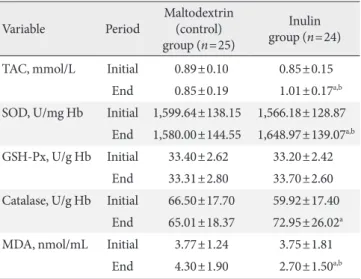
Of the 65 participants that were assessed for study eligibility, 49 of the participants completed the study (inulin group, 24; placebo group, 25) (Fig. 1). Participants did not report any ad-verse effects or symptoms with the inulin supplementation. Table 1 shows the baseline characteristics of the participants in the two groups. he two groups were similar in their initial characteristics.
Efect of inulin supplementation on body weight and dietary intakes
he comparisons between the two groups showed that there were no signiicant diferences in regards to the baseline body weight and the BMI (Table 1). he dietary intake of the mac-ronutrients is shown in Table 2. he comparison between the baseline dietary intakes of the two groups showed that there was no signiicant diferences in the energy or the macronutri-ents intake, with the exception of dietary iber which was sig-niicantly higher in the maltodextrin group.
After 2 months of supplementation, the body weight and BMI remained unchanged in the maltodextrin group, while both the body weight and BMI signiicantly decreased in the inulin group (75.40 ±11.31 to 72.85 ±11.16, 31.60 ±4.09 to 30.50±4.02, respectively; P<0.05). hese changes were signii-cant in the inulin group when compared to the baseline values (P<0.05). Intakes of energy, carbohydrate and total fat were signiicantly diferent between the two groups at the end of the study. In the inulin group the intake of energy and the total fat decreased signiicantly, while in the maltodextrin group they remained unchanged.
Efects of inulin supplementation on glycemic indices and oxidative stress parameters
At the beginning of the study, there were no signiicant difer-ences between the inulin group and the maltodextrin group in
Table 1. Baseline characteristics of the study participants
Characteristic
Maltodextrin (control) group (n=25)
Inulin group (n=24)
Age, yr 48.69±9.74 47.77±10.14
Weight, kg 70.53±11.05 75.40±11.31
Height, cm 153.50±6.50 154.40±5.82
BMI, kg/m2 29.90±4.24 31.61±4.09
Diabetes duration, yr 5.33±4.60 7.33±5.42
Metformin 500 mg, tablets/day 2.71±0.94 2.85±1.08
Glibenclamide 5 mg, tablets/day 1.96±1.17 2.29±0.99
Values are presented as mean±standard deviation. For all character-istics, there were no signiicant diferences between the maltodextrin and inulin groups (all P>0.05, based on independent samples t-tests).
BMI, body mass index.
Table 2. Daily dietary intake of participants at baseline and the end of the study
Variable Period
Maltodextrin (control) group (n=25)
Inulin group (n=24)
Energy, kcal Initial 1,770.17±205.60 1,693.60±250.57 End 1,798.23±238.95 1,417.86±236.70a,b
Carbohydrate, g Initial 224.71±47.93 203.00±64.31
End 223.31±37.40 175.92±50.34b
Protein, g Initial 54.85±11.86 51.25±15.23
End 55.33±14.70 54.23±12.18
Total fat, g Initial 52.91±13.34 54.31±12.15
End 51.83±14.91 45.62±8.70a,b
Dietary iber, g Initial 18.35±6.62 10.60±4.60c
End 14.92±3.95 12.95±4.30
Values are presented as mean±standard deviation.
aP<0.05, paired t-test, bP<0.05 analysis of covariance adjusted for
regards to the glycemic indices and the oxidative stress param-eters (Tables 3 and 4). At the end of the study, there was a sig-niicant decrease in the FPG (8.47%), HbA1c (10.43%), and MDA (37.21%) in the inulin group when compared to that of the maltodextrin group (P<0.05, ANCOVA when adjusted for dietary iber, energy changes, weight changes, and baselines values). We observed no signiicant reduction in the fasting insulin (34.32%) or the HOMA-IR (39.48%) in the inulin group when compared to the maltodextrin group (P>0.05, analysis of the covariance when adjusted for dietary iber, en-ergy changes, weight changes, and baselines values).
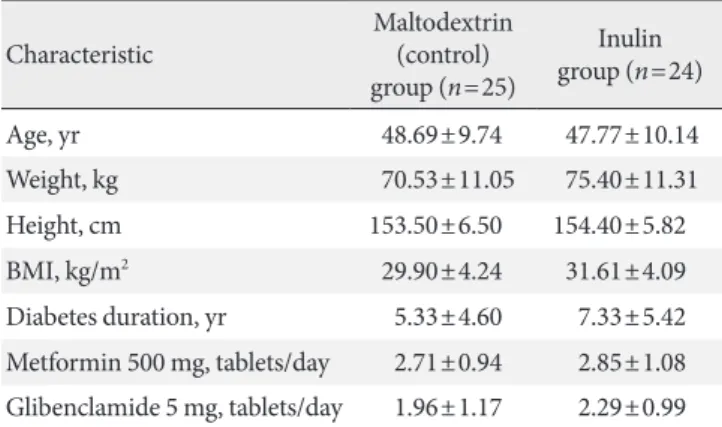
Inulin supplementation caused a 18.82% increase in the TAC and a 4.36% increase in the SOD when compared with the maltodextrin group ater adjusting for dietary iber, energy changes, weight changes and baselines values (P<0.05). The TAC levels increased (0.85±0.15 to 1.01±0.17 mmol/L) and the MDA levels decreased (3.75±1.81 to 2.70±1.50 nmol/mL) in the inulin group (P<0.05). Levels of catalase increased in the inulin group (P<0.05, paired t-test), but this change was not significant when compared to that of the maltodextrin group (P>0.05, ANCOVA adjusted for dietary fiber, energy changes, weight changes, and baseline values). GSH-Px activi-ty remained unchanged in both groups. In the maltodextrin group the TAC, MDA, SOD, and catalase changes that were observed were not signiicant.
DISCUSSION
High iber diets can be beneicial in the prevention and man-agement of diabetes. Some studies have reported that prebiotic ibers may have a dominant efect on the control of diabetes [17]. herefore, in this clinical trial, we investigated the efect that HP inulin supplementation has on glycemic indices and on antioxidant markers of type 2 diabetic patients. Our results showed that two months of HP inulin supplementation signif-icantly decreased body weight and BMI when compared to the group that received maltodextrin supplementation. Similar re-sults have been shown with oligofructose supplementation in animal studies and in studies with diabetic patients [11,18,19]. Parnell and Reimer [20] have reported that the supplementa-tion of healthy adults with oligofructose at a dose of 21 g/day for 12 weeks decreased body weight. In our study, the energy intake of the inulin group signiicantly decreased (1,693.60± 250.57 to 1,417.86±236.70, P<0.05). he exact mechanism(s) of weight reduction by inulin remains unclear. Some gut sati-ety hormones, especially those that are responsive to diet com-position, including glucagon-like peptide 1 (GLP-1), PYY, and ghrelin, are proposed to inluence weight reduction [21]. In order to consider weight reduction as a main
interven-Table 3. Efects of 2 months of inulin or maltodextrin supple-mentation on glycemic indices in studied subjects
Variable Period
Maltodextrin (control) group (n=25)
Inulin group (n=24)
FPG, mg/dL Initial 157.76±10.60 161.68±15.10
End 156.12±14.17 146.60±19.90a,b
HbA1c, % Initial 8.20±0.94 8.40±0.94
End 8.30±1.09 7.70±0.69a,b
Fasting insulin, µU/mL Initial 13.16±3.80 14.03±4.30
End 13.44±4.80 9.29±3.20a
HOMA-IR Initial 5.15±1.60 5.60±2.00a
End 5.20±1.60 3.40±1.40a
Values are presented as mean±standard deviation.
FPG, fasting plasma glucose; HbA1c, glycosylated hemoglobin; HOMA- IR, homeostasis model assessment of insulin resistance.
aP<0.05, paired t-test, bP<0.05 analysis of covariance adjusted for
di-etary iber, energy changes, weight changes, and baseline value.
Table 4. Efects of 2 months of inulin or maltodextrin supple-mentation on the antioxidative indices and MDA in studied subjects
Variable Period
Maltodextrin (control) group (n=25)
Inulin group (n=24)
TAC, mmol/L Initial 0.89±0.10 0.85±0.15
End 0.85±0.19 1.01±0.17a,b
SOD, U/mg Hb Initial 1,599.64±138.15 1,566.18±128.87
End 1,580.00±144.55 1,648.97±139.07a,b
GSH-Px, U/g Hb Initial 33.40±2.62 33.20±2.42
End 33.31±2.80 33.70±2.60
Catalase, U/g Hb Initial 66.50±17.70 59.92±17.40
End 65.01±18.37 72.95±26.02a
MDA, nmol/mL Initial 3.77±1.24 3.75±1.81
End 4.30±1.90 2.70±1.50a,b
Values are presented as mean±standard deviation.
MDA, malondialdehyde; TAC, total antioxidant status; SOD, super-oxide dismutase; GSH-Px, glutathione peroxidase.
aP<0.05, paired t-test, bP<0.05 analysis of covariance adjusted for
tional cause of observed changes in studied biochemical pa-rameters, we included it in the ANCOVA model as a con-founding factor. After the adjustment for weight reduction, and energy intake, we showed that 2 months of inulin supple-mentation reduced the FPG, HbA1c, fasting insulin, and HOMA-IR when compared to that of the maltodextrin group. here were no statistically signiicant diferences in the fasting insulin and HOMA-IR between the two groups.
To the best of our knowledge there have not been any stud-ies to date on the HP inulin effects in diabetic patients and there have only been three studies that have investigated the efects of fructans other than HP inulin on glucose and insulin in type 2 DM patients [9-11]. Yamashita et al. [9] have shown that oligofructose supplementation at a dose of 8 g/day for 2 weeks decreased the FPG levels in type 2 DM patients. Luo et al. [10] and Alles et al. [11] have reported that there were no signiicant changes that were observed with oligofructose sup-plementation, on FPG fasting insulin in patients with type 2 DM.
Jackson et al. [22] and Giacco et al. [23] have shown that prebiotic supplementation (10 g/day inulin for 8 weeks in healthy subjects and 10 g/day of short-chain-fructo-oligosac-charides for 2 months in individuals with mild hypercholes-terolaemia, respectively) decreased fasting insulin. Russo et al. [24] have reported that a signiicant decrease in HbA1c and HOMA-IR in healthy young volunteers can be achieved by in-troducing inulin-enriched pasta. he diferent results obtained in these studies may be explained by the dose and the kind of supplementation, pathologic state and basal levels of the glyce-mic indices of the type 2 DM patients being studied.
Several mechanisms have been proposed to explain the hy-poglycemic efect of ibers. Soluble ibers, such as inulin, can control or lower serum glucose by delaying gastric emptying, retarding entry of glucose into the blood stream, and reducing the post-meal rise of serum glucose [25]. Also, the modiica-tion of the secremodiica-tion of the gut hormones such as GLP-1 [26] and short-chain fatty acids (SCFA), which are produced from colonic fermentation of prebiotics [27], can afect serum glu-cose and insulin levels. SCFA may play a role in the so-called ileocolonic brake, which explains the inhibition of gastric emptying when nutrients reach the ileocolonic junction [27]. Oligofructose also increases glucose tolerance with increasing levels of GLP-1, plasma insulin, pancreatic insulin, and β-cell mass [19], as well as an increase of GLP-2 [18].
Lipid peroxidation is higher in type 2 DM patients. Reduced
lipid peroxidation and improved antioxidant status might be one of the mechanisms that may prevent and treat diabetic complications [28]. MDA is the main product of polyunsatu-rated fatty acids peroxidation in cells. MDA is a good marker of oxidative stress [29]. here are antioxidant systems that ight free-mediated damage. Antioxidant systems involve enzymes such as SOD, catalase, and GSH-Px as well as nonenzymatic substances such as vitamins and GSH [30].
here is consistent evidence that the total antioxidant status in type 1 or 2 DM is lower than that of age-matched controls [28]. We found signiicantly decreased levels of serum MDA in the inulin group when compared to that of the maltodex-trin group. Also, our study showed that inulin supplementa-tion signiicantly increased the TAC levels and SOD activity. Catalase levels increased in the inulin group (P<0.05, paired t -test), but it was not diferent when compared to the maltodex-trin group (P>0.05, unpaired t-test). he activity of GSH-Px did not signiicantly change in either group.
According to the review of the existing literature, there have been no studies on the efect that inulin may have on the anti-oxidant status of type 2 DM patients, and so we have reported the results of some similar studies. Wang et al. [31] have shown that 5% of xylooligosaccharides increase the activity of catalase, SOD, and GSH-Px and decreased MDA in rats. Rishi et al. [30] have shown that the activity of SOD and glutathione increased in mice treated with probiotics in conjunction with a prebiotic and observed a decrease in the activity of MDA. Baynes [32] has suggested that the supplementation of xylo-oligosaccharides reduces the activity of catalase and that it did not change the activity of SOD and GSH-Px in type 2 DM pa-tients. Gourineni et al. [33] have reported that dietary bioac-tive compounds such as prebiotics, their byproducts, and me-tabolites may increase the activity of glutathion-S-transferase, catalase, and SOD in prebiotic (synergy1)-fed mice. hese re-sults are in agreement with the rere-sults of our study.
SOD, catalase, and MDA remain unchanged in the dextrin or oligofructose groups [8]. hese diferent results may be related to dose and type of prebiotic, species, genotype of subject, bas-al antioxidant, and glycemic status, and pathologic state of the subjects.
he exact mechanisms of the fructans antioxidant properties remain unclear. Further research studies should be designed in order to obtain a precise perception of the mechanism(s) that are responsible for these potential beneicial efects of fructans against the complications of diabetes. Inulin-type fructans may act as antioxidant themselves and, they could act directly as re-active oxygen species (ROS) that indirectly scavenge through SCFAs and antioxidant enzymes [35]. One of the possible mechanisms is the prebiotics ability to modify microflora in the gastrointestinal tract. Gobinath et al. [36] have shown that the consumption of prebiotics, such as oligosaccharides and xylo-oligosaccharides, stimulate the growth of biidobacteria and lactobacicilli. Lactic acid bacteria have SOD and in vitro studies have shown that lactic acid per se and the fermenta-tions of FOS by deferent strains of biidobacteria lead to the elimination of free radicals [37]. Also, it may be that lactobacilli resident in gut lyses and release their intracellular antioxidative constituents that in turn help to decrease the MDA [31]. An-other possible mechanism may be due to the ability of prebiot-ics to modify gene expression of antioxidant enzymes. It is re-ported that the consumption of chicory reduces oxidative stress, restores GSH levels and induces gene expression, which results in the overexpression of the activity of the antioxidant enzyme catalase and in turn, up-regulating the endogenous antioxidant defense system [38]. It has been suggested that the consumption of inulin supplementation exerts these same sys-temic antioxidative effects in the colon. It is known that en-hanced concentrations of butyrate in colonic cells results in re-duced colonic myeloperoxidase activity and restored GSH concentration. Also, butyrate has been efective in controlling the enhancement of ROS levels and in decreasing ROS-medi-ated p42/44 MAPK phosphorylation [39]. Another mecha-nism that may have contributed to the antioxidant indices is the lowering of the formation of advanced glycation end prod-ucts (AGEs). Increased blood glucose levels could be due to oxidative stress and this would results in the formation of AGE products. It is suggested that the dietary oligosaccharides may reduce the oxidative stress by reducing the formation of these AGE products [38].
Our study did have some limitations, including a small
sam-ple size and a short intervention time. We did not measure se-rum fatty acids or take into consideration the glucose clamp. We also did not deine gut microlora changes with inulin sup-plementation. Measuring of other oxidative stress indices, such as F2-isoprostanes, could strengthen the results of our study.
In conclusion, the results of this study showed that inulin supplementation reduces body weight and improves glycemic indices, antioxidant indices, and the MDA levels in type 2 DM patients. hese indings suggest a safe and inexpensive inter-vention for the management of type 2 DM. Further investiga-tions are needed in order to conirm the positive efect that in-ulin had on the glycemic and antioxidant indices and the MDA in type 2 DM patients.
CONFLICTS OF INTEREST
No potential conlict of interest relevant to this article was re-ported.
ACKNOWLEDGMENTS
The authors would like to thank all of the patients for their participation in this study. hey would also like to thank Mr. Firuz Purrahim for his help in recruiting these participants and also to Mr. Amir M. Vatankhah for his technical assis-tance throughout this project. his research project was also inancially supported by the Health and Nutrition Faculty of the Nutrition Research Center and the Vice Chancellor of Re-search of the Tabriz University of Medical Sciences in Iran. his article was written based on the data from a PhD thesis on nutrition, which was registered in the Tabriz University of Medical Sciences.
REFERENCES
1. World Health Organization: Global strategy on diet, physical activity and health: diabetes. Available from: http://www.who. int/dietphysicalactivity/publications/en/ (updated 2008 Feb 1). 2. Golozar A, Khademi H, Kamangar F, Poutschi H, Islami F, Ab-net CC, Freedman ND, Taylor PR, Pharoah P, Bofetta P, Bren-nan PJ, Dawsey SM, Malekzadeh R, Etemadi A. Diabetes mel-litus and its correlates in an Iranian adult population. PLoS One 2011;6:e26725.
4. Ramakrishna V, Jailkhani R. Oxidative stress in non-insulin-dependent diabetes mellitus (NIDDM) patients. Acta Diabetol 2008;45:41-6.
5. Kolida S, Gibson GR. Prebiotic capacity of inulin-type fructans. J Nutr 2007;137(11 Suppl):2503S-6S.
6. Franck A. Technological functionality of inulin and oligofruc-tose. Br J Nutr 2002;87 Suppl 2:S287-91.
7. Zary-Sikorska E, Juskiewicz J. Efect of fructans with diferent degrees of polymerization on bacterial enzymes activity, lipid proile and antioxidant status in rats. Pol J Food Nutr Sci 2008; 58:269-72.
8. Kozmus CE, Moura E, Serrao MP, Real H, Guimaraes JT, Guedes-de-Pinho P, Duarte BP, Marques F, Martins MJ, Vieira-Coelho MA. Inluence of dietary supplementation with dextrin or oligo-fructose on the hepatic redox balance in rats. Mol Nutr Food Res 2011;55:1735-9.
9. Yamashita K, Kawai K, Itakura M. Efects of fructo-oligosac-charides on blood glucose and serum lipids in diabetic sub-jects. Nutr Res 1984;4:961-6.
10. Luo J, Van Yperselle M, Rizkalla SW, Rossi F, Bornet FR, Slama G. Chronic consumption of short-chain fructooligosaccha-rides does not afect basal hepatic glucose production or insu-lin resistance in type 2 diabetics. J Nutr 2000;130:1572-7. 11. Alles MS, de Roos NM, Bakx JC, van de Lisdonk E, Zock PL,
Hautvast GA. Consumption of fructooligosaccharides does not favorably afect blood glucose and serum lipid concentra-tions in patients with type 2 diabetes. Am J Clin Nutr 1999;69: 64-9.
12. Bonsu NK, Johnson CS, McLeod KM. Can dietary fructans lower serum glucose? J Diabetes 2011;3:58-66.
13. American Diabetes Association: Diabetes Information: all about diabetes. Available from: http://www.diabetes.org/about-diabe-tes.jsp (updated 2009 Jun 1).
14. Matthews DR, Hosker JP, Rudenski AS, Naylor BA, Treacher DF, Turner RC. Homeostasis model assessment: insulin resis-tance and beta-cell function from fasting plasma glucose and insulin concentrations in man. Diabetologia 1985;28:412-9. 15. Del Rio D, Pellegrini N, Colombi B, Bianchi M, Serafini M,
Torta F, Tegoni M, Musci M, Brighenti F. Rapid luorimetric method to detect total plasma malondialdehyde with mild de-rivatization conditions. Clin Chem 2003;49:690-2.
16. Aebi H. Catalase in vitro. Methods Enzymol 1984;105:121-6. 17. Anderson JW, Baird P, Davis RH Jr, Ferreri S, Knudtson M,
Koraym A, Waters V, Williams CL. Health beneits of dietary iber. Nutr Rev 2009;67:188-205.
18. Cani PD, Daubioul CA, Reusens B, Remacle C, Catillon G, Delzenne NM. Involvement of endogenous glucagon-like pep-tide-1(7-36) amide on glycaemia-lowering efect of oligofruc-tose in streptozotocin-treated rats. J Endocrinol 2005;185:457-65.
19. Cani PD, Knauf C, Iglesias MA, Drucker DJ, Delzenne NM, Burcelin R. Improvement of glucose tolerance and hepatic in-sulin sensitivity by oligofructose requires a functional gluca-gon-like peptide 1 receptor. Diabetes 2006;55:1484-90. 20. Parnell JA, Reimer RA. Weight loss during oligofructose
supple-mentation is associated with decreased ghrelin and increased peptide YY in overweight and obese adults. Am J Clin Nutr 2009;89:1751-9.
21. Delzenne NM, Cani PD, Daubioul C, Neyrinck AM. Impact of inulin and oligofructose on gastrointestinal peptides. Br J Nutr 2005;93 Suppl 1:S157-61.
22. Jackson KG, Taylor GR, Clohessy AM, Williams CM. he ef-fect of the daily intake of inulin on fasting lipid, insulin and glucose concentrations in middle-aged men and women. Br J Nutr 1999;82:23-30.
23. Giacco R, Clemente G, Luongo D, Lasorella G, Fiume I, Brouns F, Bornet F, Patti L, Cipriano P, Rivellese AA, Riccardi G. Ef-fects of short-chain fructo-oligosaccharides on glucose and lip-id metabolism in mild hypercholesterolaemic indivlip-iduals. Clin Nutr 2004;23:331-40.
24. Russo F, Riezzo G, Chiloiro M, De Michele G, Chimienti G, Marconi E, D’Attoma B, Linsalata M, Clemente C. Metabolic efects of a diet with inulin-enriched pasta in healthy young volunteers. Curr Pharm Des 2010;16:825-31.
25. Canadian Diabetes Association: The benefits of eating fiber. Available from: http://www.diabetes.ca/section_about/fiber. asp (updated 2007 Nov 18).
26. Cani PD, Delzenne NM. he role of the gut microbiota in en-ergy metabolism and metabolic disease. Curr Pharm Des 2009; 15:1546-58.
27. Cherbut C. Motor efects of short-chain fatty acids and lactate in the gastrointestinal tract. Proc Nutr Soc 2003;62:95-9. 28. Sheu WH, Lee IT, Chen W, Chan YC. Efects of
xylooligosac-charides in type 2 diabetes mellitus. J Nutr Sci Vitaminol (To-kyo) 2008;54:396-401.
29. Del Rio D, Stewart AJ, Pellegrini N. A review of recent studies on malondialdehyde as toxic molecule and biological marker of oxidative stress. Nutr Metab Cardiovasc Dis 2005;15:316-28. 30. Rishi P, Mavi SK, Bharrhan S, Shukla G, Tewari R. Protective
Salmonella-induced liver damage. FEMS Microbiol Ecol 2009; 69:222-30.
31. Wang J, Cao Y, Wang C, Sun B. Wheat bran xylooligosaccha-rides improve blood lipid metabolism and antioxidant status in rats fed a high-fat diet. Carbohydr Polym 2011;86:1192-7. 32. Baynes JW. Role of oxidative stress in development of
compli-cations in diabetes. Diabetes 1991;40:405-12.
33. Gourineni VP, Verghese M, Boateng J, Shackelford L, Bhat KN. Chemopreventive potential of synergy1 and soybean in reducing azoxymethane-induced aberrant crypt foci in isher 344 male rats. J Nutr Metab 2011;2011:983038.
34. Seidel C, Boehm V, Vogelsang H, Wagner A, Persin C, Glei M, Pool-Zobel BL, Jahreis G. Inluence of prebiotics and antioxi-dants in bread on the immune system, antioxidative status and antioxidative capacity in male smokers and non-smokers. Br J Nutr 2007;97:349-56.
35. Van den Ende W, Peshev D, De Gara L. Disease prevention by natural antioxidants and prebiotics acting as ROS scavengers
in the gastrointestinal tract. Trends Food Sci Technol 2011;22: 689-97.
36. Gobinath D, Madhu AN, Prashant G, Srinivasan K, Prapulla SG. Beneicial efect of xylo-oligosaccharides and fructo-oligo-saccharides in streptozotocin-induced diabetic rats. Br J Nutr 2010;104:40-7.
37. Zhang Y, Du R, Wang L, Zhang H. he antioxidative efects of probiotic Lactobacillus casei Zhang on the hyperlipidemic rats. Eur Food Res Technol 2010;231:151-8.
38. Hassan HA, Yousef MI. Ameliorating efect of chicory (Cicho-rium intybus L.)-supplemented diet against nitrosamine pre-cursors-induced liver injury and oxidative stress in male rats. Food Chem Toxicol 2010;48:2163-9.