Journal of Public Health
Universidade de São Paulo
Faculdade de Saúde Pública
VOLUM E 34
NÚMERO 4
AGO STO 2000
Revista de Saúde Pública
p. 380-87
FORNÉS a Nélida Schmid, Ignez Salas Martinsb, Miguel Hernanc, Gustavo Velásquez-Meléndezd and Alberto
Ascherioc Food frequency consumption and lipoproteins serum levels in the population of an urban area, Brazil
Rev. Saúde Pública, 34 (4): 380-87, 2000 www.fsp.usp.br/rsp
Food frequency consumption and lipoproteins
serum levels in the population of an urban
area, Brazil
Freqüência de consumo alimentar e níveis
séricos de lipoproteínas na população de
Cotia, SP, Brasil
N élida Schmid Fornésa, Ignez Salas M artinsb, M iguel H ernanc, Gustavo
Velásquez-M eléndezd and Alberto Ascherioc
380 380380 380
380 Rev Saúde Pública 2000;34(4):380-7
www.fsp.usp.br/rsp
Abstract
Objective
To identify the association between food group consumption frequency and serum lipoprotein levels among adults.
Methods
The observations were made during a cross-sectional survey of a representative sample of men and women over 20 years old living in Cotia county, S. Paulo, Brazil. Data on food frequency consumption, serum lipids, and other covariates were available for 1,045 adults. Multivariate analyses adjusted by age, gender, body mass index, waist-to-hip ratio, educational level, family income, physical activity, smoking, and alcohol consumption were performed.
Results
Consumption of processed meat, chicken, red meat, eggs and dairy foods were each positively and significantly correlated with LDL-C, whereas the intake of vegetables and fruits showed an inverse correlation. Daily consumption of processed meat, chicken, red meat, eggs, and dairy foods were associated with 16.6 mg/dl, 14.5 mg/dl, 11.1 mg/dl, 5.8 mg/dl, and 4.6 mg/dl increase in blood LDL-C, respectively. Increases of daily consumption of fruit and vegetables were associated with 5.2 mg/dl and 5.5 mg/dl decreases in LDL-C, respectively. Alcohol beverage consumption showed a significant positive correlation with HDL-C.
Conclusions
Dietary habits in the study population seem to contribute substantially to the variation in blood LDL and HDL concentrations. Substantially CHD risk reduction could be achieved with dietary changes.
Food frequency consumption and
lipoproteins serum levels in the
population of an urban area, Brazil
*
Freqüência de consumo alimentar e níveis
séricos de lipoproteínas na população de
Cotia, SP, Brasil
N élida Schmid Fornésa, I gnez Salas M artinsb, M iguel H ernanc, Gustavo
Velásquez-M eléndezd and Alberto Ascherioc
aFaculdade de Nutrição da Universidade Federal de Goiás. Goiânia, GO, Brasil. bDepartamento de Nutrição da Faculdade de Saúde Pública da Universidade de São Paulo. São Paulo, SP, Brasil. cSchool of Public H ealth, H arvard University. Boston, M A, USA. dUniversidade Federal de M inas Gerais. Belo H orizonte, M G, Brasil
Keyw ords
Food habits#. Food consumption#.
Cardiovascular diseases, prevention and control#. Lipoproteins, HDL
cholesterol, blood#. Lipoproteins,
LDL cholesterol, blood#. Risk
factors. Lipids, blood.
Correspondence to:
Nélida Schmid Fornés
Rua 10, 930, apto. 902, Setor Oeste, 74120-020, Goiânia, GO, Brasil E-mail: [email protected]
*Based on the doctoral thesis presented to the “ Faculdade de Saúde Pública, Universidade de São Paulo, 1998” . Presented at the IV “ Congresso Brasileiro de Epidemiologia, Rio de Janeiro, 1998” .
The publication of this article was subsidied by Fapesp (Process n. 00/01601-8).
Partially supported by grant from the “ Coordenação de Aperfeiçoamento de Pessoal de Nível Superior - MEC-CAPES (BEX2921/95); Conselho Nacional de Desenvolvimento Científico e Tecnológico - CNPq (410427/89-6) and Fundação de Apoio à Pesquisa de São Paulo – Fapesp (Processo no 91/0820-7).
381 381 381 381 381 Rev Saúde Pública 2000;34(4):380-7
www.fsp.usp.br/rsp
Food consumption/lipoproteins serum levels
Fornés NS et al.
Resumo
Objetivo
Identificar a associação entre a freqüência de consumo de diferentes grupos de alimentos e níveis de lipídios séricos de adultos.
Métodos
As observações pertencem a um estudo transversal e correspondem a uma amostra representativa de 1.045 adultos de ambos os sexos, de 20 anos ou mais, residentes no município de Cotia, SP, Brasil. Foram determinados a ingestão de alimentos pela freqüência de consumo alimentar, níveis de lipídios séricos e outras variáveis. Foram elaborados modelos de regressão linear múltipla (stepwise forward) para LDL-C e HDL-C, ajustados por: idade, sexo, índice de massa corpórea, relação cintura quadril, nível educacional, renda familiar, atividade física, tabagismo e etilismo.
Resultados
O consumo de carnes (bovina, suína, aves, vísceras e carnes processadas), leite e derivados e ovos correlacionou-se positiva e significativamente com LDL-C. O consumo de frutas e hortaliças mostraram correlação inversa e significativa. O consumo de: carnes de aves, carnes vermelhas, ovos e leite e derivados foram associados com um aumento na LDL-C de 16,6 mg/dl, 14,5 mg/dl, 11,1 mg/dl, 5,8mg/ dl, e 4,6 mg/dl, respectivamente. O aumento no consumo de frutas e hortaliças foi correlacionado com uma redução de 5,2 mg/dl e 5,5 mg/dl nos níveis de LDL-C, respectivamente. O consumo de bebidas alcoólicas se correlacionou positiva e significativamente com a fração HDL-C.
Conclusões
Na população brasileira estudada observou-se que os hábitos alimentares parecem contribuir para as variações na concentração dos lipídios séricos de LDL-C e HDL-C. Redução nos riscos de doenças cardiovasculares podem ser alcançadas por meio de controle dietético.
D escritores
Hábitos alimentares#. Consumo de
alimentos#. Doenças
cardiovasculares, prevenção e controle#. Lipoproteínas do
colesterol HDL, sangue#.
Lipoproteínas do colesterol LDL, sangue#. Fatores de risco. Lipídios,
sangue.
I N TRO D U CTI O N
The longstanding view about the relationship between diet and coronary heart disease (CHD) has been strongly based on the observation that serum LDL and HDL
cho-lesterol levels are CHD risk predictors.21 Although
sev-eral controlled experiments have estimated the effects of specific fatty acids on blood lipids, there is still a lack of information about the importance of diet in determining
HDL and LDL concentrations in free living populations.21
The purpose of this cross-sectional study was to ex-amine the association between specific food consump-tion frequencies and low-density lipoprotein (LDL) and high-density lipoprotein (HDL) cholesterol
concentra-tion levels among adults in S. Paulo, Brazil.7
M ETH O D S
Population
A standardized questionnaire was administered to a representative sample of non-institutionalized adults (n=1,328) aged 20 years or more living in the town of Cotia, Greater São Paulo, Brazil. The
survey methodology was based in Singer et al.18
The observations were collected during a cross-sec-tional assessment.
The questionnaire consisted of three parts: a
De-mographic Section to record the subjects’ age,
gen-der, occupation, marital status, educational back-ground, family income, and family size; a Clinical,
Anthropometric and Biochemical section; and a Food Frequency Questionnaire Section. The individuals
were interviewed at the local health centers and com-munity health centers, and each interviewer followed a basically structured interview protocol.
382 382382 382
382 Rev Saúde Pública 2000;34(4):380-7
www.fsp.usp.br/rsp Food consumption/lipoproteins serum levels
Fornés NS et al.
Educational level was divided into five categories and family income was classified into in four catego-ries, based on the number of minimal wages (approxi-mately US$ 100.00 = 1 minimal wage).
Clinical, anthropometric and biochemistry assessment methods
The general examination routine is described
else-where.12 Subjects’ height, weight, waist and hip
cir-cumferences were recorded. Body mass index (BMI,
kg per m2) and waist-to-hip ratio were calculated.
In-formation on lifestyle, physical activity, smoking and alcohol consumption were also gathered. Daily physi-cal activity was assessed with six questions and respon-dents were asked about their occupation (type of work) and whether they engage in any leisure-tioe physical activities or exercises, such as running, gardening or walking. Activities were recorded in resting metabolic rate (BMR) equivalents, taking into account frequency, intensity, and duration of the physical activity. The to-tal weekly time spent per activity was calculated ac-cording to the activity levels suggested by the FAO/
WHO/UN (WHO, 1985).16 Each subject was allocated
into one of the three physical activity categories: mild, medium-to-heavy, and heavy.
Participants’ smoking status was classified accord-ing to the number of cigarettes smoked per day. Only individuals smoking ten or more cigarettes per day were considered smokers. To identify alcohol con-sumption, four questions extracted from the CAGE
questionnaire13 were used. Individuals who answered
two or more questions positively were considered al-cohol abusers.
Enzymatic methods were used to measure serum lipids. Blood samples were collected at the Cotia health center after an overnight fasting (12 hours or more). Samples were sent to the São Paulo Univer-sity Hospital laboratory where they were analyzed. Total cholesterol (TC) and HDL-C were determined by auto-analyzer, using Boehringer Manhein Merk enzymatic method. Triglycerides (TG) were deter-mined by enzymatic calorimetric methods using
com-mercial kits – Cholesterol Cod-Ana Labtest®. LDL-C
was calculated according to the Friedewald equation: (LDL-C) = (TC) - (HDL-C) - (TG)/5.
Assessment of food consumption frequency
A twelve-month retrospective food frequency ques-tionnaire was used to determine food consumption frequency. A staff trained member or a dietitian inter-viewed each participant using a tool previously
as-sessed in the pilot study. The food list consisted of forty-four Brazilian foods. The questionnaire had open-end questions to allow the introduction of food items not included in the list. Respondents were asked to average their food consumption over the year by indicating how often each kind of food was consumed. Consumption frequency for a 365-day period was categorized into seven different categories for each food item: 0, never; 0.03, once a month or less; 0.08, two to three times a month; 0.22, one to two times a week; 0.50, three to four times a week; 0.79, five to six times a week; and 1, once a day. For each food group, consumption frequency was calculated by add-ing the reported frequency for each food items.
Statistical analysis
The association between serum lipids and food con-sumption and non-dietary factors was first assessed with univariate analyses. Spearman-correlation coef-ficients were used to estimate the association between individual food item consumption frequency and se-rum lipids concentration. Multivariate linear regres-sion was used to estimate the association between food consumption frequency and serum blood lipoproteins, adjusted by other covariates. Serum lipoproteins (LDL-C and HDL-C) levels were the dependent vari-ables in two separate linear regression models which included age, body mass index, waist-to-hip ratio and individual food consumption as continuous variables, and gender, educational level, family income, physi-cal activity, smoking status, alcohol consumption as categorical variables. LDL-C and HDL-C continuous variables were adjusted for age, gender and versus multivariate. The variable body mass index and waist-to-hip ratio were divided by the corresponding stan-dard deviation. Foods were also grouped into eleven major food groups as showed in Table 1.
All probability values are two-tailed. Results were defined as statistically significant for a value of p<0.05. Analyses were performed using the Statisti-cal Analysis System (SAS), UNIX 6.12 version.
RESU LTS
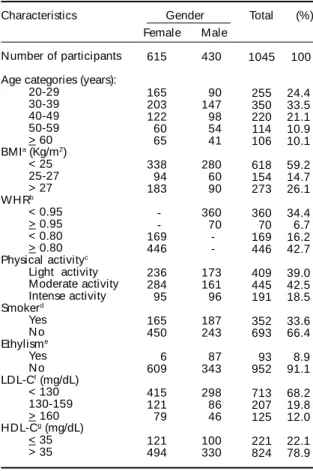
Demographic and risk factors characteristics of the study population are showed in Table 2.
383 383 383 383 383 Rev Saúde Pública 2000;34(4):380-7
www.fsp.usp.br/rsp
Food consumption/lipoproteins serum levels
Fornés NS et al.
Table 2 – Demographic and risk factor characteristics of the study population. Cotia, S. Paulo, Brazil.
Characteristics Gender Total (%)
Number of participants
Age categories (years): 20-29
30-39 40-49 50-59 > 60 BMIa (Kg/m2)
< 25 25-27 > 27 WHRb < 0.95 > 0.95 < 0.80 > 0.80 Physical activityc
Light activity Moderate activity Intense activity Smokerd Yes N o Ethylisme Yes N o LDL-Cf (mg/dL)
< 130 130-159 > 160 HDL-Cg (mg/dL)
< 35 > 35 Female 615 165 203 122 60 65 338 94 183 -169 446 236 284 95 165 450 6 609 415 121 79 121 494 Male 430 90 147 98 54 41 280 60 90 360 70 -173 161 96 187 243 87 343 298 86 46 100 330 1045 255 350 220 114 106 618 154 273 360 70 169 446 409 445 191 352 693 93 952 713 207 125 221 824 100 24.4 33.5 21.1 10.9 10.1 59.2 14.7 26.1 34.4 6.7 16.2 42.7 39.0 42.5 18.5 33.6 66.4 8.9 91.1 68.2 19.8 12.0 22.1 78.9
a Body Mass Index (kg/m2 ) b Waist-to-hip ratio
c Calculate by: type of w ork activity and other physical
activity.
d Smoker > 10 cigarettes/ day e Ethylism = CAGE questionnaire13
f Serum Low Density Lipoprotein-Cholesterol level g Serum High Density Lipoprotein-Cholesterol level
The Spearman correlation coefficients (rs) between
LDL-C level (mg/dl) and food consumption
fre-quency were significantly positive for dairy (rs=0.09;
p<0.01), red meat (rs=0.15; p<0.001), chicken
(rs=0.10; p<0.01), eggs (rs=0.10; p<0.01), and
pro-cessed meat (rs=0.08; p<0.05), while significantly
negative for vegetables (rs= -0.11; p<0.001), fruits
(rs= -0.05; p<0.01), and fish (rs= -0.08; p<0.05).
Spearman correlation coefficients (rs) between
HDL-C level (mg/dl) and the food consumption fre-quency were significantly positive for alcohol
(rs=0.08; p<0.01) and significantly negative for
pro-cessed meat (rs= -0.06; p<0.05), and beans (rs= -0.07;
p<0.05).
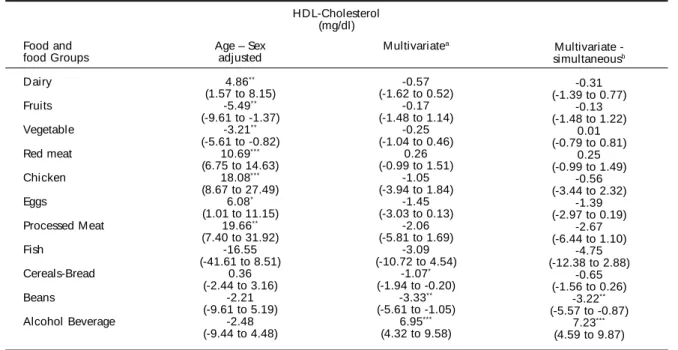
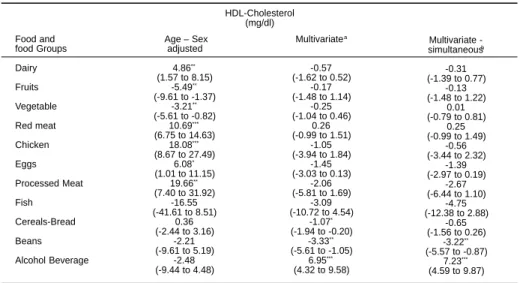
The results of the linear regression analyses are showed in Table 3 and 4. The association between serum lipoproteins and food consumption frequency for each of the eleven food groups were examined separately. The consumption of dairy foods adjusted for age and gender showed a significant positive
association with LDL-C (βi=4.86). There was no
change in the observed association after adjusting for BMI/SD, WHR/SD, educational level, family income, physical activity, smoking, alcohol abuse or food groups. LDL-C concentration had an in-versely significant association with consumption of fruits and vegetables in all models, whereas it was strongly positively associated with red meat consumption. The relationship between LDL-C and chicken consumption frequency showed a stronger
positive association (βi=18.08) than with red meat
when potential confounders were adjusted
(βi=14.47). Egg consumption had a significant
posi-tive association with LDL-C. Processed meat con-sumption showed a positive association with LDL-C serum levels even after controlling confounders
factors (βi=16.55). Consumption of fish,
cereals-breads, beans, and alcohol showed to have a non-significant negative association, even after adjust-ing for potential confounders (Table 3).
There was a non-significant inverse association between consumption of the dairy, fruits, vegetable, red meat, chicken, eggs, processed meat, fish and ce-reals-breads group foods and HDL-C. Beans
con-Table 1 – Reported using foods by the study population included in the modeling process.
Food groups Alcohol beverage Dairy Vegetables Fruits Red meats Chicken Eggs
Processed meats, luncheon meats and internal organs Fish
Breads and cereals Beans
Foods included in the food group
beer, wines, firewater of sugar cane, and others spirit milks, cheeses, butter, and yogurt
water-cress, lettuce, endive1, chicory, cabbage, pumpkin, summer squash, beetroot, carrot, chayote, fruit of the jiloeiro, corn, cucumber, okra, tomato, French bean, kale, cauliflower, radish, swiss chard, wild chicory, spinach, potato, sweet potato, and cassava
bananas, oranges, apples, papaya, watermelon, melon, pear, and tangerine bovine meats, pork meats
chicken with skin chicken whole eggs
italian sausage, salami, ham, high fat ham, liver (from poultry and bovine), chicken heart, chicken gizzard, and kidney
atlantic fish; e.g., sardine, and river fish
384 384384 384
384 Rev Saúde Pública 2000;34(4):380-7
www.fsp.usp.br/rsp Food consumption/lipoproteins serum levels
Fornés NS et al.
sumption frequency had a significant negative asso-ciation with HDL-C levels. Regarding this same li-poprotein, alcohol consumption showed also a
sig-nificant positive association after gender (βi=5.41),
multivariate (βi=6.95), and (βi=7.23) multivariate
si-multaneous adjustments (Table 4).
Table 3 – Regression coefficients - β1 (95% confidence interval) of food frequency consumption of food groups in linear models
with LDL-Cholesterol as dependent variable.
Food and food Groups Dairy Fruits Vegetable Red meat Chicken Eggs Processed Meat Fish Cereals-Bread Beans Alcohol Beverage
Age – Sex adjusted
4.86**
(1.57 to 8.15) -5.49**
(-9.61 to -1.37) -3.21**
(-5.61 to -0.82) 10.69***
(6.75 to 14.63) 18.08***
(8.67 to 27.49) 6.08*
(1.01 to 11.15) 19.66**
(7.40 to 31.92) -16.55 (-41.61 to 8.51)
0.36 (-2.44 to 3.16)
-2.21 (-9.61 to 5.19)
-2.48 (-9.44 to 4.48)
Multivariatea
-0.57 (-1.62 to 0.52)
-0.17 (-1.48 to 1.14)
-0.25 (-1.04 to 0.46)
0.26 (-0.99 to 1.51)
-1.05 (-3.94 to 1.84)
-1.45 (-3.03 to 0.13)
-2.06 (-5.81 to 1.69)
-3.09 (-10.72 to 4.54)
-1.07*
(-1.94 to -0.20) -3.33**
(-5.61 to -1.05) 6.95***
(4.32 to 9.58)
Multivariate -simultaneousb
-0.31 (-1.39 to 0.77)
-0.13 (-1.48 to 1.22)
0.01 (-0.79 to 0.81)
0.25 (-0.99 to 1.49)
-0.56 (-3.44 to 2.32)
-1.39 (-2.97 to 0.19)
-2.67 (-6.44 to 1.10)
-4.75 (-12.38 to 2.88)
-0.65 (-1.56 to 0.26)
-3.22**
(-5.57 to -0.87) 7.23***
(4.59 to 9.87) HDL-Cholesterol
(mg/dl)
a Model includes age (continuous variable); sex (male=1); body mass index/standard deviation (continuous variable); waist to hip
ratio/standard deviation (continuous variable); educational level (five categories); family income (four categories); physical activity (three categories); smoking habits (smoker = > 10 cigarettes per day); Ethylism (alcoholic by CAGE questionnaire13).
b Additionally adjusted for food frequency consumption of food and food groups (continuous variable).
* p < .05; ** p < .01; *** p < .001
Table 4 – Regression coefficients - β1(95% confidence interval) of food frequency consumption of food groups in linear models with HDL-Cholesterol as dependent variable.
Food and food Groups Dairy Fruits Vegetable Red meat Chicken Eggs Processed Meat Fish Cereals-Bread Beans Alcohol Beverage
Age – Sex adjusted
-0.59 (-1.09 to 0.45)
-0.47 (-1.79 to 0.85)
-0.13 (-0.88 to 0.62)
0.18 (-1.07 to 1.43)
-1.54 (-4.51 to 1.43)
-1.18 (-2.77 to 0.41)
-2.45 (-6.31 to 1.41)
-3.22 (-11.08 to 4.64)
-0.71 (-1.59 to 0.17)
-2.92*
(-5.23 to -0.61) 5.41***
(3.25 to 7.57)
Multivariatea
-0.57 (-1.62 to 0.52)
-0.17 (-1.48 to 1.14)
-0.25 (-1.04 to 0.46)
0.26 (-0.99 to 1.51)
-1.05 (-3.94 to 1.84)
-1.45 (-3.03 to 0.13)
-2.06 (-5.81 to 1.69)
-3.09 (-10.72 to 4.54)
-1.07*
(-1.94 to -0.20) -3.33**
(-5.61 to -1.05) 6.95***
(4.32 to 9.58)
Multivariate -simultaneousb
-0.31 (-1.39 to 0.77)
-0.13 (-1.48 to 1.22)
0.01 (-0.79 to 0.81)
0.25 (-0.99 to 1.49)
-0.56 (-3.44 to 2.32)
-1.39 (-2.97 to 0.19)
-2.67 (-6.44 to 1.10)
-4.75 (-12.38 to 2.88)
-0.65 (-1.56 to 0.26)
-3.22**
(-5.57 to -0.87) 7.23***
(4.59 to 9.87) HDL-Cholesterol
(mg/dl)
a Model includes age (continuous variable); sex (male=1); body mass index/standard deviation (continuous variable); waist to hip
ratio/standard deviation (continuous variable); educational level (five categories); family income (four categories); physical activity (three categories); smoking habits (smoker = > 10 cigarettes per day); Ethylism (alcoholic by CAGE questionnaire13).
b Additionally adjusted for food frequency consumption of food and food groups (continuous variable).
385 385 385 385 385 Rev Saúde Pública 2000;34(4):380-7
www.fsp.usp.br/rsp
Food consumption/lipoproteins serum levels
Fornés NS et al.
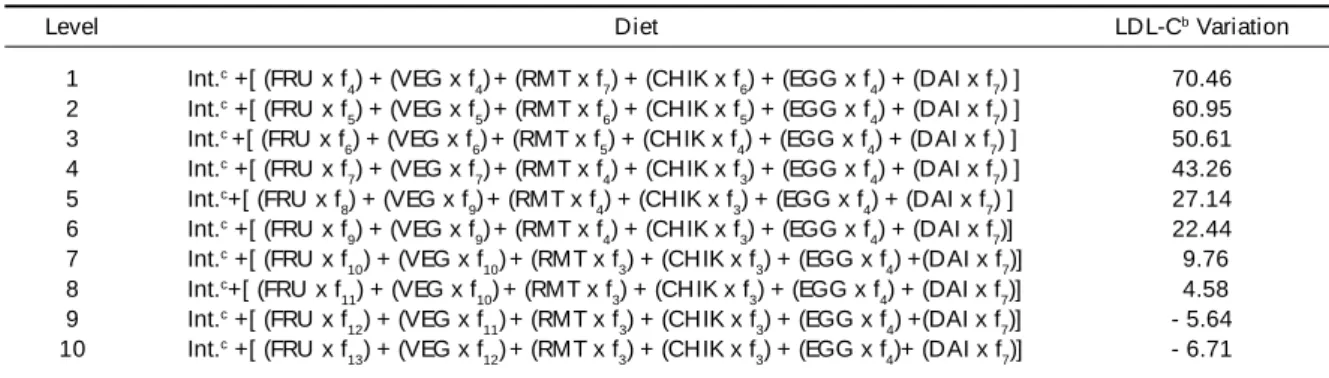
To assess the public health importance of these find-ings, potential reductions in the population LDL-cho-lesterol that could be achieved with dietary changes were calculated. To facilitate the direct comparison of the observed association between consumption
fre-quency in each food group (fi) and possible changes
in LDL-C levels, ten different hypothetical diets were designed, with all six food groups represented (fruits, vegetables, red meat, chicken, eggs and dairy).
For each assumption, the calculation was based on the LDL-C multivariate-simultaneous regression
co-efficient – βi – seen in Table 3, using actual
popula-tion distribupopula-tions and comparing individuals in upper versus lower score decile from the consumption
fre-quency code. The possible effect on LDL-C levels
was calculated according to the annual variation of each food groups’ consumption frequency. To facili-tate this calculation, fruits, vegetables, red meat and chicken groups consumption frequency were the only modified, and a fixed consumption frequency for the others food groups was maintained. To simplify, in-terpretation was performed as follows: in the two dif-ferent hypothetical diets (level 1 and level 10), actual numbers obtained in the study (Table 3) and food con-sumption frequency code were used (a year of 365 days = 1 and proportionally coded to the number of days in each category).
Diet level 1:
44.40 + [(-5.18x0.22) + (-5.47x0.22) + (11.05x1.00) + (14.47x0.79) + (5.82x0.22) + (4.64x1.00)] = 70.46 mg/dl
Diet level 10:
4 4 . 4 0 + [ ( - 5 . 1 8 x 7 . 0 0 ) + ( - 5 . 4 7 x 6 . 0 0 ) + (11.05x0.08) + (14.47x0.08) + (5.82x0.22) + (4.64x1.00) ] = -16.71 mg/dl
From this calculation, LDL-C variation was obtained, which represent the possible increase or decrease in LDL-C in milligrams per deciliter (mg/dl). Table 5 shows the LDL-C variation obtained from ten different food diets.
D I SCU SSI O N
Four decades ago, numerous investigators observed considerable differences in serum cholesterol levels of different population groups. It has been observed that in many so-called developing countries the aver-age blood cholesterol level was lower than in the most
developed countries.9 In developing countries it is
observed an increase in the energetic density of diets, mainly due to an elevation in fat consumption, sed-entary lifestyle and a consequent growth in the preva-lence of obesity. Thus, this component of the current nutritional transition represents a crisis demanding both recognition and action. Some regional problems in Brazil are closer to those found in the United States, where poor people suffer more from dietary excesses than the rich, with noncomunicable diseases, cardio-vascular and other diseases mortality being higher
among the poor.14 There was a change in the
preva-lence of coronary heart disease (CHD) in the Brazil-ian population, and today CHD is a major cause of
death.11 High plasma cholesterol is a well-established
risk factor. The relationship between diet and CHD strongly relies on the fact that serum LDL and HDL cholesterol levels are good predictors of CHD risk
(Willett,21 1998). It has been more than 100 years that
cholesterol is known as a main component of the atheromatous plaque. Individuals with high serum cholesterol levels have a greater risk of developing CHD than those with low serum cholesterol. The Framingham Heart Study has documented several classes of agents that contribute to cardiovascular dis-ease. Serum total cholesterol atherogenic potential has been showed to derive from the low density lipopro-tein cholesterol (LDL-C) fraction which was found
Table 5 – Estimated variation according to hypothetical food frequency consumption by the regression coefficient β1 after adjusted by multivariate simultaneousa.
Level
1 2 3 4 5 6 7 8 9 10
Diet
Int.c +[ (FRU x f
4) + (VEG x f4)+ (RMT x f7) + (CHIK x f6) + (EGG x f4) + (DAI x f7) ]
Int.c +[ (FRU x f
5) + (VEG x f5)+ (RMT x f6) + (CHIK x f5) + (EGG x f4) + (DAI x f7) ]
Int.c +[ (FRU x f
6) + (VEG x f6)+ (RMT x f5) + (CHIK x f4) + (EGG x f4) + (DAI x f7) ]
Int.c +[ (FRU x f
7) + (VEG x f7)+ (RMT x f4) + (CHIK x f3) + (EGG x f4) + (DAI x f7) ]
Int.c+[ (FRU x f
8) + (VEG x f9)+ (RMT x f4) + (CHIK x f3) + (EGG x f4) + (DAI x f7) ]
Int.c +[ (FRU x f
9) + (VEG x f9)+ (RMT x f4) + (CHIK x f3) + (EGG x f4) + (DAI x f7)]
Int.c +[ (FRU x f
10) + (VEG x f10)+ (RMT x f3) + (CHIK x f3) + (EGG x f4) +(DAI x f7)]
Int.c+[ (FRU x f
11) + (VEG x f10)+ (RMT x f3) + (CHIK x f3) + (EGG x f4) + (DAI x f7)]
Int.c +[ (FRU x f
12) + (VEG x f11)+ (RMT x f3) + (CHIK x f3) + (EGG x f4) +(DAI x f7)]
Int.c +[ (FRU x f
13) + (VEG x f12)+ (RMT x f3) + (CHIK x f3) + (EGG x f4)+ (DAI x f7)]
LDL-Cb Variation
70.46 60.95 50.61 43.26 27.14 22.44 9.76 4.58 - 5.64 - 6.71
a Regression coefficients (β
1) after adjusted for food frequency consumption of food and food groups obtained from Table 3. b Calculated by assuming changes in serum low density lipoprotein levels (mg/dl).
c Intercept (β 0) = 44.40
386 386386 386
386 Rev Saúde Pública 2000;34(4):380-7
www.fsp.usp.br/rsp Food consumption/lipoproteins serum levels
Fornés NS et al.
to be positively related to CHD incidence. Diet has a direct effect on the cholesterol level of the beta-lipo-proteins seen in the blood plasma. Many laboratory and population studies suggested that saturated fats
increase plasma cholesterol and LDL-C levels.3,21
Some of the major sources of saturated fats are meat, animal fat, and dairy products.
Ness and Powles,15 in a review of the risks for
car-diovascular disease, found a significant protective association with fruit and vegetables consumption. In this cross-sectional study, fruits and vegetables con-sumption was associated with a favorable lipidic pro-file, whereas an inverse association was seen for meat and dairy products. These associations persisted af-ter adjustment for age, gender, physical activity, body mass index, waist-to-hip ratio and others potential confounding factors, and are likely to reflect the causal effect of dietary fats on blood lipids
concen-tration in experimental studies. Thorogood et al,20
observed the same effect; those individuals on a meat diet showed higher LDL-C levels than the ones who did not consume meat. Data from the Coronary Ar-tery Risk Development in Young Adults (CARDIA) showed a positive relationship between meat
con-sumption and LDL-C levels.19 A positive
relation-ship between total cholesterol and meat and dairy consumption was confirmed in a cohort study by
Appleby et al2 Jacobsen & Thelle10 showed a
posi-tive association between dairy products consump-tion and lipids levels.
Regarding bean consumption, a significant nega-tive association with serum LDL-C levels was not found and there was a significant inverse relationship
with HDL-C. In contrast, Glore et al,8 in a review
study, emphasized the significant lipid-lowering
ef-fect of soluble fibers. Also Anderson et al1 confirmed
the same effect with beans consumption. These find-ings could be explained by the fact that most people
seasoned the beans with bacon in their preparation.
Regarding fish consumption, there was not a sig-nificant inverse association between fish
consump-tion and serum lipids as found by Bolton-Smith et al.5
One possible explanation could be the very low con-sumption of fish.
In the present study alcohol consumption was sig-nificantly positively associated with HDL-C, as was
observed by Bolton-Smith et al5 and confirmed by
Rimm et al.17 This association was not found by
Bertolami et al,4 in a study carried out Brazil. Only
few diet studies have been performed with Brazilian population to observe the relationship between food consumption and serum lipids levels.
The study data allowed to generate an hypothetical diet showing a substantial reduction in LDL-C level (-16mg/dl), obtained by increasing the serving size in fruits and vegetables consumption nine and eight times, respectively, and decreasing red meat and chicken consumption by half. Also a reduction in LDL-C was achieved by modifying diet fat intake in
Clevidence et al study.6
This study offers support to the perception that food consumption is an important determinant of the popula-tion lipidic profile. Food consumppopula-tion of animal prod-ucts increases serum LDL-C, while fruits and vegetables decrease it. These products have to be considered when the effect of dietary cholesterol, saturated fat and fibers is evaluated. Further studies are needed to identify di-etary patterns of Brazilian population to develop regional and national prevention and control programs.
In this Brazilian population, dietary habits seem to contribute substantially to variation in blood LDL-C and HDL-C concentrations. Substantially reductions in the CHD risk could be achieved by dietary changes.
REFEREN CES
1. Anderson JW, Story L, Sieling B, Chen WL, Petro MS, Story J. Hypocholesterolemic effects of oat-bran or bean intake for hypercholesterolemic men. Am J Clin Nutr 1994;40:1146-55.
2. Appleby PN, Thorogood M, McPherson K, Mann JI. Associations between plasma lipid concentration and dietary, lifestyle and physical factors in the Oxford Vegetarian Study. J H um Nutr Diet 1995;8:305-14.
3. Ascherio A, Rimm EB, Giovannucci EL, Spiegelman D, Stampfer M, Willett WC. Dietary fat and risk of coronary heart disease in men: cohort follow up study in the United States. Br Med J 1996;313:84-90.
4. Bertolami MC, Faludi AA, Latorre M do RDO, Zaidan FOT. Perfil lipídico de funcionários de indústria metalúrgica e sua relação com outros fatores de risco. Arq Bras Cardiol 1993;60:293-9.
387 387 387 387 387 Rev Saúde Pública 2000;34(4):380-7
www.fsp.usp.br/rsp
Food consumption/lipoproteins serum levels
Fornés NS et al.
6. Clevidence BA, Judd JT, Schatzkin A, Muesing RA, Campbell WS, Brown CC, et al. Plasma lipid and lipoprotein concentrations of men consuming a low-fat, high-fiber diet. Am J Clin Nutr 1992;55:689-94.
7. Fornés NS. Padrões alimentares e suas relações com os lipídios séricos em população da área metropolitana de São Paulo [tese]. São Paulo: Faculdade de Saúde Pública da USP; 1998.
8. Glore SR, Van Treeck D, Knehans AW, Guild M. Soluble fiber and serum lipids: a literature review. J Am Diet Assoc 1994;94:425-36.
9. Groen JJ, Bologh M, Yaron E, Freeman J. Influence of the nature of the fat in diets high in carbohydrate (mainly derived from bread) on the serum cholesterol. Am J Clin Nutr 1965;17:296-304.
10. Jacobsen BK, Thelle DS. The Tromsø Heart Study: food habits, serum total cholesterol, HDL-cholesterol, and triglycerides. Am J Epidemiol 1987;125:622-30.
11. Lotufo PA. A mortalidade precoce por doenças crônicas nas capitais de regiões metropolitanas do Brasil [tese]. São Paulo: Faculdade de Saúde Pública da USP; 1995.
12. Martins IS, Coelho LT, Mazzilli RN, Singer JM, Souza CU, Antonieto JRAE, et al. Doenças cardiovasculares ateroscleróticas, dislipidemias, hipertensão, obesidade e diabetes melito em população da área metropolitana da região sudeste do Brasil. I - Metodologia da pesquisa. Rev Saúde Pública 1993;27:250-61.
13. Masur J, Capriglione MJ, Monteiro MG, Jorge MR. Detecção precoce do alcoolismo em clínica médica através do questionário CAGE. J Bras Psiquiatr 1985;34:31-4.
14. Monteiro CA, Mondini L, de Souza ALM, Popkin BM. The nutrition transition in Brazil. Eur J Clin Nutr 1995;49:105-13.
15. Ness AR, Powles JW. Fruit and vegetables, and cardiovascular disease: a review. Int J Epidemiol 1997;26:1-13.
16. Organización Mundial de la Salud. Reunión Consultiva Conjunta FAO/OMS/UNU de Expertos sobre
Necesidades de Energía y de Proteínas, Ginebra. Informe. Ginebra; 1985. [OMS - Serie de Informes Técnicos; 724].
17. Rimm EB, Giovannucci EL, Willett WC, Colditz GA, Ascherio A, Rosner B, et al. Prospective study of alcohol consumption and risk of coronary disease in men. Lancet 1991;338:464-8.
18. Singer J, Cordani L, Latif S. Relatório de análise estatística sobre o projeto “ Estudos da relação entre doenças cardiovasculares ateroscleróticas, dislipidemias, hipertensão, obesidade e diabetes melito com fatores de risco” . São Paulo: Instituto de Matemática e Estatística da USP; 1990. [SEA - Relatório de Análise Estatística; 9002].
19. Slattery ML, Jacobs DR, Hilner JE, Caan BJ, Van Horn L, Bragg C, et al. Meat comsumption and its associations with other diet and health factors in young adults: the CARDIA Study. Am J Clin Nutr 1991;54:930-5.
20. Thorogood M, Carter R, Benfield L, McPherson K, Mann JI. Plasma lipids and lipoprotein cholesterol
concentrations in people with different diets in Britain. Br Med J 1987;295:351-3.
Erratum
Revista de Saúde Pública Volume 34(4), 2000
Tabela 3/ Table 3 - Página/ Page 384
Os valores da segunda e terceira coluna da Tabela 3 foram copiados por engano da Tabela 4. Substituir a Tabela conforme a seguir / Values of the second and third columns on Table 3 were miscopied from Table 4. Please
replace the Table as follows: Rev Saúde Pública 2006;40(3):558
Tabela 3 antiga/ Former Table 3:
Tabela 3 atual/ Correct Table 3:
Table 3 – Regression coefficients - β1 (95% confidence interval) of food frequency consumption of food groups in linear models
with LDL-Cholesterol as dependent variable.
Food and food Groups
Dairy
Fruits
Vegetable
Red meat
Chicken
Eggs
Processed Meat
Fish
Cereals-Bread
Beans
Alcohol Beverage
Age – Sex adjusted
4.86**
(1.57 to 8.15) -5.49**
(-9.61 to -1.37) -3.21**
(-5.61 to -0.82) 10.69***
(6.75 to 14.63) 18.08***
(8.67 to 27.49) 6.08*
(1.01 to 11.15) 19.66**
(7.40 to 31.92) -16.55 (-41.61 to 8.51)
0.36 (-2.44 to 3.16)
-2.21 (-9.61 to 5.19)
-2.48 (-9.44 to 4.48)
Multivariatea
-0.57 (-1.62 to 0.52)
-0.17 (-1.48 to 1.14)
-0.25 (-1.04 to 0.46)
0.26 (-0.99 to 1.51)
-1.05 (-3.94 to 1.84)
-1.45 (-3.03 to 0.13)
-2.06 (-5.81 to 1.69)
-3.09 (-10.72 to 4.54)
-1.07*
(-1.94 to -0.20) -3.33**
(-5.61 to -1.05) 6.95***
(4.32 to 9.58)
Multivariate -simultaneousb
-0.31 (-1.39 to 0.77)
-0.13 (-1.48 to 1.22)
0.01 (-0.79 to 0.81)
0.25 (-0.99 to 1.49)
-0.56 (-3.44 to 2.32)
-1.39 (-2.97 to 0.19)
-2.67 (-6.44 to 1.10)
-4.75 (-12.38 to 2.88)
-0.65 (-1.56 to 0.26)
-3.22**
(-5.57 to -0.87) 7.23***
(4.59 to 9.87) HDL-Cholesterol
(mg/dl)
a Model includes age (continuous variable); sex (male=1); body mass index/standard deviation (continuous variable); waist to hip
ratio/standard deviation (continuous variable); educational level (five categories); family income (four categories); physical activity (three categories); smoking habits (smoker = > 10 cigarettes per day); Ethylism (alcoholic by CAGE questionnaire13). b Additionally adjusted for food frequency consumption of food and food groups (continuous variable).
* p < .05; ** p < .01; *** p < .001
Table 3 - Regression coefficients - β1 (95% confidence interval) of food frequency consumption of food groups in linear models
with LDL-Cholesterol as dependent variable.
LD L-Cholesterol (mg/dl)
Food and Age - Sex M ul ti vari atea M ultivariate
-food Groups adjusted Simultaneousb
D ai ry 4.86** 4.33* 4.64**
(1.57 to 8.15) (0.93 to 7.73) (1.19 to 8.09)
Fruits -5.49** -5.59** -5.18*
(-9.61 to -1.37) (-9.77 to -1.41) (-9.41 to -0.95 )
Vegetabl e -3.21** -4.33*** -5.47***
(-5.61 to -0.82) (-6.78 to -1.88) (-8.02 to -2.92)
Red M eat 10.69*** 10.52*** 11.05***
(6.75 to 14.63) (6.51 to 14.53) (7.08 to 15.02)
Chi cken 18.08*** 13.67** 14.47**
(8.67 to 27.49) (4.28 to 23.06) (5.28 to 23.66)
Eggs 6.08* 5.30* 5.82*
(1.01 to 11.15) (0.16 to 10.44) (0.74 to 10.90)
Processed M eat 19.66** 17.11** 16.55**
(7.40 to 31.92) (4.93 to 29.29) (4.46 to 28.64)
Fish -16.55 -14.43 -9.80
(-41.61 to 8.51) (-39.30 to 10.44) (-34.25 to 14.65)
Cereal s-Bread 0.36 -0.06 -1.14
(-2.44 to 3.16) (-2.90 to 2.78) (-4.06 to 1.78)
Beans -2.21 -1.51 -1.94
(-9.61 to 5.19) (-8.96 to 5.94) (-9.46 to 5.58)
Alcohol Beverage -2.48 -0.36 -2.40
(-9.44 to 4.48) (-9.07 to 8.35) (-10.86 to 6.06)
aModel includes age (continuous variable); sex (male=1); body mass index/standard deviation (continuous variable); waist to
hip ratio/standard deviation (continuous variable); educational level (five categories); family income (four categories); physical activity (three categories); smoking habits (smoker = >10 cigarettes per day); Ethylism (alcoholic by CAGE questionnaire13). bAdditionally adjusted for food frequency consumption of food and food groups (continuous variable).