Reddy Sreenivasulu
a*, Chalamalasetti SrinivasaRao
ba Department of Mechanical Engineering, R.V.R. & J.C.College of Engineering (Autonomous) , Chowdavaram, Guntur, Andhra Pradesh, India.
a Department of Mechanical Engineering, University College of Engineering, (Autonomous) Andhra University, Visakhapatnam, Andhra Pradesh, India.
* Corresponding author: Reddy Sreenivasulu
E-mail: [email protected] , Tel.: +91- 09441069440
PREDICTION OF BURR SIZE IN DRILLING OPERATION OF AL
2014 ALLOY USING TAGUCHI DESIGN METHOD
A B S T R A C T
K E Y W O R D SA R T I C L E I N F O
Received 18 Aug 2016
Accepted 15 Dec 2016
Available online 5 Jan 2017
This paper presents the influence of cutting parameters like cutting speed, feed rate, drill diameter, point angle and clearance angle on the burr size of Al 2014 alloy during drilling on CNC vertical machining center. A plan of experiments based on Taguchi method has been used to acquire the data. An orthogonal array, signal to noise (S/N) ratio and analysis of variance (ANOVA) are employed to investigate machining characteristics using HSS twist drill bits with variable tool geometry and maintain constant helix angle of 450 . Confirmation tests have been carried out to predict the optimal setting of process parameters to validate the proposed method and obtained the values 0.232 mm and 0.173 mm for burr height and thickness respectively.
48
1.
Introduction
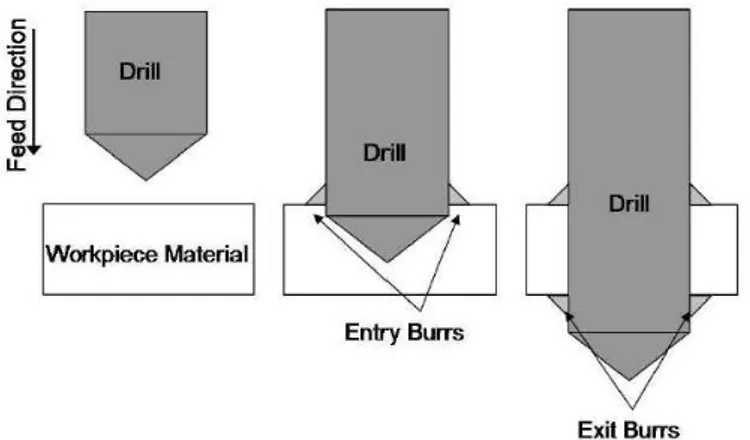
Drilling is a machining process used to create or enlarge holes into or through a workpiece material. The process is performed with the use of a drill, which works by rotating at a fast speed while simultaneously being fed into the workpiece, removing incremental amounts of workpiece material. The drill itself, which performs the cutting action, has multiple cutting edges and flutes running along its length that allow the chips of workpiece material to be carried away. During the drilling process, burrs form on both the entry and exit surfaces as a result of plastic deformation of the workpiece material. Burrs are simply small amounts of attached material that protrude from the original entry and exit surfaces around the drilled hole. An illustration of the drilling process as well as both entry and exit burr formation is shown in Fig1. They are generally unwanted, and commonly need to be removed depending on the specific desired part geometry. If they are not removed, they can cause misalignment with adjacent parts. Because of strain-hardening effects, burrs are typically harder than the original material (J.C. Aurich, 2009), meaning that contact between two adjacent parts with the burr in between can cause cracks to form and can reduce the overall fatigue life of the assembly. The burrs can also get detached from the surface and get trapped between mating surfaces leading to three-body abrasion and eventual failure of the assembly, among numerous other potential problems.
Figure 1. Entry and exit burr formation
1.1. Back ground on Literature
49 main effect analysis and variance analysis are adopted, to obtain the optimal parameters combination. The results show that, the amount of exit burrs can be effectively reduced by adjusting the cutting speed and feed rate with existing manufacturing conditions. V N Gaitonde et al (2005) presented genetic algorithm (GA) applications to RSM models in their paper to reduce burr size reduction in drilling process for mild steel. The effect of cutting speed, feed, drill diameter, point angle and clearance angle on Burr height and thickness has been investigated. The usefulness of GA in multi-objective drilling burr size optimization problems is demonstrated through simulation. V N Gaitonde et al (2006) presented the exit burr formation in drilling us influenced by cutting conditions and drill geometry. They presented the application of Taguchi’s analysis for simultaneous minimization of burr height and burr thickness. In that investigation they found optimal values of cutting speed, feed, point angle and lip clearance angle to minimize burr height and burr thickness during drilling of AlSl 316L stainless steel. Lauderbaugh (2009) used simulation tools and analysis of variance to identify the influence of process parameter on the height of exit burrs and concluded that feed rate, chisel-edge to drill diameter ratio, drill diameter, yield strength and point angle are significant for the height of exit burrs. E.Kilickap (2010) considered application of Taguchi and RSM for minimizing the burr height and surface roughness in drilling Al 7075.The optimization results showed that the combination of low cutting speed, low feed rate and point angle is necessary to minimize both burr height and surface roughness. Sanjib Kundu etal (2014) suggested by Taguchi’s method to minimize drilling burr of an aluminium alloy using HSS drill within the domain of experiments considered using a back-up support. It is found out that back-up support yields much better result than that of normal drilling process. Moderate cutting velocity, low feed and wet condition with water cooling were observed to minimize burr height using a back-up support. Machining environment is found to be the most significant parameter for reducing burr height. Das, R, Barik, T (2014) conducted an experimental study and analysis on burr formation on the aluminum channel in drilling process with backup support. ANOVA results found that the drill bit diameter and spindle speed are most effecting parameters in burr formation. Based on the experimental results they concluded that the burr formation in channels highly depends on the spindle speed. The thickness of the channels also effect the burr formation i.e. the higher thickness channel needs more force during drilling. There an optimum spindle speed exists for a selected channel thickness, for which the average burr height is lowest.
1.2. Back ground on Aluminium Alloys
50
2. Experimental Procedure
2.1. Material
The composition of Alluminium 2014 alloy consists of Chromium: 0.1%, Copper: 3.9% - 5%, Iron: 0.5% ,Magnesium: 0.2% - 0.8%,Manganese: 0.4 - 1.2%, Silicon: 0.5% - 0.9 Titanium: 0.15%, Titanium : 0.2% Zinc: 0.25% and remaining is alluminium.
2.2. Schematic machining:
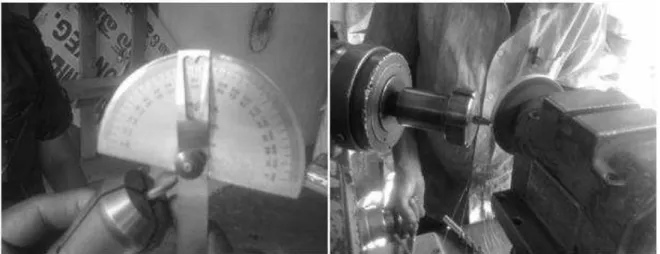
In this study, the experiments were carried out on a CNC vertical machining center (KENT and ND Co. Ltd, Taiwan make) shown in Figure2 to perform different size of holes on Alluminium 2014 alloy work pieces by alter the point and clearance angles on standard HSS twist drill bits using tool and cutter grinder as shown in Figure3 and maintain constant helix angle of 45 degrees. Furthermore the cutting speed (m/min), the feed rate (mm/rev) and drill diameter are regulated in this experiment.
Figure 2. CNC machining center, controller and fixing a work piece in a wise
51
3. Motivation of The Present Work
3.1. Methodology
The orthogonal array forms the basis for the experimental analysis in the Taguchi method. The selection of orthogonal array is concerned with the total degree of freedom of process parameters. Total degree of freedom (DOF) associated with five parameters is equal to 10 (5X2).The degree of freedom for the orthogonal array should be greater than or at least equal to that of the process parameters. There by, a L27 orthogonal array having degree of freedom equal to (27-1) 26 has been considered, which is used to optimize the cutting parameters for surface roughness and circularity deviation using the S/N ratio and ANOVA for machining of Alluminium 2014 alloy and predicted results were nearer to the experimental results. Although similar to design of experiment (DOE), the taguchi design only conducts the balanced (orthogonal) experimental combinations, which makes the taguchi design even more effective than a fractional factorial design. By taguchi techniques, industries are able to greatly reduce product development cycle time for design and production, therefore reducing costs and increasing profit. Confirmation test have been carried out to compare the predicted values with the experimental values confirm its effectiveness in the analysis of burr height and thickness.
3.2. Experimentation as per Taguchi Method:
A plan of experiments based on Taguchi technique has been used to acquire the data. An orthogonal array, signal to noise (S/N) ratio and analysis of variance (ANOVA) are employed to investigate the drilling characteristics of Alluminium alloys using HSS twist drill bits. The complete procedure in Taguchi design method can be divided into three stages: system design, parameter design, and tolerance design. Of the three design stages, the second stage – the parameter design – is the most important stage. Taguchi’s orthogonal array (OA) provides a set of well-balanced experiments (with less number of experimental runs), and Taguchi’s signal-to-noise ratios (S/N), which are logarithmic functions of desired output in the optimization process. Taguchi method uses a statistical measure of performance called signal-to-noise ratio.
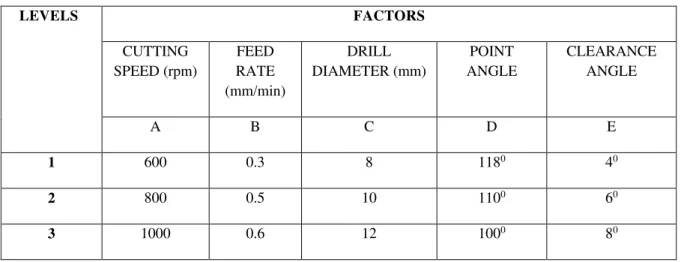
The S/N ratio takes both the mean and the variability into account. The S/N ratio is the ratio of the mean (Signal) to the standard deviation (Noise). The ratio depends on the quality characteristics of the product/process to be optimized. The machining parameters and their levels are given in Table1. Plan of experiments based on Taguchi orthogonal array and observed responses shown in Table 2.
Table 1. Machining parameters and their levels
LEVELS FACTORS
CUTTING SPEED (rpm)
FEED RATE (mm/min)
DRILL DIAMETER (mm)
POINT ANGLE
CLEARANCE ANGLE
A B C D E
1 600 0.3 8 1180 40
2 800 0.5 10 1100 60
52 Table 2. Plan of experiments based on Taguchi orthogonal array and observed responses
R
U
N
S
TAGUCHI RESPONSE DESIGN TABLE
CUTTING SPEED (RPM) FEED RATE (mm/min) DRILL DIAMETER (MM) POINT ANGLE (Degrees) CLEARANCE ANGLE (Degrees) BURR HEIGHT (mm) BURR THICKNESS (mm)
A B C D E H T
1 1 1 1 1 1 0.256 0.188
2 1 1 1 1 2 0.248 0.176
3 1 1 1 1 3 0.237 0.173
4 1 2 2 2 1 0.277 0.218
5 1 2 2 2 2 0.265 0.192
6 1 2 2 2 3 0.236 0.204
7 1 3 3 3 1 0.235 0.168
8 1 3 3 3 2 0.293 0.251
9 1 3 3 3 3 0.262 0.187
10 2 1 2 3 1 0.335 0.252
11 2 1 2 3 2 0.253 0.164
12 2 1 2 3 3 0.342 0.224
13 2 2 3 1 1 0.246 0.159
14 2 2 3 1 2 0.212 0.181
15 2 2 3 1 3 0.181 0.173
16 2 3 1 2 1 0.303 0.219
17 2 3 1 2 2 0.226 0.165
18 2 3 1 2 3 0.252 0.261
19 3 1 3 2 1 0.214 0.187
20 3 1 3 2 2 0.216 0.184
21 3 1 3 2 3 0.243 0.224
22 3 2 1 3 1 0.248 0.209
23 3 2 1 3 2 0.247 0.231
24 3 2 1 3 3 0.176 0.181
25 3 3 2 1 1 0.181 0.162
26 3 3 2 1 2 0.241 0.173
53 3.3. Analysis of the S/N Ratio
In the Taguchi method, the term ‘signal’ represents the desirable value (mean) for the output characteristic and the term ‘noise’ represents the undesirable value (Standard Deviation) for the output characteristic. S/N ratio used to measure the quality characteristic deviating from the desired value. The S/N ratio = -10 log (M.S.D), Where M.S.D is the mean square deviation for the output characteristic. The S/N ratio table for observed responses is shown in Table 3.
Table 3. Signal to Noise Ratios for Smaller is better
Level cutting speed(rpm)
A
feed rate (mm/min)
B
drill diameter(mm) C
point angle(Deg) D
clearance angle(Deg)
E
1 -3. 41537 -2.34983 -2.66149 -2. 45334 -2.48120 2 -2. 30518 -2. 69728 -2.27044 -3. 19912 -2.50395
3 -2.52802 -3. 21147 -3.32665 -2.60612 -3.27343 Delta 0.90265 2.48145 1.25522 1.35623 0.63203
Rank 4 1 3 2 5
4. Results and Discussions
From main effects plot of S/N ratio for, the optimum parameters combination for burr height and burr thickness are A2B1C2D1E1 corresponding to the largest values of S/N ratio for all control parameters. From Table 3, it is observed that feed rate, point angle, drill diameter, cutting speed and clearance angle has the order of influence on burr height and burr thickness during drilling of Al 2014 alloy.
54 Figure5. Interaction plot for burr height
Figure6. Interaction plot for burr thickness
5. Results Of ANOVA
The purpose of the analysis of variance (ANOVA) is to investigate which design parameters significantly affect the quality characteristic.
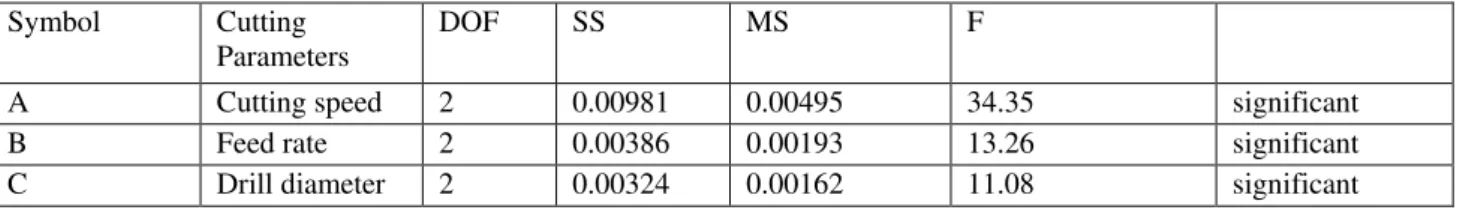
Table 3 shows the results of ANOVA for burr height, cutting speed, feed rate, drill diameter, point angle and clearance angle are the significant cutting parameters for affecting the burr height.
Table 4 shows the results of ANOVA for burr thickness, cutting speed, feed rate, drill diameter, point angle and clearance angle are the significant cutting parameters for affecting the burr thickness. Table 3: Results of ANOVA for burr height
Table 3: Results of ANOVA for burr height
Symbol Cutting Parameters
DOF SS MS F
A Cutting speed 2 0.00981 0.00495 34.35 significant
B Feed rate 2 0.00386 0.00193 13.26 significant
55
D Point angle 2 0.00584 0.00292 23.5 significant
E Clearance
angle
2 0.00120 0.00060 5.83 significant
Error 16 0.001926 0.00012
Total 26 0.023976
F table at 95%confidence level is F0.05, 2, 16 = 3.63, F exp≥ F table
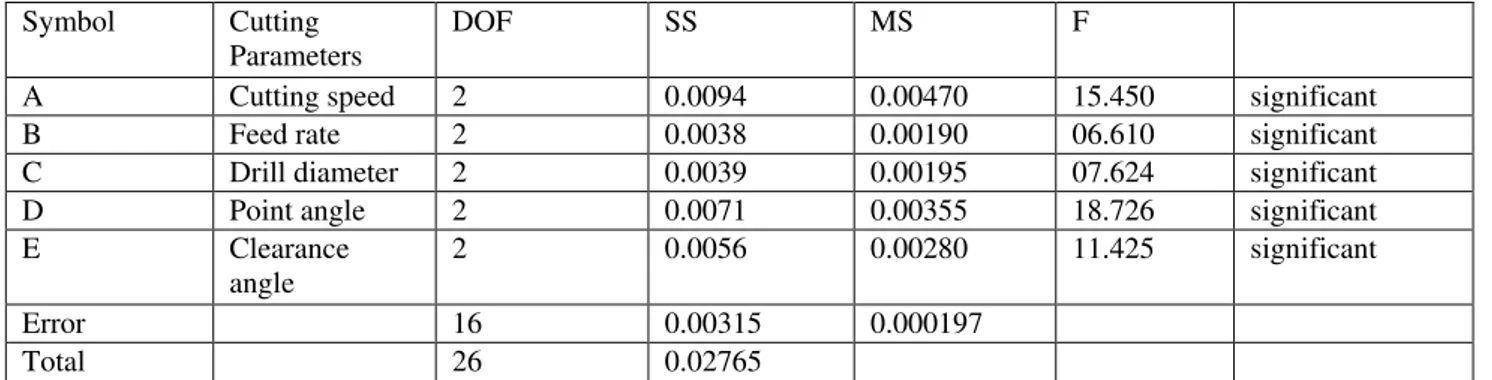
Table 4. Results of ANOVA for burr thickness
Symbol Cutting Parameters
DOF SS MS F
A Cutting speed 2 0.0094 0.00470 15.450 significant
B Feed rate 2 0.0038 0.00190 06.610 significant
C Drill diameter 2 0.0039 0.00195 07.624 significant D Point angle 2 0.0071 0.00355 18.726 significant
E Clearance
angle
2 0.0056 0.00280 11.425 significant
Error 16 0.00315 0.000197
Total 26 0.02765
F table at 95%confidence level is F0.05, 2, 16 = 3.63, F exp≥ F table
Table 5. Optimal values of individual machining characteristics
machining characteristics
Optimal combination of parameters
Significant
parameters(at 95% confidence level)
Predicted optimum value
Experimental value
Burr height (H) A2B1C2D1E1 A,B,C,D,E 0.232 0.2622
Burr thickness (T) A2B1C2D1E1 A,B,C,D,E 0.173 0.1843
Confirmatory experiments were conducted for burr size corresponding their optimal setting of process parameters to validate the used approach and obtained the values of 0.232mm, 0.173mm for burr height, burr thickness respectively. Predicted and experimental values of responses are depicted in table5.
6. Conclusions
The machining characteristics of Al 2014 alloy have been studied. The primary machining characteristics such as burr height and burr thickness were studied for drilling. The results obtained from the experiments as follows.
From S/N Ratio response graph, the combination of parameters having the values of 800 rpm, 0.3 mm/min ,10mm.118 degrees and 4 degrees obtained for cutting speed, feed rate drill diameter, point angle and clearance angle respectively for optimizing burr size.
From the results of ANOVA for cutting speed, feed rate, drill diameter, point angle and clearance angle, all parameters are significant for all responses, for this cutting speed, drill geometry are more significant.
References
J.C. Aurich. Burrs: Analysis, control and removal CIRP Annals - Manufacturing Technology,
58 (2009) 519
–
542.
56