CPD
6, 1421–1452, 2010Earth as diode
R. Y. Anderson
Title Page
Abstract Introduction
Conclusions References
Tables Figures
◭ ◮
◭ ◮
Back Close
Full Screen / Esc
Printer-friendly Version Interactive Discussion
Discussion
P
a
per
|
Dis
cussion
P
a
per
|
Discussion
P
a
per
|
Discussio
n
P
a
per
|
Clim. Past Discuss., 6, 1421–1452, 2010 www.clim-past-discuss.net/6/1421/2010/ doi:10.5194/cpd-6-1421-2010
© Author(s) 2010. CC Attribution 3.0 License.
Climate of the Past Discussions
This discussion paper is/has been under review for the journal Climate of the Past (CP). Please refer to the corresponding final paper in CP if available.
Earth as diode: monsoon source of the
orbital
∼
100 ka climate cycle
R. Y. Anderson
Department of Earth and Planetary Sciences, University of New Mexico, Albuquerque, NM 87131, USA
Received: 8 May 2010 – Accepted: 20 July 2010 – Published: 10 August 2010
Correspondence to: R. Y. Anderson ([email protected])
CPD
6, 1421–1452, 2010Earth as diode
R. Y. Anderson
Title Page
Abstract Introduction
Conclusions References
Tables Figures
◭ ◮
◭ ◮
Back Close
Full Screen / Esc
Printer-friendly Version Interactive Discussion
Discussion
P
a
per
|
Dis
cussion
P
a
per
|
Discussion
P
a
per
|
Discussio
n
P
a
per
|
Abstract
A potential source for Earth’s enigmatic∼100 ka climate cycle, which is found in many
ancient geological records at low latitudes and also in the pacing of glaciation during the late Pleistocene, is traced to a climatic rectifying process inherent in the monsoon. Seasonal information needed to identify the rectifying mechanism is preserved within 5
varves of a continuous, 200 ka recording of annual maximum surface temperature (Tmax) from the equator of Western Pangea. Specific seasonal reactions recorded in varves show how the monsoon reacted to seasonal differences in insolation at equinox to produce a 11.7 ka semi-precession cycle inTmax. At solstice, anti-phasing of insola-tion in the Northern and Southern Hemispheres, intensified and focused by a highly 10
asymmetric Pangea relative to the equator, produced a strong equatorial maritime monsoon that performed a nonlinear rectifying function similar to that of a simple rec-tifying diode. Expressed in the resulting varve series are substantial cycles inTmax of 100 ka, 23.4 ka, and 11.7 ka. Importantly, any external or internal forcing of the tropical (monsoon) climate system at higher-than-orbital frequencies (e.g. solar, ENSO) should 15
also be amplified at Milankovitch frequencies by the monsoon.
1 Introduction
Earth’s most prominent and mysterious climatic cycle has eluded explanation since the Scottish scientist James Croll (1864) proposed that the great Ice Ages in Europe were paced by the∼100 ka eccentricity cycle in Earth’s orbit around the Sun – even as he 20
knew that the nearly circular orbit at the highest eccentricity values could not supply the difference in solar insolation needed to induce glaciation. Since Croll, the mystery has deepened with increasing clarity of the glacial-orbital-climate association and other at-tempts at explanation (Roe and Allen, 1999). Given that there is almost no forcing from Earth’s slightly eccentric orbit, the 41 ka obliquity modulation of insolation has been 25
CPD
6, 1421–1452, 2010Earth as diode
R. Y. Anderson
Title Page
Abstract Introduction
Conclusions References
Tables Figures
◭ ◮
◭ ◮
Back Close
Full Screen / Esc
Printer-friendly Version Interactive Discussion
Discussion
P
a
per
|
Dis
cussion
P
a
per
|
Discussion
P
a
per
|
Discussio
n
P
a
per
|
of skipping one or two glacial melting (insolation) cycles (Huybers and Wunsch, 2005). Forcing from obliquity however, in being restricted to high and middle latitudes, can-not account for the commonplace occurrence of∼100 ka stratigraphic-climate cycles
in ancient sediments at low latitudes during the Mesozoic Era (e.g., Oglesby and Park, 1989; Bond et al., 1993; Olsen and Kent, 1996; Herbert, 1997).
5
Here, recognizing that variable insolation from the tilt of Earth’s axis is unlikely to account for∼100 ka climate cycles at low latitudes, and based on an exceptional
an-nual recording of Late Permian monsoonal climate from near the equator, I suggest that the monsoon, through a climatic rectifying mechanism related to Pangean geogra-phy, transformed what is commonly thought to be negligible orbital forcing into strong 10
∼100 ka cycles in surface temperature. After a brief summary of previous work in
sup-port of a rectifying mechanism, I document how the monsoon functioned somewhat in the manner of a simple diode to transform seasonal differences in insolation, as mod-ulated by Earth’s precession and eccentric orbit, into a substantial ∼100 ka tropical
climate cycle. 15
The rare geological recording presented and discussed here measured monsoon reactions to forcing across the entire climate continuum from seasons to Milankovitch cycles. During the Late Permian (−255 ma), the Delaware Basin that contains the
an-nual climatic record, and presently is in southeastern New Mexico, USA, was located on the extremely arid western coast of Pangea, and near, or possibly directly on, the 20
equator (Fig. 1a). There, seasonally deposited layers of evaporite minerals formed a continuous series of 209 000 varves (Fig. 1e) that comprise the Castile (evaporite) Fm. Castile varves are entirely monsoonal in origin and recorded the reactions of a strong regional monsoon. Testifying to the strength and persistence of the monsoon and to the annual character of evaporite laminations is a complete suite of Milankovitch 25
CPD
6, 1421–1452, 2010Earth as diode
R. Y. Anderson
Title Page
Abstract Introduction
Conclusions References
Tables Figures
◭ ◮
◭ ◮
Back Close
Full Screen / Esc
Printer-friendly Version Interactive Discussion
Discussion
P
a
per
|
Dis
cussion
P
a
per
|
Discussion
P
a
per
|
Discussio
n
P
a
per
|
geography of Pangea, a powerful monsoon, and a geological recording that unambigu-ously identifies how the monsoon functioned to rectify orbit-modulated insolation, and thereby enhance the tropical climate system’s sensitivity to Milankovitch and higher frequencies of forcing.
1.1 Historical background
5
Although Late Pleistocene glaciation has a∼100 ka beat, it is well known that changes
in insolation due to changes in a slightly eccentric orbit lack the strength or forcing needed to regulate multiple episodes of glaciation. Changes in insolation, as modu-lated by EC, are thought to have essentially no forcing effect on climate, as is illustrated in a Precession Index (PI) that defines changes in insolation at the top of the atmo-10
sphere. The PI (εsinω) is a sine wave function of Earth’s precessional motion in an eccentric orbit (Ruddiman, 2008), and changes in eccentricity of the orbit (εterm in the index) introduce a systematic modulation in the amplitude of 23 ka cycles of precession (CP) over the course of 4 to 5 CP cycles (Fig. 2a).
The modulation of the CP cycle in the PI, as introduced byε, has periods of∼100 ka 15
and∼400 ka from changes orbital eccentricity. This modulation in the PI, however, is
not considered a real cycle in terms of insolation forcing of the climate system (Ruddi-man, 2008) because∼100 ka and∼400 ka cycles are opposed at the upper and lower
bounds of an envelope that defines the PI (Fig. 2a). As a result, both of the EC cycles are thought to cancel, as is confirmed by finding no spectral energy in the PI at peri-20
ods of∼400 ka and ∼100 ka (Fig. 2b). If, however, a nonlinear function is applied to
the CP insolation forcing (Wigley, 1976), as is most simply illustrated by cropping (clip-ping) negative values from the PI (Fig. 2c), then the low frequency modulation is no longer canceled, the PI series has beenrectified, and power appears in the spectrum at∼400 ka and∼100 ka (Fig. 2d).
25
CPD
6, 1421–1452, 2010Earth as diode
R. Y. Anderson
Title Page
Abstract Introduction
Conclusions References
Tables Figures
◭ ◮
◭ ◮
Back Close
Full Screen / Esc
Printer-friendly Version Interactive Discussion
Discussion
P
a
per
|
Dis
cussion
P
a
per
|
Discussion
P
a
per
|
Discussio
n
P
a
per
|
geologists (cited in Herbert and Fischer), by noting how 4 to 5 layers of strata, as-signed by available age control to the CP climate cycle, commonly were “bundled” into larger (thicker) units, such that a bundle represented a cycle of∼100 ka. Herbert
and Fischer also illustrated changes in composition in Cretaceous strata that show how stratigraphic bundles were constructed from systematic amplitude modulations of 5
∼100 ka and∼400 ka in the composition of strata assigned to CP (Fig. 2e).
At least one Cretaceous geologic record has enough resolution to have recorded a half-cycle of CP (semi-precession, SP; Park et al., 1993), and its location as much as 30◦N of the paleoequator suggests a strong response to a rectified orbital forcing during the Mesozoic Era. However, a low-latitude climatic response to orbital forcing 10
encounters the same obstacle in forcing that doomed James Croll’s theory in that there are only minor differences in insolation from Earth’s eccentric orbit. If, however, the
∼100 ka amplitude modulation of insolation is clipped at the equator by some unknown
mechanism, then a substantial orbital forcing would affect the tropical climate system. That a climatic process might perform the nonlinear clipping function of Wigley (1976) 15
was recognized serendipitously by Short et al. (1991) in experiments conducted with a seasonal energy balance climate model (EBM) that generated 800 ka series of an-nual maximum temperature (Tmax) at high resolution. Tmax displayed strong cycles of
∼100 ka and also strong SP cycles, only at the equator, and Short et al. likened the
EBM reaction to that of a rectifying diode, as when the carrier wave (CP) has been 20
clipped (rectified), as in Fig. 2c. When the EBM experiment was repeated for Pangean geography, the rectifying effect, as defined by spectral power in ∼100 ka and SP
cy-cles, more than doubled, suggesting that the huge landmass and powerful monsoonal circulation of the supercontinent was in some way involved in the rectifying process (Crowley et al., 1992).
25
1.2 Previous geological examples
CPD
6, 1421–1452, 2010Earth as diode
R. Y. Anderson
Title Page
Abstract Introduction
Conclusions References
Tables Figures
◭ ◮
◭ ◮
Back Close
Full Screen / Esc
Printer-friendly Version Interactive Discussion
Discussion
P
a
per
|
Dis
cussion
P
a
per
|
Discussion
P
a
per
|
Discussio
n
P
a
per
|
and Mix (1985, 1987) reported a rectified recording of dust shed from the African con-tinent into the Atlantic by the monsoon. Pestiaux et al. (1986) reported harmonics of CP in a marine isotopic record of the Indian monsoon; harmonics are the signature of a rectified forcing signal (Hagelberg et al., 1994). In addition, climate proxies having the period of semi-precession (2nd CP harmonic) were reported by Hagelberg et al. (1994) 5
and by McIntyre and Molfino (1996). Olsen and Kent (1996) described a long record of monsoon-supported changes in lake level in Upper Triassic Pangea that contains cycles of∼400 ka and∼100 ka, as is expected if the recording had been rectified.
Although these few geological records document clipping, their having been recti-fied climatically has been questioned because they do not explicitly exclude clipping by 10
nonlinear geological recording processes (Huybers and Wunsch, 2003). The compet-ing explanation for why such records are rectified and display harmonics is that clippcompet-ing was accomplished by nonlinear reactions to seasonally imposed thresholds that are in-herent in some geological and biological recording processes; e.g. erosion, deposition, non-deposition, sediment transport and properties (grain size, etc.), or biologic growth 15
cycles (Huybers and Wunsch, 2003). One possible example, suggested by Crowley et al. (1992), is the ∼100 ka, monsoon-regulated changes in Triassic lake levels, for
which episodes of non-deposition of lake sediments are cited as a possible geological threshold mechanism. Because mechanical geological processes were partly respon-sible for producing ancient, 100-ka stratigraphic bundles, the EC cycles described by 20
Herbert and Fischer (Fig. 2e), also are suspected of being geological recording arti-facts.
In order to show that an entirely climatic mechanism rectified the CP forcing, a later section of this report (5.1) rules out geological/biological recording processes as con-tributors to the rectifying process. After describing previous information on the Castile 25
CPD
6, 1421–1452, 2010Earth as diode
R. Y. Anderson
Title Page
Abstract Introduction
Conclusions References
Tables Figures
◭ ◮
◭ ◮
Back Close
Full Screen / Esc
Printer-friendly Version Interactive Discussion
Discussion
P
a
per
|
Dis
cussion
P
a
per
|
Discussion
P
a
per
|
Discussio
n
P
a
per
|
2 Geologic-hydrologic setting and varves of Castile evaporite
The laminated Castile evaporite accumulated in a bathymetrically deep basin on the extremely arid equatorial western coast of Pangea (Fig. 1a, S1). The 25 000 km2basin was encircled by a tall reef, and once cut offfrom the ocean, the isolated “lake” main-tained its water level from ocean-sourced groundwater recharge seeping through the 5
reef and from elsewhere. In an arid climate, water in the basin quickly concentrated to a chloride brine in which dense, non-circulating brine below was overlain by a layer of less dense circulating brine that was separated by a well developed pycnocline. The deep Castile brine pool has a close modern analog in the Dead Sea (Anati, 1997), both having intermittent pycnoclines (see Supplement S2.1, Fig. S1).
10
Varves composed of crystals of calcite (CaCO3) and gypsum (CaSO4·2H2O) were chemically precipitated at the air-brine interface in response to seasonal differences in salinity from evaporative concentration, the latter largely controlled by surface temper-ature. Nucleation occurred as seasonal increases in evaporative concentration near the interface exceeded solubility products of calcium and bicarbonate and calcium and 15
sulfate. Calcite and gypsum crystals that grew near the brine’s surface rained through the upper brine layer and the stagnant lower brine layer to settle directly on the floor of the basin where they accumulated as discrete layers of calcite, seasonally alternating with layers of gypsum that converted, diagenetically, to layers of anhydrite. Correlation coefficients of +0.99 in groups of seasonal laminations over tens of kilometers (Kirk-20
land, 2003) testify to a uniform salinity and efficient circulation in the upper brine layer, where ions removed at the brine-air interface were replaced from circulating brine.
2.1 Castile varves
Over 90% of the Castile varves were chemically precipitated under usual or ordinary climatic conditions, and these are composed of thin, dark-colored seasonal layers of 25
CPD
6, 1421–1452, 2010Earth as diode
R. Y. Anderson
Title Page
Abstract Introduction
Conclusions References
Tables Figures
◭ ◮
◭ ◮
Back Close
Full Screen / Esc
Printer-friendly Version Interactive Discussion
Discussion
P
a
per
|
Dis
cussion
P
a
per
|
Discussion
P
a
per
|
Discussio
n
P
a
per
|
carbonate layer with the underlying sulfate layer typically is sharp, whereas the upper contact of carbonate with the overlying seasonal sulfate layer is gradational.
The darker-colored carbonate layer precipitated as tiny crystals of calcite mixed with algal organic matter. Occasionally, prolonged episodes of freshening, induced largely by reduced evaporation at the interface, lowered salinity enough to completely eliminate 5
the seasonal sulfate layer, leaving stratigraphic units of pure, algal-laminated limestone that comprise∼2% of the varves. Under prolonged conditions of high surface
tempera-ture and evaporation, a drawdown in brine level was accompanied by increased salinity and high brine density that eliminated the pycnocline and resulted in overturn and deep circulation of brine (S2.1, Fig. S1). Circulation and mixing of brine greatly increased the 10
rate of sulfate precipitation to produce anomalously thick and diagenetically distorted seasonal layers of calcium sulfate (Fig. 1d). Episodic overturn, probably triggered by strong winds, persisted from a few decades to over a century, and about 3% of varves were anomalously thickened. During episodes of extreme drawdown, when concen-tration of brine exceeded the solubility of NaCl, layers of halite precipitated seasonally 15
and alternated with layers of calcium sulfate (Fig. 1d).
The different petrologic types of varves are organized into stratigraphic units that represent increasing and decreasing salinity, and which, when complete, progress from laminated limestone at the base to calcite-laminated anhydrite, to thick, distorted layers of anhydrite, and finally to anhydrite laminated halite (Fig. 1d). The average 20
duration of a petrologic cycle is roughly 2 ka, and the corresponding climatic cycle is referred to here as a Quasi-bi-millennial Oscillation (QBMO). Most QBMO’s are re-stricted to units of calcite-laminated anhydrite, but the QBMO also includes complete stratigraphic-salinity units and is the most visually obvious of the climate-driven cycles. In the 90+% of ordinary varves, calcium sulfate averages 85%, by weight, and the 25
CPD
6, 1421–1452, 2010Earth as diode
R. Y. Anderson
Title Page
Abstract Introduction
Conclusions References
Tables Figures
◭ ◮
◭ ◮
Back Close
Full Screen / Esc
Printer-friendly Version Interactive Discussion
Discussion
P
a
per
|
Dis
cussion
P
a
per
|
Discussion
P
a
per
|
Discussio
n
P
a
per
|
of the year, varve thickness serves as a reasonable estimator (proxy) of changes in annual maximum surface temperature (Tmax).
3 Methods and previous Castile information
Standard Fourier methods were employed in estimating the distribution of spectral power, principally multi-taper (MTM) analysis (Dettinger et al., 1995) as implemented 5
by kSpectra Toolkit for Mac OS X, and by Analyseries (Paillard et al., 1996). Analy-sis employed computation of Periodograms, Blackman-Tukey and Maximum Entropy spectra, and the use of Wavelet Analysis (Torrence and Compo, 1998). All methods resolved similar spectral responses in the range of precession and its harmonics, and illustrated here are mainly MTM spectra. Spectral analysis was applied to a segment 10
fromT0+11 000 toT0+173 000 yr. Although the complete series has 209 000 varves, the shorter segment avoided less stable hydrologic conditions near the onset and ter-mination of varve accumulation and is believed to provide the best estimates of fre-quency and relative power. All analyses were performed after the entire varve series was interpreted and compiled. Resampling and filtering of the series prior to spectral 15
analysis employed linear interpolation (Analyseries-2, Paillard et al., 1996), and some filtering was accomplished with a weighted triangular filter. Information related to data acquisition and the time series is in the Supplement (S1).
A complete account of the Castile Fm. and its varves, geologic setting, hydrology, and geochemistry is found in Kirkland (2003) and his references. The Castile varve se-20
ries was collected from a single core of the entire Castile Formation with virtually 100% recovery. The thickness of each of 209 000 varves was interpreted and measured by R. Y. Anderson over the course of several years and procedures of varve collection and compilation are published (Anderson, 1982) or are in the supplement (S1).
Owing to the occurrence of less than annual climatic responses (e.g. semi-annual 25
CPD
6, 1421–1452, 2010Earth as diode
R. Y. Anderson
Title Page
Abstract Introduction
Conclusions References
Tables Figures
◭ ◮
◭ ◮
Back Close
Full Screen / Esc
Printer-friendly Version Interactive Discussion
Discussion
P
a
per
|
Dis
cussion
P
a
per
|
Discussion
P
a
per
|
Discussio
n
P
a
per
|
5%. Even so, periods estimated for climatic precession and semi-precession by spec-tral analysis are close to the estimated frequencies of pre-Quaternary Milankovitch cycles (Berger and Loutre, 1989), suggesting a reasonably accurate varve interpreta-tion.
4 Results
5
Effects of insolation on varve thickness (Tmax), as modulated by the precession of Earth’s axis (CP) and by Earth’s eccentric orbit (EC) are visible in an tuned and un-filtered plot of raw, annally measured values of varve thickness (Fig. 3). For example, most observers will recognize 9 to 11 prominent oscillations in densely-plotted (solid-black) values of varve thickness. A filtered value of mean thickness, when placed near 10
the lower bound of dense, solid black values (Fig. 3, lower transparent trace) outlines the prominent oscillation for which a spectrum assigns a period of 23.4 ka, or climatic precession (CP, Fig. 4a). Increasing the mean thickness value by 4X, as depicted by the upper transparent trace in Fig. 3, shows near-maximum values in varve thickness (Tmaxu) that represent warmer than average years that were covariant with minimum 15
values (Tmaxl), and were∼4X more sensitive to changes in insolation than were cooler
than average years. This difference in response to the same forcing resulted in a vari-able but generally “flat” base for theTmaxseries and a highly variable upper bound. The result was a series structure that generally resembles the PI after being subjected to a nonlinear clipping function (compare with Fig. 2c).
20
4.1 Modulated precession (∼100 ka) cycles
CPD
6, 1421–1452, 2010Earth as diode
R. Y. Anderson
Title Page
Abstract Introduction
Conclusions References
Tables Figures
◭ ◮
◭ ◮
Back Close
Full Screen / Esc
Printer-friendly Version Interactive Discussion
Discussion
P
a
per
|
Dis
cussion
P
a
per
|
Discussion
P
a
per
|
Discussio
n
P
a
per
|
period, an oscillation of roughly∼100 ka, which originates as a systematic amplitude
modulation of CP cycles, is assumed in later discussion to represent an EC-modulated insolation forcing. Its period, as estimated by different spectral methods, is within the range of∼85 ka to∼120 ka. The EC modulation accounts for∼35% of total variance.
4.2 Semi-precession cycles (2nd harmonic)
5
Present and observed in the raw annual series are secondary cycles in densely plot-ted data that extend above the upper transparent trace that outlines CP cycles (e.g.
To+48 ka; To is the oldest varve in the series). A spectrum of average decadal thick-ness values (Fig. 4a) identifies two modes of CP to which periods of 23.4 ka and 18.2 ka are assigned, as well as almost precise half-cycles of the two precession modes, at pe-10
riods of 11.7 ka and 9.4 ka. Secondary (SP, 2nd harmonic of CP) maxima, which are recognizable in the upper transparent trace of the plot of raw annual data (Fig. 3), are most readily seen as secondary maxima in a filtered plot of the Castile series (Fig. 4d) where they appear either as separate peaks or as sloped shoulders in several CP cy-cles. Secondary SP maxima lag previous CP minima by several thousand years. The 15
secondary cycles are believed to represent additional forcing from seasonal differences in insolation as the equator passed through the intense solar beam twice annually at equinox to give rise to a semi-precession (SP) cycle inTmax. Together EC, CP, and SP cycles account for∼65% of the variance.
4.3 Harmonics of climatic precession: nonlinear basin-related processes
20
Not as easily recognized as the 2nd harmonic of CP in the raw data series but present in spectra (Fig. 4a) are a less stable 3rd (7+ka) harmonic and a more uniformly ex-pressed 4th (5.4 ka) harmonic of CP. Harmonics of CP derive some of their spectral power from nonlinear hydrodynamic processes that operated within the basin and af-fected varve thickness. Two basin-related, threshold-type reactions are recognized. 25
CPD
6, 1421–1452, 2010Earth as diode
R. Y. Anderson
Title Page
Abstract Introduction
Conclusions References
Tables Figures
◭ ◮
◭ ◮
Back Close
Full Screen / Esc
Printer-friendly Version Interactive Discussion
Discussion
P
a
per
|
Dis
cussion
P
a
per
|
Discussion
P
a
per
|
Discussio
n
P
a
per
|
sudden events of brine freshening, which resulted in anomalously thin varves (e.g. Fig. 3, T0+110 ka). Both processes introduced abrupt transitions in the series that have a potential to distort the amplitude and frequency distribution of spectral power as recorded in varve thickness.
Contributions from basin-sourced hydrodynamic processes were evaluated by se-5
quentially reducing anomalous varve thickness values and examining effects on re-sulting spectra (see supplement, S2.2, Fig. S2a, b). Mean thickness is 1.8 mm, and reducing maximum thickness values to 5 mm and then to 3 mm produced no shift in the frequency of any spectral peaks. In addition, power at the fundamental precession fre-quency remained largely unchanged, whereas power at harmonic frequencies of CP, 10
especially 2nd and 3rd harmonics (Fig. S2c, d), was reduced by about half.
Exaggeration of spectral power at harmonic frequencies of CP was confirmed by applying a 2 ka moving variance to accentuate the square-wave character of over-turn and freshening events (see supplement, Fig. S2c, d). These abrupt events add sharp “corners” to the series, which is known to introduce an analytical artifact that 15
increases power (Hagelberg et al., 1994) and is inherent in the Fourier method (Dima and Lohmann, 2009).
Importantly, removing anomalous thickness values provides a series and spectrum that more accurately characterizes the surface temperature (Tmax) response to forcing, as in Fig. 4a where Castile and Pangean EBM spectra are compared. Also, because 20
the fundamental period of CP was largely unaffected by nonlinear, basin-related hy-drodynamic processes, the contribution of CP to a rectified ∼100 ka forcing and the
conclusions of this report are not materially effected by artifacts associated with har-monics.
4.4 Quasi-bi-millennial climatic oscillation (QBMO)
25
CPD
6, 1421–1452, 2010Earth as diode
R. Y. Anderson
Title Page
Abstract Introduction
Conclusions References
Tables Figures
◭ ◮
◭ ◮
Back Close
Full Screen / Esc
Printer-friendly Version Interactive Discussion
Discussion
P
a
per
|
Dis
cussion
P
a
per
|
Discussion
P
a
per
|
Discussio
n
P
a
per
|
process. The QBMO, in the plot of raw annual varve thickness (Fig. 3), appears as clusters of thick varves well above the upper transparent trace that defines CP-SP cycles. Here it is sufficient to note that spectral power of the QBMO (not illustrated) outranks 3rd and 4th harmonics of CP, is present throughout the series, and has power concentrated in a relatively narrow band at 2.3 ka.
5
5 Other observations related to interpretation
The Castile series offers two approaches to demonstrating that an enhanced, rectified reaction to orbital forcing is a climatic rather than a geologic phenomenon. One is by ruling out or limiting nonlinear geological recording processes as rectifying agents, and the other is from comparing effects of clipping in the natural Castile series with those 10
generated by the EBM for Pangea (Short et al., 1990; Crowley et al., 1991), a climate model that has no geological component.
5.1 Linear geochemical recording system
An entirely climatic rectifying mechanism is assured by the Castile series’ geological recording system, which, by being entirely geochemical, effectively rules out nonlin-15
ear contributions from mechanical geological recording processes that are sensitive to seasonal thresholding (Huybers and Wunsch, 2003). Exclusion of seasonal threshold effects in the Castile is affirmed in observations carried out on the body of brine in the Dead Sea, which provides a modern analog in having a brine composition similar to Castile chloride-sulfate brine, as well as a similar density. Resnik et al. (2009) directly 20
observed mineral precipitation of gypsum in the Dead Sea and showed it to be a linear function of salinity and density, a result that is consistent with laboratory studies of gyp-sum nucleation (Presciandaro, 2001). Dead Sea brine is continuously saturated with respect to gypsum, which chemically precipitates throughout the year and thereby has no threshold reaction to seasonal changes in salinity.
CPD
6, 1421–1452, 2010Earth as diode
R. Y. Anderson
Title Page
Abstract Introduction
Conclusions References
Tables Figures
◭ ◮
◭ ◮
Back Close
Full Screen / Esc
Printer-friendly Version Interactive Discussion
Discussion
P
a
per
|
Dis
cussion
P
a
per
|
Discussion
P
a
per
|
Discussio
n
P
a
per
|
Other observations of density (salinity) and temperature of surface brine in the Dead Sea, carried out over an 18 month interval, demonstrate a virtual obligatory correla-tion ofr2=0.99 between salinity and temperature over a 13 K range in seasonal tem-perature (Fig. 1c) (Gertman et al., 2009). Thus, for the Castile series, all reactions to changes in surface temperature (Tmax), as observed in evaporative concentration, salin-5
ity, and sulfate precipitation, involved no substantial thresholding and provided a nearly linear recording system for changes inTmax.
Once nucleated, crystals of calcite and gypsum rained directly to the floor of the ancient evaporite basin to form seasonal layers that have almost no change in thickness over the entire∼25 000 km2 Delaware basin. Such lateral continuity establishes that
10
subsequent nonlinear mechanical geological process, such as bottom currents, did not alter primary changes varve thickness. Other potential nonlinear processes such as runoffor the relation between temperature and saturation vapor pressure in monsoon precipitation (Kutzbach and Guetter, 1986) are not expected because the evaporite contains no clastic (runoff) particles (Kirkland, 2003), and extreme aridity, as indicated 15
by the evaporite, discounts a vapor pressure effect.
5.2 Mutual validation of rectified Castile and EBM series
The geographical EBM experiment conducted for Pangea by Crowley et al. (1992) for-tuitously has provided a long, rectified, high-resolution, model-generated series ofTmax values for the Pangean equator that can be compared with the Castile series’ natural 20
response to forcing. The two records, both their series and spectra, have sufficient similarity to assure a mutual validation, along with their support for a climatic rectify-ing mechanism. For example, both the EBM and CastileTmaxseries exhibit a∼100 ka
oscillation that originates in an amplitude-modulation of CP, and for which lower and upper bounds ofTmax are covariant in a similar, ∼1/4 ratio (Figs. 3, 4d). Both series
25
captured the effect of SP (heating of the equator at equinox) as secondary peaks in
CPD
6, 1421–1452, 2010Earth as diode
R. Y. Anderson
Title Page
Abstract Introduction
Conclusions References
Tables Figures
◭ ◮
◭ ◮
Back Close
Full Screen / Esc
Printer-friendly Version Interactive Discussion
Discussion
P
a
per
|
Dis
cussion
P
a
per
|
Discussion
P
a
per
|
Discussio
n
P
a
per
|
Castile and EBM-generated series have remarkably similar ratios in spectral vari-ance for the three strongest forcings of EC, CP, and SP after removing noise (Fig. 4a). Inasmuch as the EBM-generated series has no geological component, it is plausible that Castile varves and their entirely geochemical and linear recording system captured the full effect onTmax of climatic rectifying processes. These important similarities in 5
Castile and EBM series and spectra are expected if both records were rectified by a common climatic process.
6 Discussion – climatic rectifying mechanisms
The EBM experiments of Short et al. (1991) and Crowley et al. (1992) do not identify climatic processes, but the high, 1/4 ratio in covariant bounds that define EC oscilla-10
tions inTmaxfor Pangea (Fig. 4e), as compared to less than a∼1/2 ratio for the present
continents, implicates the Pangean monsoon. The monsoon reaction to Pangean ge-ography, as is documented through seasonal associations in Castile varves, fills in causal information that is missing in EBM output and shows, specifically, how the mon-soon functioned as a nonlinear rectifying agent.
15
That the monsoon reacts nonlinearly to orbital forcing was indicated in Kutzbach’s (1981) early climatic modeling experiments with the African monsoon, and seasonal differences in insolation have since been shown to be critical in the monsoon’s enhanced reaction to orbital parameters (Braconnot et al., 2008). However, for lack of seasonal information in geological recordings, almost nothing is known about physical 20
processes that might enhance the monsoon, other than that they must operate sea-sonally. Previous descriptions of the suspected process are necessarily generalized and stated as the climate system reacting to the largest seasonal difference in insola-tion (Huybers and Wunsch, 2003), as a lack of climate sensitivity to insolainsola-tion minima (Hagelberg et al., 1994), and as a process of maximum and minimum selection of sea-25
CPD
6, 1421–1452, 2010Earth as diode
R. Y. Anderson
Title Page
Abstract Introduction
Conclusions References
Tables Figures
◭ ◮
◭ ◮
Back Close
Full Screen / Esc
Printer-friendly Version Interactive Discussion
Discussion
P
a
per
|
Dis
cussion
P
a
per
|
Discussion
P
a
per
|
Discussio
n
P
a
per
|
as a potential rectifier are seasonal differences in insolation from semi-annual passing of the Sun over the equator (equinox).
6.1 Clipping from equinox
In the EBM experiment for Pangea reported by Crowley et al. (1992), they suggested that at least some of the rectifying effect found in EBM-generatedTmax at the equator 5
was acquired from differences in insolation as the Sun moves over land, twice annually at equinox. They showed how combined differences in insolation at perihelion and equinox, over the course of several precession cycles, resulted in clipped minimum values in Tmax, and added secondary (SP) maxima to the Tmax series (Figs. 2f, 4e). Reactions of Tmax to insolation over land are essentially linear (Crowley, 1992), so 10
that primary (CP) and secondary (SP) cycles are clipped in the insolation forcing, as depicted in the “flat base” inTmaxin Fig. 2f. Subsequently, Ashkenazy and Gildor (2008) show how alignment of equinox, precession, and eccentricity orbital parameters results in cycles of 11.5 ka,∼100 ka and∼400 ka in maximum insolation at the equator. Such
rectifying or clipping of insolation by orbital parameters would mean that the monsoon 15
was a reactive climatic agent in its response to a rectified forcing, as opposed to an active rectifying agent as for the solstice process.
Secondary SP maxima in the EBM-generated Tmax series for Pangea lag previous CP minima and are clearly resolved in each EBM CP cycle (Fig. 4e), where some less-prominent maxima appear as sloping “shoulders.” Secondary maxima in the Castile 20
Tmax series resemble those in the EBM-generated series, and at least 3 maxima as-signed to precession in the Castile series have sloping shoulders. It is the similar lag and recognizable power in the Castile spectrum at the SP period (Fig. 4a, d) that confirm the ancient evaporite’s location close to the equator, and possibly near the southern limit of the location rectangle in Fig. 1a. Importantly, as depicted in a con-25
CPD
6, 1421–1452, 2010Earth as diode
R. Y. Anderson
Title Page
Abstract Introduction
Conclusions References
Tables Figures
◭ ◮
◭ ◮
Back Close
Full Screen / Esc
Printer-friendly Version Interactive Discussion
Discussion
P
a
per
|
Dis
cussion
P
a
per
|
Discussion
P
a
per
|
Discussio
n
P
a
per
|
This clipping mechanism was a reaction to changes in insolation related to equinox. A second rectifying process is also recognized in which the maritime monsoon and the solstice cycle have an active role.
6.2 Clipping from solstice
Although a linear reaction to direct heating from insolation, as modulated by CP and SP, 5
and received over land explains the occurrence of secondary maxima (SP cycles) in
Tmax, seasonal features preserved within Castile varves identify still another, apparently far more efficacious clipping mechanism. In this process the maritime phase of the monsoon is an active, climatic rectifying agent. Because the response ofTmax to two types of clipping occurred at different seasons of the year (solstice and equinox) their 10
effect onTmaxas recorded by the varve series was complementary.
The key feature within a Castile varve that identifies the solstice cycle and the mon-soon as active rectifying agents is the thin, dark layer of calcium carbonate (Fig. 1e). When viewed through a petrographic microscope (Fig. 5c) the carbonate layer is seen to be an accumulation of small, brightly colored rhombic crystals of calcite, sandwiched 15
within a gray and black interlocking mosaic of crystalline anhydrite. Surface brine was continuously saturated with respect to calcium and bicarbonate so that calcite crystals precipitated from solution throughout the year (Kirkland, 2003) and the rhombs of cal-cite were “frozen in place” between layers of sulfate as crystals of calcal-cite and gypsum settled on the floor of the basin and gypsum later converted to anhydrite.
20
The sharp lower contact of calcite rhombs with the anhydrite mosaic (Fig. 5c) marks the onset of seasonal cooling, a lower rate of evaporation, reduced salinity, and a sea-sonal interruption or hiatus in the chemical precipitation of gypsum from surface brine. Salinity was seasonally lowered until the solubility product of Ca2+ and SO2−
4 was no longer exceeded, and chemical precipitation of gypsum was then terminated or greatly 25
CPD
6, 1421–1452, 2010Earth as diode
R. Y. Anderson
Title Page
Abstract Introduction
Conclusions References
Tables Figures
◭ ◮
◭ ◮
Back Close
Full Screen / Esc
Printer-friendly Version Interactive Discussion
Discussion
P
a
per
|
Dis
cussion
P
a
per
|
Discussion
P
a
per
|
Discussio
n
P
a
per
|
amount of entrained moisture in the onshore circulation must have been relatively mi-nor in order to assure accumulation of several hundred meters of pure evaporite, and absence of clastics implies no surface runoff. Webster’s (1987) description of a dry monsoon accompanied by a strong temperature inversion adjacent to a western coast may be appropriate for the maritime monsoon.
5
The sharpness of the lower contact of calcite rhombs with the sulfate layer coincides with sudden onset typical of a monsoonal circulation that probably persisted for 3 to 4 months of the year. The transitional upper contact of calcite rhombs and the anhydrite mosaic indicates a more gradual, halting departure of the monsoon season (Fig. 5c). These seasonal features within varves reflect their monsoon origin. In the absence 10
of a strong monsoon, as in the Dead Sea analog, Resnik et al. (2009) demonstrate that gypsum precipitates throughout the year, whereas the maritime monsoon on the western coast of Pangea had sufficient cooling to induce the sulfate hiatus.
The seasonal hiatus near the equator represents an entirely climatic (monsoonal) clipping process empowered during the solstice cycle. Monsoonal cooling literally 15
clipped the linear response to annual and semi-annual heating and cooling cycles in surface temperature (Tmax) over land. Monsoon cooling was an annual (solstice) event that was faithfully recorded in varve thickness (Tmax) by linear geochemical reactions. The cumulative effect of the seasonal hiatus, as depicted in a conceptual model (Fig. 5), was aTmax series with a generally “flat” lower bound or base (Tmaxl) and a highly vari-20
able and covariant upper bound (Tmaxu) as a result of a nonlinear seasonal cooling that ultimately resides in ocean’s large heat capacity.
A regional geographic and climatic context for monsoon clipping ofTmax(sulfate hia-tus) is provided by wind vectors in a coeval, Upper Permian general circulation model (GCM) for Pangea (Kutzbach and Ziegler, 1994; see supplement, S2.3) in which the 25
CPD
6, 1421–1452, 2010Earth as diode
R. Y. Anderson
Title Page
Abstract Introduction
Conclusions References
Tables Figures
◭ ◮
◭ ◮
Back Close
Full Screen / Esc
Printer-friendly Version Interactive Discussion
Discussion
P
a
per
|
Dis
cussion
P
a
per
|
Discussion
P
a
per
|
Discussio
n
P
a
per
|
onset of the maritime monsoon at the equator occurred near SS in the SH. During the remainder of the year, aridity near the equator, as evidenced by the Castile evaporite, was assured by hot, dry northeasterly winds from the continent’s northern interior, as is indicated in wind vectors in the GCM and confirmed by prevailing northeasterly winds as recorded in Pangean dune fields (Parish and Peterson, 1988; Loope et al., 2004) 5
(Fig. S3).
Supporting evidence for a nearly 9-month, hot-dry season is found in the recording of SP cycles as secondary maxima in the varve thickness series. Such maxima would not be present unless the sulfate layer, which accounts for most of varve thickness, included reactions related to equinox during an extended hot, dry season. The greater 10
response in seasonal overturn (anomalously thick varves) at the SP period (4.3), as opposed to almost no response in overturn at the CP period (Fig. S2d), probably re-flects the nearly linearTmax response to heating over land at equinox, which resulted in increased brine concentration in the surface brine layer subject to overturn. In con-trast, the reaction at the equator to precession-related cooling at solstice was a reduced 15
salinity that was unlikely to trigger overturn.
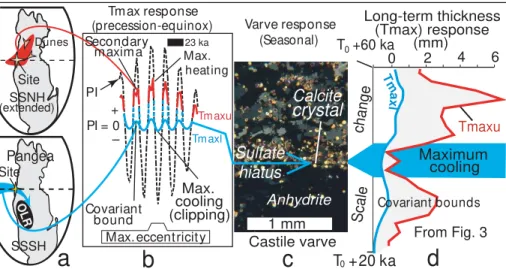
7 Conceptual model for monsoon enhancement of orbital forcing
Long-term effects of rectifying at solstices and equinox are summarized in a conceptual model that depicts relationships ofTmaxto insolation as defined by a Precessional Index (Fig. 5). Panel (a) (upper, red area) shows the region where hot-dry northeasterly 20
winds from the continents’ interior and aridity persisted for 8–9 months of the year. The blue arrow (Panel a, lower) depicts the trajectory of the maritime monsoon and cooling near SS in SH (see Fig. S3). Panel (b) shows the long-term relationship between insolation andTmax, as depicted by the PI and modulated by EC, CP, and SP.Tmaxu (red trace) depicts the linear heating reaction to precession-modulated insolation in the 25
CPD
6, 1421–1452, 2010Earth as diode
R. Y. Anderson
Title Page
Abstract Introduction
Conclusions References
Tables Figures
◭ ◮
◭ ◮
Back Close
Full Screen / Esc
Printer-friendly Version Interactive Discussion
Discussion
P
a
per
|
Dis
cussion
P
a
per
|
Discussion
P
a
per
|
Discussio
n
P
a
per
|
The response to cooling (clipping) in Panel (b) is traced in Panel (c) to the sulfate hiatus in a varve, and is the “heart of the evidence” of how the monsoon functioned as a rectifying agent at solstice. The blue line traces the hiatus during a single season to Panel (d) where the summed effect of hiatuses was recorded as CP and SP cycles in a 40 ka-segment of the Castile series (Fig. 3).
5
Although primary and secondary maxima (dual peaks) reflect heating over land at mid-northern latitudes (precession) and at the equator (equinox), the varves them-selves, from the seasonal seasonal hiatus required for their expression, suggest that theTmaxu response and the 4/1 ratio between bounds in varve thickness (Fig. 3) was shaped largely by monsoon cooling, and depicted as being applied from the top of 10
the PI envelope (Fig. 5, dashed Tmax). Although the efficacy of the solstice rectifying mechanism depended on a balance between a linear heating and nonlinear cooling response over land, conditions that determined that balance were largely determined by the physical geography of Pangea.
8 Rectifying function of continental asymmetry
15
Pangea at −255 ma had a landmass in the SH that was about double the land area
in the NH. This large difference about the equator produced an exceptionally strong monsoonal circulation in which equatorial westerlies came ashore along a nearly north-south western margin of the supercontinent. Thus, Pangean geography was a determining factor in the climate system’s efficacy as a monsoonal rectifier of orbit-20
modulated insolation. In this regard, the diode analogy applied to the rectified EBM result by Short et al. (1991) can be extended to include the maritime monsoon as an active, climatic rectifying agent, and further suggests that continental asymmetry, rel-ative to the equator, performed a function similar to that of a semi-conductor (of heat flow).
25
CPD
6, 1421–1452, 2010Earth as diode
R. Y. Anderson
Title Page
Abstract Introduction
Conclusions References
Tables Figures
◭ ◮
◭ ◮
Back Close
Full Screen / Esc
Printer-friendly Version Interactive Discussion
Discussion
P
a
per
|
Dis
cussion
P
a
per
|
Discussion
P
a
per
|
Discussio
n
P
a
per
|
suggests that the monsoonal rectifying mechanism was effective over a wide region of tropical Pangea. Although the high, 4/1 ratio in upper and lower bounds of Pangean EBMTmaxis reduced to less than half for the present distribution of continents (Crowley, 1992), a degree of rectification is implied. This suggests that the monsoon as a clipping agent and amplifier ofTmax is inherent in the geography that produces the monsoon, 5
a hypothesis that would seem to merit further testing. Efficacy as a rectifier would be determined by the size and positioning of continents relative to the equator and the Castile example suggests that of the two rectifying mechanisms, the solstice process is the greater contributor, at least for Western Pangea. Further study will be needed to determine relative contributions for different configurations of continents.
10
One place to look for confirmation of a geographic contribution to rectified forcing is in the Pleistocene dust record of Africa, for which the distribution of land relative to the equator, on a smaller scale, is essentially the opposite to that of the Late Permian Pangean continent. Also the western African monsoon is at least partly analogous to the maritime monsoon envisioned for the western Pangean equator. Upon compar-15
ing the African dust record (Melosiraseries of Pokras and Mix, 1987) with the EBM-generatedTmaxseries for Pangea one finds secondary (SP) maxima as lagged peaks and shoulders in CP cycles, but the lag and shoulders are reversed in the African record relative to the EBM series (compare Fig. 4c and e). The reversal cannot be attributed to a different orbital configuration because the Pangean EBM experiment employed Late 20
Pleistocene-Holocene insolation values (Crowley et al., 1992), so that the reversal in lag may be a result of the monsoon reacting to Africa’s opposite geography about the equator.
The African Melosira series has other features in common with both Castile and EBM-generated Tmax series, particularly a systematic ∼100 ka amplitude modulation
25
of CP cycles (Fig. 4c, e). Pokras and Mix (1987) and Ruddiman (1997) attributed the
∼100 ka cycle and harmonics of CP in theMelosiraseries to seasonal thresholding in
CPD
6, 1421–1452, 2010Earth as diode
R. Y. Anderson
Title Page
Abstract Introduction
Conclusions References
Tables Figures
◭ ◮
◭ ◮
Back Close
Full Screen / Esc
Printer-friendly Version Interactive Discussion
Discussion
P
a
per
|
Dis
cussion
P
a
per
|
Discussion
P
a
per
|
Discussio
n
P
a
per
|
sharper maxima of CP-SP cycles in the dust record (Fig. 4c–e). In the light of Castile-EBM evidence for a purely climatic clipping process, the rectified response to forcing recorded in the African series may have been largely climatic and supplemented by mechanical geological processes (e.g. shear thresholds in dust transport) that sharp-ened maxima in CP-SP cycles.
5
9 QBMO: monsoon enhancement of sub-Milankovitch forcing
Multiple spectral methods used to estimate the period of the quasi-bi-millennial climate oscillation (QBMO) assign a period of 2.3 ka to the prominent stratigraphic cycles in the Castile Formation (Fig. 1d, spectrum not illustrated). Although the source of the QBMO is unknown, the cycles display enough regularity to suspect external forcing. 10
Curiously, the QBMO falls within the range of Late Pleistocene Dansgaard-Oeschger (DO) climate events, which commonly are attributed to Atlantic thermohaline circulation (THC, Broecker, 1991). Thus, ∼100 ka cycles and DO events, as the two strongest
and most poorly understood manifestations of cyclic Pleistocene glacial climate, also were prominent in the Late Permian monsoon. Although THC and feedback may be 15
a preferred explanation for a Pleistocene QBMO, vigorous THC is unlikely in a sluggish Late Permian ocean (Wignall and Twitchett, 2002; Winguth et al., 2002). There is some evidence, however, that Pleistocene-Holocene DO-type QBMO events may reflect solar forcing (e.g., Dima and Lohmann, 2009; Braun et al., 2005; Higginson et al., 2004; Bond et al., 2001; Stuiver et al., 1993).
20
Whatever the source of the QBMO, it need not be known to recognize that an in-dependent forcing at a higher-than-Milankovitch frequency, whether externally or inter-nally forced, also will be enhanced in the rectified response of a tropical monsoonal climate system. A possible example is orbital modulation of the strength of El Ni ˜no, as reported in a tropical climate modeling experiment by Clement et al. (1999). Some of 25
CPD
6, 1421–1452, 2010Earth as diode
R. Y. Anderson
Title Page
Abstract Introduction
Conclusions References
Tables Figures
◭ ◮
◭ ◮
Back Close
Full Screen / Esc
Printer-friendly Version Interactive Discussion
Discussion
P
a
per
|
Dis
cussion
P
a
per
|
Discussion
P
a
per
|
Discussio
n
P
a
per
|
10 Pleistocene-monsoon association and other considerations
Although the rectifying effect in EBM experiments is relatively weak for Pleistocene (present) geography, a question naturally arises about possible connections between enhanced∼100 ka cycles in tropical surface temperature (Tmax) and glaciations at high latitudes. Aside from noting that latitudinal thermal gradients and transport of tropical 5
moisture (Raymo and Nisancioglu, 2003) would be augmented by a climatically recti-fied orbital forcing at a low latitude, an association with Pleistocene glaciation is outside the objective here; but it is interesting that northward propagation of equatorial SP cy-cles appear to mark the onset of∼100 ka glacial-interglacial climate cycles (Rutherford and D’Hondt, 2000). In the Holocene, global changes in sea-surface temperature have 10
been linked to orbit-regulated seasonal differences in insolation at low latitudes (Lorenz et al., 2006), a finding that is consistent with an enhanced response in the tropics to orbital forcing, possibly as implemented by the monsoon.
A solar association for the QBMO in the Castile series is under investigation, and if both the Permian QBMO and Pleistocene DO-type events eventually are shown to 15
share a solar association, then the antiquity of the Castile example would imply an exceptionally stable solar dynamo, and then sensitivity to solar forcing other than by direct visible solar radiation (insolation), such as UV radiation or solar-magnetic or geomagnetic modulation of cosmic ray flux, cannot be ruled out as being enhanced in the tropical climate system.
20
Owing to the rarity of Castile-type climate records it may be some time before evi-dence and interpretation offered here can be confirmed by other geological examples. However, because climate variables related to the monsoon have strong geographic expression, the monsoon’s potential to enhance effects of forcing in the tropical band can be explored through geographical GCM experiments.
25
Supplementary material related to this article is available online at:
CPD
6, 1421–1452, 2010Earth as diode
R. Y. Anderson
Title Page
Abstract Introduction
Conclusions References
Tables Figures
◭ ◮
◭ ◮
Back Close
Full Screen / Esc
Printer-friendly Version Interactive Discussion
Discussion
P
a
per
|
Dis
cussion
P
a
per
|
Discussion
P
a
per
|
Discussio
n
P
a
per
|
Acknowledgement. Essential to this study are contributions of Walter E. Dean, Douglas W. Kirkland, and Mardene Bell. Kirsten Menking assisted in review and editing. The Castile project was sponsored by the National Science Foundation.
References
Anati, D. A.: The hydrography of a hypersaline lake, in: The Dead Sea: The Lake and its
5
Setting, edited by: Niemi, T. M., Ben-Avraham, Z., and Gat, Z. R., Oxford Monograph on Geology and Geophysics, 89–103, 1997.
Ashkenazy, Y. and Gildor, H.: Timing and significance of maximum and minimum equatorial insolation, Paleoceanography, 23, PA1206, doi:10.1029/2007PA001436, 2008.
Anderson, R. Y.: A long geoclimatic record from the Permian, J. Geophys. Res., 87, 7285–7294,
10
1982.
Berger, A. and Loutre, M. F.: Pre-Quaternary Milankovitch frequencies, Nature, 342, 133–134, 1989.
Berger, A., Loutre, M. F., and M ´elice, J. L.: Equatorial insolation: from precession harmonics to eccentricity frequencies, Clim. Past, 2, 131–136, doi:10.5194/cp-2-131-2006, 2006.
15
Bond, G. C., Devlin, W. J., Kominz, M. A., Beavan, J., and McManus, J.: Evidence of astro-nomical forcing of Earth’s climate in Cretaceous and Cambrian times, Tectonophysics, 222, 295–315, 1993.
Bond, G. C., Kromer, B., Beer, J., Muscheler, R., Evans, M. N., Showers, W., Hoffmann, S., Lotti-Bond, R., Hajdas, I., and Bonani, G.: Persistent solar influence on North Atlantic Climate
20
during the Holocene, Science, 294, 2130–2136, 2001.
Braconnot, P., Marzin, C., Gr ´egoire, L., Mosquet, E., and Marti, O.: Monsoon response to changes in Earth’s orbital parameters: comparisons between simulations of the Eemian and of the Holocene, Clim. Past, 4, 281–294, doi:10.5194/cp-4-281-2008, 2008.
Braun, H., Christi, M., Rahmstorf, S., Ganapolski, A., Mangini, A., Kubatzki, C., Roth, K., and
25
Kromer, B.: Possible solar origin of the 1470-year glacial climate cycle demonstrated in a coupled model, Science, 438, 208–211, 2005.
Broecker, W. S.: The great conveyor, Oceanography, 4, 79–84, 1991.
Clement, A. C., Seager, R., and Cane, M. A.: Orbital controls on the El Ni ˜no/Southern Oscilla-tion and the tropical climate, Paleoceanography, 14(4), 441–456, 1999.
CPD
6, 1421–1452, 2010Earth as diode
R. Y. Anderson
Title Page
Abstract Introduction
Conclusions References
Tables Figures
◭ ◮
◭ ◮
Back Close
Full Screen / Esc
Printer-friendly Version Interactive Discussion
Discussion
P
a
per
|
Dis
cussion
P
a
per
|
Discussion
P
a
per
|
Discussio
n
P
a
per
|
Croll, J.: On the physical cause of the change of climate during geological epochs, Phil. Mag., 33, 426–445, 1864.
Crowley, T. J., Kyrwang-Yul, K., Mengel, J. G., and Short, D. A.: Modeling 100 000-year climate fluctuations in Pre-Pleistocene time series, Science, 225, 705–707, 1992.
Dima, M. and Lohmann, G.: Conceptual model for millennial climate variability: a possible
5
combined solar-thermohaline circulation origin for the∼1500-year cycle, Clim. Dynam., 32, 301–311, 2009.
Dettinger, M. D., Ghil, M., Strong, C. M., Weibel, W., and Yiou, P.: Software expedites singular-spectrum analysis of noisy time series, Eos Trans. AGU, 76(12), 20–21, 1995.
Gertman, I., Anati, D. A., Hecht, A., Bishop, J., and Tsehtik, Y.: The Dead Sea hydrography
10
from 1992 to 1999, available online at: http://isramar.ocean.org.il/DeadSea/DS Database. asp, access: 15 June 2009.
Hagelberg, T. K., Bond, G., and de Menocal, P.: Milankovitch band forcing of sub-Milankovitch climate variability during the Pleistocene, Paleoceanography, 9, 545–548, 1994.
Herbert, T. D.: A long marine history of carbon cycle modulation by orbital-climatic changes,
15
Proc. Natl. Acad. Sci., 94, 8362–8369, 1997.
Herbert, T. D. and Fischer, A. G.: Milankovitch climatic orgin of mid-Cretaceous black shale rhythms in central Italy, Nature, 321, 739–743, 1986.
Higginson, M. J., Altabet, M. A., Wineze, L., Herbert, M. A., and Murray, D. W.: A solar (irradi-ance) trigger for millennial-scale abrupt changes in the Southwest monsoon?,
Paleoceanog-20
raphy, 19, PA 3015, 2004.
Huybers, P. and Wunsch, C.: Rectification and precession signals in the climate system, Geo-phys. Res. Lett., 30(19), CLM 3-1–3-4, 2003.
Huybers, P. and Wunsch, C.: Obliquity pacing of late Pleistocene glacial terminations, Nature, 434, 491–494, 2005.
25
Kirkland, D. W.: An explanation of the varves of the Castile evaporites (Upper Permian), Texas and New Mexico, USA, Sedimentology, 50, 899–920, 2003.
Kutzbach, J. E.: Monsoon climate of the early Holocene: climate experiment with the Earth’s orbital parameters of 9000 years ago, Science, 214, 59–61, 1981.
Kutzbach, J. E. and Guetter, P. J.: The influence of changing orbital parameters and surface
30
CPD
6, 1421–1452, 2010Earth as diode
R. Y. Anderson
Title Page
Abstract Introduction
Conclusions References
Tables Figures
◭ ◮
◭ ◮
Back Close
Full Screen / Esc
Printer-friendly Version Interactive Discussion
Discussion
P
a
per
|
Dis
cussion
P
a
per
|
Discussion
P
a
per
|
Discussio
n
P
a
per
|
Kutzbach, J. E. and Ziegler, A. M.: Simulation of Late Permian climate and biomes with an atmospheric-ocean model: comparisons with observations, in: Paleoclimates and their Mod-eling: with Special Reference to the Mesozoic Era, edited by: Allen, J. R. L., Hoskins, G. J., Sellwood, B. W., Spicer, R. A., and Valdes, P. J., Chapman and Hall, London, 119–132, 1994.
5
Loope, D. B., Steiner, M. B., Rowe, C. M., and Lancaster, N.: Tropical westerlies over Pangaean sand seas, Sedimentology, 51, 315–322, 2004.
Lorenz, S. J., Kim, J.-H., Rimbu, N., Schneider, R. R., and Lohmann, G.: Orbitally driven insolation forcing on Holocene climate trends: evidence from alkenone data and climate modeling, Paleoceanography, 21, PA 1002, 2006.
10
McIntyre, A. and Molfino, B.: Forcing of Atlantic Equatorial and Subpolar millennial cycles by precession, Science, 274, 1867–1870, 1996.
Oglesby, R. and Park, J.: The effect of precessional insolation changes on Cretaceous climate and cyclic sedimentation, J. Geophys. Res., 94, D12, 14793–14816, 1989.
Olsen, P. V. and Kent, D. V.: Milankovitch climate forcing in the tropics of Pangaea during the
15
late Triassic, Paleogeogr. Paleocl., 122, 1–26, 1996.
Paillard, D., Labeyrie, L., and Yiou, P.: Macintosh program performs time-series analysis, Eos Trans. AGU, 77, 379, 1996.
Parish, J. T. and Peterson, F.: Wind directions predicted from global circulation models and wind directions determined from aeolian sanstones of the Western United States, Sediment.
20
Geol., 56, 261–282, 1988.
Park, J., D’Hondt, S. L., King, J. W., and Gibson, C.: Late Cretaceous precession cycles in double time: A warm-Earth Milankovitch response, Science, 261, 1431–1434, 1993.
Pestiaux, P., Duplessey, J. C., and Berger, A.: Paleoclimatic variability at frequencies ranging from 10-4 cycles per year to 10-3 cycles per year – evidence for non-linear behavior of the
cli-25
mate system, in: Climate History m Periodicity, and Predictability, edited by: Rampino, M. R., Sanders, J. E., Newman, W. S., and Kunigsson, L. K., Van Nostrand Reinhold Co., New York, 285–299, 1987.
Pokras, E. M. and Mix, A. C.: Eolian evidence for spatial variability of late Pleistocene climates in tropical Africa, Quaternary Res., 24, 137–149, 1985.
30
CPD
6, 1421–1452, 2010Earth as diode
R. Y. Anderson
Title Page
Abstract Introduction
Conclusions References
Tables Figures
◭ ◮
◭ ◮
Back Close
Full Screen / Esc
Printer-friendly Version Interactive Discussion
Discussion
P
a
per
|
Dis
cussion
P
a
per
|
Discussion
P
a
per
|
Discussio
n
P
a
per
|
Prisciandaro, M., Lancia, A., and Musmarra, D.: Gypsum nucleation into sodium chloride solu-tions, AIChE J., 47(4), 929–934, 2001.
Roe, G. and Allen, M.: A comparison of competing explanations for the 100 000-yr ice age cycle, Geophys. Res. Lett., 26, 2259–2262, 1999.
Raymo, M. E. and Nisancioglu, K.: The 41 kyr world: Milankovitch’s other unsolved mystery,
5
Paleoceanography, 18(1), 1011, 11-1–11-6, 2003.
Reznik, I. J., Gavrieli, I., and Ganor, J.: Kinetics of gypsum nucleation and crystal growth from Dead Sea brine, Geochim. Cosmochim. Ac., 73, 6218–6230, 2009.
Ruddiman, W. F.: Tropical Atlantic terrigenous fluxes since 25 000 years BP, Mar. Geol., 136, 189–207, 1997.
10
Ruddiman, W. F.: Earth’s Climate: Past and Future, W. H. Freeman, New York, 495 p., 2001; 388 p., 2008.
Rutherford, S. and D’Hondt, S.: Early onset of tropical forcing of 100 000-year Pleistocene glacial cycles, Nature, 408(6808), 72–75, 2000.
Scotese, C. R.: Paleomap Project, available online at: http://www.scotese.com/earth.htm,
ac-15
cess: 23 June 2010.
Short, D. A., Mengel, J. G., Crowley, T. J., Hyde, W. T., and North, G. R.: Filtering of Milankovitch cycles by Earth’s geography, Quaternary Res., 35, 157–173, 1991.
Stuiver, M., Braziunas, T. F., Grootes, P. M., and Zelinski, G. A.: Is there evidence of solar forcing of climate in the GISP2 oxygen isotope record?, Quaternary Res., 48, 259–266, 1997.
20
Torrence, C. and Compo, G. P.: A practical guide to wavelet analysis, B. Am. Meteorol. Soc., 79, 61–78, 1998.
Webster, P. J.: The elementary monsoon, in: Monsoons, edited by: Fein, J. S. and
Stephens, P. L., John Wiley & Sons, New York, 3–32, 1987.
Wignall, P. B. and Twitchett, R. J.: Oceanic anoxia and the end Permian mass extinction,
Sci-25
ence, 272(5265), 1155–1158, 1996.
Wigley, T. M. L.: Spectral analysis and the astronomical theory of climate change, Nature, 264, 629–631, 1976.
Winguth, A. M. E., Heinze, C., Kutzbach, J. E., Maier-Reimer, E., Mikolajewicz, U., Rowley, D., Rees, A., and Ziegler, A. M.: Simulated warm polar currents during the middle Permian,
30
CPD
6, 1421–1452, 2010Earth as diode
R. Y. Anderson
Title Page
Abstract Introduction
Conclusions References
Tables Figures
◭ ◮
◭ ◮
Back Close
Full Screen / Esc
Printer-friendly Version Interactive Discussion
Discussion
P
a
per
|
Dis
cussion
P
a
per
|
Discussion
P
a
per
|
Discussio
n
P
a
per
|
Halite-Overturn
Calcite-laminated Anhydrite
Laminated layers sulfate
limestone
QBMO Saliinity cycle
d
e
Antarctica India South
America Africa PANGEA
GONDWANA
South
Africa
Equator
Mou
ntain
s
~30 N
~30 S 0
0
a
Paleoequator
North America
Castile Evaporite
Latitude Range Basin
Basin
236 237 238 239
Months
(Kg/m )
3
r = 0.992
34 22
Temperature 26 30 18
Salinity
C
0 N.M.
b
c
255 Ma
10 mm
1 m
Evaporite Basin Castile
Fig. 1. Location, petrologic cycles, and varves of Castile Fm. (a) Map of Pangea in Late