pg. 1
HEALTHCARE-ASSOCIATED INFECTIONS:
AN ANALYSIS OF COSTS IN A PORTUGUESE HOSPITAL
A thesis submitted to NOVASBE in partial fulfillment of the requirements for the degree of
Master of Economics
by
Helena Sofia Nunes Fernandes
Under the supervision of
Professor Pedro Pita Barros
&
Dr. Margarida Borges
NOVA SCHOOL OF BUSINESS AND ECONOMICS
Lisbon, Portugal
pg. 2
I.
ABSTRACT
Hospital-acquired infections (HAIs) delay healing, prolong Hospital stay, and increase both Hospital costs and risk of death. This study aims to estimate the extra length of stay and mortality rate attributable to each of the following HAIs: wound infection (WI); bloodstream infection (BSI); urinary infections (UI); and Hospital-acquired pneumonia (HAP). The study population consisted of patients discharged in CHLC in 2014.
pg. 3
II.
INTRODUCTION
Healthcare-associated infections (HAIs) - or nosocomial infections - affect patients in a healthcare facility, but were not present nor incubating at the time of admission.1
Nowadays, Portugal presents one of the worst rates in Europe with regard to Hospital-acquired infections (10.8%). Still there is a lack of Portuguese literature addressing its socioeconomic costs. This study aims to help filling this gap, contributing with the additional mortality rate and length of stay attributable to the four most relevant nosocomial infections, with data from a major Portuguese Hospital. By attesting the existence and magnitude of such consequences, an important step is taken in order to help definition and adoption of best prevention campaigns and/or alternative payment systems.
In the beginning of 2015, the Gulbenkian Foundation and the Ministry of Health launched the
plan “STOP Hospital Infection!”, contemplating twelve Portuguese Hospitals. It aims not only
to improve the database of various nosocomial infections, but also to reduce its prevalence rate.2 Bearing this is mind, the present study has the purpose of being complementary to STOP project, by providing information with regards to the extra mortality rate and length of stay associated to the same group of infections, in one of these twelve Hospitals, the Centro Hospitalar de Lisboa Central (CHLC). Namely, the nosocomial infections at study are: wound infections after hip, knee and colorectal surgeries; bloodstream infections; urinary infections, and pneumonias. In recent years, health authorities have done efforts to introduce active surveillance programs and infection control strategies in order to reduce HAIs incidence. Still, they continue to be associated with greater medical costs, longer length of stay, and an increase in mortality rates. In the USA, around 99 000 deaths and €6.5 billion are attributed to HAI annually. In Europe, these infections annually cause 37 000 deaths, 16 million extra days of length of stay, and €7 billion of costs. Specifically, in a recent study performed in four European countries, additional
1 WHO (2011)
pg. 4 length of stay varied between 4 and 14 days and associated costs ranged from €4200 to €13 030 per Central-Line Associated Bloodstream Infection (CLABSI) episode.3
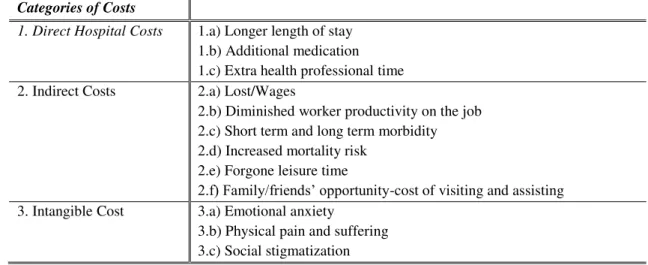
In Table 1 are presented the direct, indirect and intangible type of costs attributable to nosocomial infections.4 They not only represent a serious risk because they are associated with increased morbidity and mortality of patients, extension of their length of stay and potential disability; but they also have a high financial impact on institutions and National Health System (NHS).
Table 1: The Social Costs of Healthcare-Associated Infections
Categories of Costs
1. Direct Hospital Costs
1.a) Longer length of stay 1.b) Additional medication 1.c) Extra health professional time 2. Indirect Costs 2.a) Lost/Wages
2.b) Diminished worker productivity on the job 2.c) Short term and long term morbidity 2.d) Increased mortality risk
2.e) Forgone leisure time
2.f) Family/friends’ opportunity-cost of visiting and assisting 3. Intangible Cost 3.a) Emotional anxiety
3.b) Physical pain and suffering 3.c) Social stigmatization Source: Haddix et al. (1996)
Although there are several socioeconomic costs caused by these infections, this analysis is limited to the study of just two: prolonged Hospital stay and increased mortality rate (points
1.a. and 2.d in Table 1, respectively).
Graph 1 shows the distribution of length of stay with and without nosocomial infection, while
Graph 2 presents the number of deaths related to patients with infections associated to invasive devices. However, the analysis of these mortality rates does not directly associate the deaths to the presence of infection, as well as the difference between the length of stays cannot be directly associated with the presence of infection.5 It is necessary to compare results of infected and not
infected assuming similar groups of patients.
pg. 5
Graph 1: Length of stay with and without infection
Source: DGS (2014)
Graph 2: Deaths associated to invasive devices-associated infections
Deaths
16.7% 20.6% 37.9% 31.8%
Source: DGS (2014)
In the Hospital under analysis patients that went through a hip or knee surgery, wound infections result in an extra average length of stay of 74.97 days, and the expected difference of mortality rate is 27.27%; for patients that undertook a colorectal surgery, wound infections increases mortality rate by 10.69% and length of stay by 20.23 days. Bloodstream infections increase Hospital stay by 28.80 days and mortality rate by 32.27%. Urinary infections cause an average additional length of stay of 19.66 days and risk of death of 12.85%. Finally, Hospital-acquired pneumonia result in an extra Hospital stay of 25.06 days and a mortality rate of 24.71%. The present study confirms the additional length of stay (and thus more intensive use of resources) and mortality rate caused by nosocomial infections. Future research should assess the cost-effectiveness of these preventions campaigns.
This study starts presenting a review of literature with the motivation for the theme and key findings of other authors (part II); in part III the materials and methods will be presented and results will be illustrated in part IV; the discussion takes place in part V followed by conclusions (part VI).
7,1
36,3 W i t h o u t I n f e c t i o n
W i t h I n f e c t i o n Days
516 402
11367
400
86 83
4310
127 0
2000 4000 6000 8000 10000 12000
Catheter-Associated Urinary Infection
Urostomy-Associated Urinary Infection
Central Line-Associated Bloodstream Infection
pg. 6
III.
REVIEW OF LITERATURE
The nosocomial infections with the highest repercussion on healthcare system, that is, the most frequent, expensive and avoidable are related with the devices used in health procedures, such as catheters or ventilators, or may also occur at surgery sites. These healthcare-associated infections include Central Line-Associated Bloodstream Infections (CLABSIs), Catheter-Associated Urinary Tract Infections (CAUTIs), Ventilator-Catheter-Associated Pneumonia (VAP), and Surgical Site Infections (SSIs). USA literature have shown that surgical site infection accounts for the largest share of the cost (33.7%), closely followed by ventilator-associated pneumonia (31.6%) and by sepsis (18.9%).6 Their prevalence rate in Portugal, Europe and USA are
summarized in the following table:
Table 2: Prevalence rate of nosocomial infections by group
CLABSIs CAUTIs VAP SSIs Others All HAIs
Portugal 0.86% 2.48% 3.13% 1.73% 2.59% 10.8% Europe 0.61% 1.08% 1.34% 1.12% 1.55% 5.7% USA 0.40% 0.52% 0.87% 0.87% 1.34% 4%
Source: ECDC (2013)
Current nosocomial control was founded with the pioneer work of Ignaz Semmelweis, a Hungarian physician who in 1847 revealed the importance of hand hygiene for controlling transmission of infections in Hospitals.7 However, infection control efforts were only
recognized as a major subject in the 20th Century.
Regarding the USA, literature on healthcare-associated infections preventability includes three key studies. Haley et al. (1980) was the first accurate scientific evaluation of the performance of infection control that distinguished results in Hospitals with and without infection control programs. The results showed that Hospitals with an effective Hospital epidemiologist, one infection control practitioner for every 250 beds, active surveillance mechanisms, and ongoing control efforts reduced nosocomial infection rates by 32%. Secondly, Institute of Medicine
pg. 7 (1999) revealed that between 44,000 and 98,000 patients in USA Hospitals died each year due to preventable medical errors with an estimated additional cost of between $17 billion and $29 billion per year. Thirdly, Pronovost et al. (2006) raised public interest in nosocomial infections to a new level. The analysis included the collaboration of 103 intensive-care units in Michigan to reduce CLABSIs by implementing a set of interventions. According to the results, infections were reduced by roughly 62%.8
Table 3: Literature results for extra mortality rate and length of stay associated to nosocomial infections
HAI Surgery Country Study
Attributable Mortality Rate Extra LOS Bloodstream Infection
- Taiwan Liu et al. (2002) 26.3% 14 - Argentina Rosenthal et al. (2003) 25% 12 - USA Warren et al. (2006) 23% 34 - Canada Laupland et al. (2006) 16% 13.5 - Morocco Madani et al. (2009) 75.1% 5.5 - Brazil Primo et al. (2012) 45.2% 32.1 - Portugal Fiorentino (2013) 13.4% 22.5 - USA Kaye et al. (2014) 16.2% 10 Urinary
Infection
- Argentina Rosenthal et al. (2003) 5% 5 - Morocco Madani et al. (2009) 18.7% 8.6 Pneumonia - France Bercault & Boulain (2001) 27% 5
- Argentina Rosenthal et al. (2003) 35% 10 - Morocco Madani et al. (2009) 56.7% 3.9 Surgical Site
Infection
CABG USA Hollenbeak et al. (2000) 21.4% 20 Orthopedic USA Whitehouse et al. (2002) NS 14 OLT USA Hollenbeak et al. (2003) NS 21 CABG Turkey Coskun et al. (2005) 14.7% 35 Hip Replace. Spain Jodra et al. (2006) - 32.5
Abdominal Japan Kusachi et al. (2012) - 17.6 Cardiac Japan Kusachi et al. (2012) - 48.9 Caesarean S. Tanzania Mpogoro et al. (2014) - 12.7 VREI - USA Song et al. (2003) 30.3% 17 LRTI - USA Leistner et al. (2013) - 9
Hospital-Acquired Bacteremia
- Belgium Pirson et al. (2005) 32.2% 21.1 - India Kothari et al. (2009) 54% 22.9 - Belgium Vrijens et al. (2012) 2.8% 7.3 All - USA Roberts et al. (2010) 6.1% 7.8
VREI: Vancomycin Resistant Enterococcus Infection; CS: Caesarean Section; CABG: Coronary Artery Bypass Grafting; OLT: Orthotopic Liver Transplantation
In Europe, the awareness and devoted research for the problem of patient safety only began to gain prominence in recent years. An important starter to call the attention for this global health-care issue was the patient safety program launched in 2004 by the World Health Organization
pg. 8 (WHO). This program’s first challenge was Clean Care is Safer Care launched in 2005, targeting the important aspect of reducing nosocomial infections. The main objectives of Clean Care is Safer Care included the promotion of best hand hygiene practices globally, at all levels of health care, as a first step in ensuring high standards of infection control and patient safety.9 Overall, several were the studies reporting the additional socioeconomic costs associated with nosocomial infections. In Table 3 are highlighted various studies from 21st century referring to different countries, which, like the present study, were meant to determine the additional mortality rate and/or length of stay attributable to nosocomial infections. Despite confirming the existence of these extra costs, from Table 3, it is possible to determinate that values vary widely among studies.
The most favorable examples of interventions in order to mitigate thus problem came from England, Scotland and some States from USA, whose programs achieved reductions up to 85% in a short period of time. In Portugal, although some initiatives have been launched, it still has not been produced these success percentage rates.10 Namely, in 2009, Direcção Geral da Saúde (DGS) begun a Hands Hygiene Campaign whose adherence by healthcare provider has been increasing (Graph 3).
Graph 3: Adherence rate to hands hygiene by professional group
Source: DGS (2014)
Despite the progress of various indicators, nosocomial infections remain, however, as a major public health problem, and this encouraged both Gulbenkian Foundation and Health Ministry
9 WHO (2005)
10 Fundação Calouste Gulbenkian (2015)
30% 50% 70%
2009 Pre-Campaign
2009 Post-Campaign
2010 2011 2012
Nurse/Midwife
pg. 9 to reduce infections acquired in 12 Hospitals – decrease incidence rate by 50% in a 3-years period – and hence improve patient safety in Portugal. Accordingly, the present study analysis healthcare-associated infections in one of these twelve Hospitals.
In alignment with the existing literature, this study uses a matched case-control design, in order to determine whether there are differences in the mortality rate and length of stay between episodes/patients with and without Hospital-acquired infection, assuming similar control and case groups. Finally, toward the assessment of differences between groups regarding the matching criteria, it is applied the Wilcoxon signed-rank test for continuous variables, the
McNemar’s test for binary variables, and the Marginal homogeneity test for variables with more
than two categories.1112
IV.
MATERIALS AND METHODS
IV.1 Data Collection
The database used for this analysis includes 80 107 patient admissions with discharge date in 2014 from the Centro Hospitalar de Lisboa Central (CHLC). This data includes information
such as patient’s age, sex, dates and types of admission and discharge, diagnoses, and
procedures codes. The authorization to access and treat this data was approved by the Ethics Commission on the 20th of July, 2015.
IV.2 Study Design
This study is composed by five separate analyzes of outcomes for the following nosocomial infections: wound infections after hip and knee operations; wound infections due to colorectal surgery; bloodstream infections; urinary infections; and pneumonias.
Many wound infections are not detected until after the discharge, hence for the two analyzes regarding this type of nosocomial infection, the present study was designed to include data
pg. 10 related to readmissions in CHLC. For each one, eligible population included patients with at least one Hospitalization that involved a relevant operation. Hence, patients were identified through procedural codes for hip and knee operations and for colorectal surgery (see Appendix
4 for more details). Consequently, the first analysis ended with 783 patients and the second with 672.
In particular, for each patient, his first admission involving hip and knee operations or a colorectal surgery, depending on the analysis in question, was called as the index Hospitalization. The period post-discharge of index Hospitalization for each patient was defined as the post-index period, which ends with the database and may include readmissions. For each of the remaining analyzes, the eligible population comprised all episodes (patient admissions) with discharge in 2014, which accounted 80 107.
Subsequently, in order to identify cases of nosocomial infections, the selected observations were examined through a combination of ICD9-CM codes (see Appendix 5 for more details). Thus, eligible population were divided into two groups: uninfected (controls), and infected subjects. Both primary and secondary diagnosis codes were used to assign subjects into groups. It should be recalled that in the two analyzes relative to wound infections, the assignment considers index and post-index Hospitalizations.
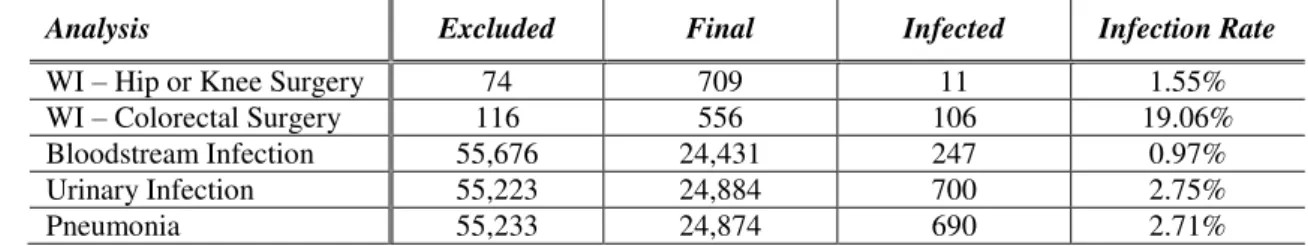
pg. 11 these restrictions, the finalized database, the number of observations presenting the infection at question, and the corresponding infection rate.
Table 4: Evolution of database by applying exclusion criteria
Analysis Excluded Final Infected Infection Rate
WI – Hip or Knee Surgery 74 709 11 1.55% WI – Colorectal Surgery 116 556 106 19.06% Bloodstream Infection 55,676 24,431 247 0.97% Urinary Infection 55,223 24,884 700 2.75%
Pneumonia 55,233 24,874 690 2.71%
WI: Wound Infection
IV.3 Study Variables
Appendix 2 presents database variables. Each observation is related to two essential codes: the episode number (NUM_EPISODIO) which is a particular identification; and the patient number
(PATNO) which appears each time the patient is admitted to the Hospital. The patient’s demographic variables comprised age (AGE) and sex (SEX). Clinical variables included: dates and types of admission and discharge (DATA_ADMISSAO; ADM_TIP; SAIDLAST; DSP), primary and secondary diagnosis (DDX1;…;DDX50), procedures performed (SRG1;…;SRG50), and Main Diagnostic Category (MDC).
Using existing variables, new ones were created to better fit the analysis. Firstly, the patient number (PATNO) allowed to account the number of times each patient was admitted to the Hospital (nr_adm). In addition, employing the diagnosis codes (see Appendix 5 for more details) allowed the production of a dummy variable for occurrence of each nosocomial infection
pg. 12 Hospitalization. Also the number of diagnoses in each Hospitalization (except those related to wound infection) and the number of procedures was calculated (N_DIAG; N_PROC).
The two analyzes related to wound infections imply some specificities, using the procedures patients undertook (SRG1; …; SRG50), it was created a dummy variable for the relevant surgery:
dummy_CS and dummy_OS to identify patients that undertook a colorectal surgery and a knee or hip replacement, respectively. Then, a variable was designed to recognize the index Hospitalizations, i.e. the first admission including the surgery at study for each patient. This component is important to get a sense of the percentage of wound infections diagnosed after discharge from the index Hospitalization. Since the follow-up period starts on the date of index admission and ends with the final date in the database, it was necessary to control the difference in extent of the follow-up periods between patients. Accordingly, through DATA_ADMISSAO
it was made a variable referring to the week of index Hospitalization admission (week).13 Then, through the sum of the diagnoses and procedures relative to index Hospitalization and readmissions, it was generated pos_nDIAG and pos_nPROC, respectively.
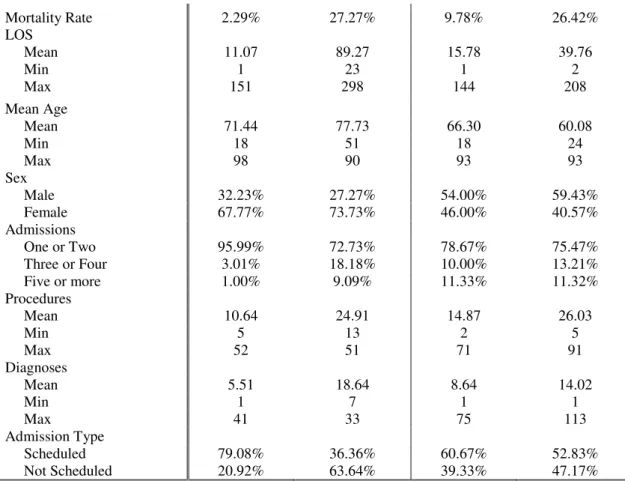
IV.4 Population Characteristics
Tables 5 and 6 provide the demographic information, nosocomial infection, length of stay (LOS), admissions, procedures, diagnoses and admission type for the samples of observations.
“Uninfected” refer to observations not presenting any of the four nosocomial infections
considered in this study.
Table 5: Characteristics of relevant operated patients for wound infection analysis
Hip or Knee Surgery Colorectal Surgery
Characteristic Uninfected Infected by WI Uninfected Infected by WI
N 698 11 450 106
(98.45%) (1.55%) (80.94%) (19.06%) Wound Infection
Index - 63.64% - 87.74%
Pos-Index - 36.36% - 12.26%
13The variable week aims to compare cases with and without nosocomial infections, with similar follow-up periods.
Index hospitalizations in dates from the beginning of the database have almost a year to check the presence of
pg. 13 Mortality Rate 2.29% 27.27% 9.78% 26.42%
LOS
Mean 11.07 89.27 15.78 39.76
Min 1 23 1 2
Max 151 298 144 208
Mean Age
Mean 71.44 77.73 66.30 60.08
Min 18 51 18 24
Max 98 90 93 93
Sex
Male 32.23% 27.27% 54.00% 59.43% Female 67.77% 73.73% 46.00% 40.57% Admissions
One or Two 95.99% 72.73% 78.67% 75.47% Three or Four 3.01% 18.18% 10.00% 13.21% Five or more 1.00% 9.09% 11.33% 11.32% Procedures
Mean 10.64 24.91 14.87 26.03
Min 5 13 2 5
Max 52 51 71 91
Diagnoses
Mean 5.51 18.64 8.64 14.02
Min 1 7 1 1
Max 41 33 75 113
Admission Type
Scheduled 79.08% 36.36% 60.67% 52.83% Not Scheduled 20.92% 63.64% 39.33% 47.17%
Table 6: Characteristics of observations for bloodstream and urinary infections, and pneumonia.
Characteristic Uninfected Infected by BSI Infected by UI Infected by P
N 24,184 247 700 690
(0.97%) (2.75%) (2.71%) Mortality Rate 2.83% 40.08% 20.14% 30.72% LOS
Mean 7.06 37.47 31.08 34.65
Min 2 2 2 2
Max 184 256 304 437
Mean Age
Mean 57.60 66.40 71.65 68.68
Min 18 18 18 18
Max 104 91 98 100
Sex
Male 43.60% 59.51% 40.86% 61.01% Female 56.40% 40.49% 59.14% 38.99% Admissions
One or Two 84.24% 66.80% 74.86% 73.48% Three or Four 10.09% 18.62% 17.00% 16.09% Five or more 5.67% 14.58% 8.14% 10.43% Procedures
Mean 6.66 15.81 13.81 15.07
Min 1 4 2 2
Max 50 50 50 50
Diagnoses
Mean 4.76 12.11 10.41 10.52
Min 0 2 1 1
Max 22 33 33 31
pg. 14 Scheduled 46.11% 30.36% 23.00% 29.28%
Not Scheduled 53.89% 69.64% 77.00% 70.72%
BSI: Bloodstream Infection; UI: Urinary Infection; P: Pneumonia
IV.5 Statistical Analysis
For each problem, statistical estimations were conducted to observe differences between outcomes – length of stay and mortality rate – in the group of infected and in the other not experiencing infection. In order to avoid inconsistent results, for the analysis regarding LOS it was excluded patients who died in Hospital.14 In particular, nosocomial infections may lead to a premature death, hence inclusion of deceased patient might underestimate the attributable Hospital stay. These patients were excluded from analysis regarding LOS, however mortality is analyzed apart.
In the first set of estimations, Graphs 4 to 8 and Tables 5 and 6 show clearly worse length of stay and mortality rates for observations with nosocomial infections. This is in line with the literature: patients with Hospital-acquired infections are associated to higher length of stay and mortality rates.
Graphs 4 to 8: LOS distribution of control and case group before matching
Graph 4. WI: Hip or Knee Surgery Analysis Graph 5. WI: Colorectal Surgery Analysis
14 Laupland et al. (2006)
0
.0
5
.1
.1
5
.2
0 50 100 150
x
Not Infected by WI Infected by WI
0
.0
2
.0
4
.0
6
.0
8
.1
0 50 100 150
x
pg. 15
Graph 6. Bloodstream Infection Analysis Graph 7. Urinary Infection Analysis
Graph 8. Pneumonia Analysis
The hypothesis of equality of outcomes - LOS and mortality rate - between control and case groups was tested using median tests, t-tests, 𝒳2 tests, and Wilcoxon rank-sum tests. The null hypothesis of equality was always rejected with a p-value of zero, thus confirming the graphical and table results.
Secondly, for each analysis, two models were constructed to evaluate the relevance of dependent variables on outcomes: a negative binomial for length of stay, and a logit for mortality rate. It was chosen a negative-binomial model instead of a Poisson, since it was detected an over-dispersion issue (see Appendix 3).15Each of the two outcomes were regressed on age, sex, types of admission, and occurrence of the nosocomial infection in question. In the
15 Cameron & Trivedi (2005)
0
.0
5
.1
.1
5
.2
0 50 100 150
x
Not Infected Infected by BSI
0
.0
5
.1
.1
5
.2
0 50 100 150
x
Not Infected Infected by UI
0
.0
5
.1
.1
5
.2
0 50 100 150
x
pg. 16 regressions referring to length of stay is also included the number of admissions and the type of discharge (DSP).
Table 7: Regression of outputs for wound infections due to hip or knee surgery and colorectal surgery
WI: Hip or Knee Surgery WI: Colorectal Surgery
Length of Stay (NBD)
Mortality Rate (Logistic)
Length of Stay (NBD)
Mortality Rate (Logistic)
Age 0.006*** 0.990 0.006*** 1.048***
Women -0.052 0.222*** -0.192*** 1.330
Not Scheduled Admission 0.654*** 31.928*** 0.254*** 5.343***
Number of Admissions 0.078*** - 0.032*** -
DSP
Short-term Hospital 0.365 - - -
Home under care - 0.331 -
Tertiary care 1.593*** - - -
Hospice-home 0.041 - -0.047 -
WI 1.088*** 8.399*** 0.929*** 3.630***
Constant 1.684*** 0.020** 2.161*** 0.001***
N 690 709 484 556
Pseudo R-sq 0.116 0.277 0.047 0.182
*** p-value≤0.01 **p-value≤0.05 *p-value≤0.1; WI: Wound Infection; DSP=Home care used as baseline
Table 8: Regression of outputs for Bloodstream and Urinary Infections, and Pneumonia analyzes
BSI UI P
Length of Stay (NBD) Mortality Rate (Logistic) Length of Stay (NBD) Mortality Rate (Logistic) Length of Stay (NBD) Mortality Rate (Logistic)
Age 0.009*** 1.044*** 0.009*** 1.041*** 0.009*** 1.044***
Women 0.136*** 0.754*** 0.148*** 0.656*** 0.136*** 0.728***
Not Scheduled Ad. 0.386*** 7.704*** 0.375*** 7.150*** 0.376*** 6.848***
Nr of Admissions 0.020*** - 0.020*** - 0.019*** -
DSP
ST Hospital 0.351*** - 0.393*** - 0.308*** -
Home und. care 0.298*** - 0.294*** - 0.303*** -
Tertiary care 1.422*** - 1.391*** - 1.375*** -
Hospice-home 1.020*** - 0.998*** - 0.984*** -
Swing bed -1.306 - -1.296 - -1.298 -
LT Hospital 1.880*** - 1.873*** - 1.561*** -
BSI/UI/HAP 1.560*** 19.053*** 1.232*** 4.724*** 1.478*** 10.201***
Constant 1.200*** 0.000*** 1.237*** 0.001*** 1.217*** 0.00***
N 23,647 24,431 24,058 24,884 23,977 24,874
Pseudo R-sq 0.032 0.191 0.041 0.168 0.044 0.211
*** p-value≤0.01 **p-value≤0.05 *p-value≤0.1; BSI: Bloodstream Infection; UI: Urinary Infection; P:
pg. 17 According to literature, longer length of stay and higher mortality rate is associated to older patients and males.16 17 Regarding health status variables, non-scheduled admissions, and
higher number of admissions were expected to result in worse outcomes: when patients’
admission is not scheduled might be urgencies, and multiple Hospitalizations may indicate a less healthy patient. It was also considered as explanatory variables the discharge status of the patient in order to distinguish outcomes for different types of discharge. The number of admissions were not included in the regressions relative to mortality rate due to the observation period of the survivors being different from the one of the deceased.
The regressions attesting the presence of nosocomial infections are associated to worse length of stay and mortality rates, except for the regression of mortality rate referring to wound infection after hip and knee surgeries, in all the remaining regressions the outcomes are age dependent with worse results for older patients. Women seem to stay less time in Hospital and have a higher mortality rate. Not scheduled admissions always present poorer results in relation to patients with scheduled admissions. The number of Hospital admissions is always a statistical significant factor and prolong length of stay.
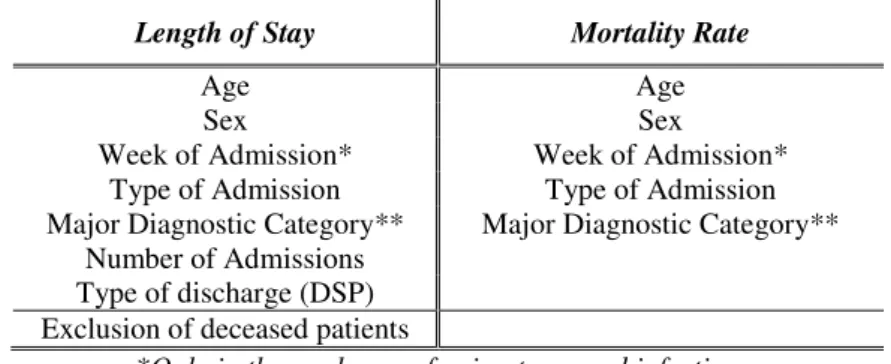
In the final estimation, it was applied a matching estimator in order to reduce the influence of other variables on the differences in outputs between control and case groups. Concerning the choice of relevant covariates, including few variables may create a bias if determinant covariates are excluded; whereas including too many variables may result in a higher number of observations dropping out of the common support. However, when there is a large control group (non-infected), as is the case, it is easier to make a good matching, and there is a Low Bias.18
pg. 18 The estimation also allows for heteroscedasticity and it was bias-corrected for age and number of admissions. Sex, week of admission, types of admission and discharge, and major diagnostic category (MDC) always found exact matching since they are discrete. The matching criteria is listed as follows:
Table 9: Matching criteria
Length of Stay Mortality Rate
Age Age
Sex Sex
Week of Admission* Week of Admission* Type of Admission Type of Admission Major Diagnostic Category**
Number of Admissions
Major Diagnostic Category**
Type of discharge (DSP) Exclusion of deceased patients
*Only in the analyzes referring to wound infections; **Except in the analyzes referring to wound infections
For each analysis, the characteristics presenting coefficients not statistically significant in the respective regression were excluded from the matched criteria. Subsequently, to assess the power of estimation, matched population was compared on the matching criteria. Hence, it was executed Wilcoxon sign-rank tests for continuous variables (age, and week of admission), McNemar tests for binary variables (sex and type of admission), and Marginal homogeneity test for variables with more than two categories (MDC, and DSP).1920 Assuming a 5% level of statistical significance, the null hypothesis of equality was never rejected, validating the estimations (see Appendix 1 for more details).
V.
RESULTS
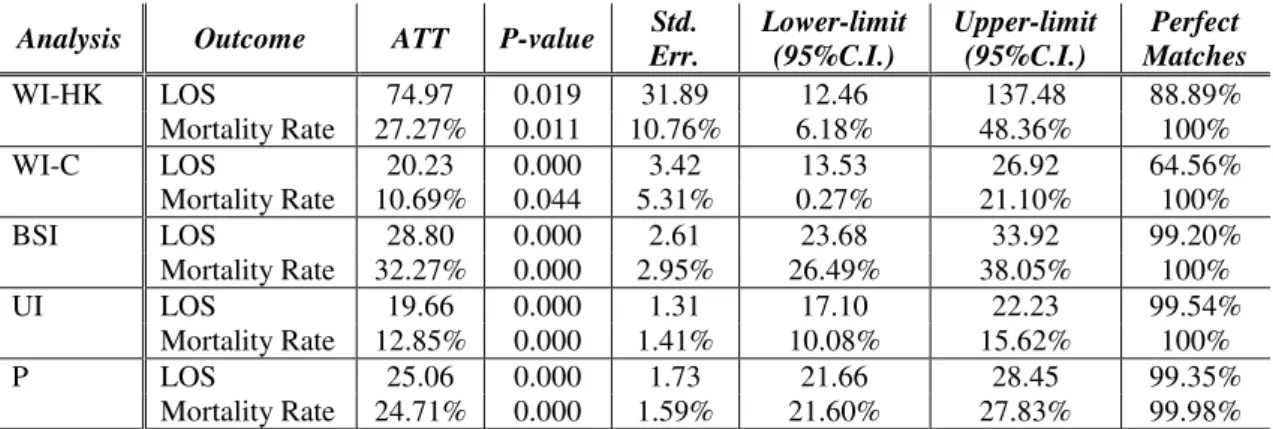
Table 10 presents the estimation results, using to the matching criteria reported in Table 9.21In similarity to the previous statistical analysis, when matching for estimating average treatment on the treated (ATT) of LOS, the observations of deceased patients were excluded.
pg. 19
Table 10: Matching results
Analysis Outcome ATT P-value Std.
Err.
Lower-limit (95%C.I.)
Upper-limit (95%C.I.)
Perfect Matches
WI-HK LOS 74.97 0.019 31.89 12.46 137.48 88.89% Mortality Rate 27.27% 0.011 10.76% 6.18% 48.36% 100% WI-C LOS 20.23 0.000 3.42 13.53 26.92 64.56%
Mortality Rate 10.69% 0.044 5.31% 0.27% 21.10% 100% BSI LOS 28.80 0.000 2.61 23.68 33.92 99.20%
Mortality Rate 32.27% 0.000 2.95% 26.49% 38.05% 100% UI LOS 19.66 0.000 1.31 17.10 22.23 99.54%
Mortality Rate 12.85% 0.000 1.41% 10.08% 15.62% 100% P LOS 25.06 0.000 1.73 21.66 28.45 99.35%
Mortality Rate 24.71% 0.000 1.59% 21.60% 27.83% 99.98%
WI-HK: Wound Infections – Hip and Knee Surgery; WI-C: Wound Infections – Colorectal Surgery; BSI:
Bloodstream Infections; UI: Urinary Infections; P: Pneumonia
The results are consistent with literature and previous analysis: the presence of wound infection is significantly increases length of stay and mortality rate. Last column shows the percentage of infected subjects that find perfect matches: the availability of a large pools of potential uninfected control patients enabled between 64.56% and 100% case observations to be perfectly matched.
VI.
DISCUSSION
VI.1 Comparison of Results
pg. 20 different specificities of each method, it is difficult to ensure that the groups of patients are similar between studies.
VI.2 Years of Potential Life Lost
The impact of HAIs can also be examined in terms of the average time a person would have lived if he or she has not died prematurely. Years of potential life lost (YPLL) for each infected deceased patient was calculated subtracting his age from 70, and when negative it was replaced by zero. In each analysis, YPLL was sorted from the smallest to the largest, and then taking into account the additional number of deaths attributable to the infection at question it was summed the YPLL in order to attain the minimum, the median, and the maximum total YPLL.
Table 11: Years of Potential Life Lost attributable to nosocomial infections
Analysis
Extra Mortality
Rate
Nr. Infected
Additional number of deaths
Total Years of Potential Life Lost
Minimum Median Maximum
WI- Hip and Knee Surgery 27.27% 11 3 1 1 1 WI- Colorectal Surgery 10.69% 106 12 0 30 131 Bloodstream Infection 32.27% 247 80 68 177 441 Urinary Infection 12.85% 700 90 0 105 596
Pneumonia 24.71% 690 171 67 255 692
The previous table does not permit account for a total of years of potential life lost, since this study design allowed cross-infections incidence, i.e., for instance, a patient with bloodstream infection may be also included in the case groups of the other analysis. The reason is that any of these infections may develop into an infection in the bloodstream.22
VI.3 Financial Costs
According to a report from Entidade Reguladora da Saúde (ERS), each day of Hospitalization in a public Hospital costs a mean of 880€ to the National Health System (NHS) costs.1 Taking this value into account, Table 12 presents the financial costs incurred by CHLC associated with
pg. 21 the infections rates estimated in this study, and the possible savings if there is a reduction by half of the prevalence rate, as the challenge of the Gulbenkian Foundation aims to achieve. This potential scenario assumes that: a) the implementation of measures to reduce infections rates incurs no additional costs; and b) pools with the same number of observations.
Table 12: Financial costs and potential savings if HAIs incidence rate is reduced to half
Analysis
Extra LOS
Nr. Infected
Financial
Costs (€) % of CHLC Total Costs
Maximum
Savings (€) WI - Hip and Knee Surgery 74.97 11 666,333.36 0.16% 333,166.68 WI - Colorectal Surgery 20.23 106 1,732,659.04 0.42% 866,329.52 Bloodstream Infection 28.80 247 5,747,788.80 1.41% 2,873,894.40 Urinary Infection 19.66 700 11,119,696.00 2.73% 5,559,848.00 Hospital-Acquired Pneumonia 25.06 690 13,971,451.20 3.42% 6,985,725.60 CHLC Total Costs: 407,999,81423
The previous table does not permit account for an overall savings value for the same reason it could not be aggregated the years of potential life lost in the previous section.
VI.4 Advantages and Limitations
Each surgery, due to its nature, is associated with a given length of stay, thus the type of operation must be controlled in order to attain an accurate additional LOS associated to wound infection. However, in Portugal, there is little literature that focuses on particular procedures for assessing the consequences of wound infections. Given this crucial factor, in this study there are two different analyzes concerning these infections: one whose population is composed of patients operated on the hip or knee, and another for patients submitted to colorectal surgery. Patients are increasingly undertaking surgeries with short Hospital stay, so many wound infections are not detected until after the discharge. Thus, this study is designed to include data related to readmissions in CHLC. As can be seen in Table 5, 37.50% and 11.27% of the wound infections associated, respectively, to the operations of the hip or knee and colorectal surgery are detected after discharge from the index Hospitalization. However, monitoring the post-discharge period presents some weaknesses. First, the available information does not identify
pg. 22 which readmissions are directly associated to the episode of the operation. And second, it cannot guarantee that there were no readmissions in other Hospitals. This will lead to an underestimation of postoperative infection rate, and hence of length of stay and mortality rate. If the readmissions are not considered, the results differ significantly. WI associated to hip and knee replacements drop to only seven cases: on the one hand, it causes a higher additional LOS, which may lead to believe that the most severe infections are diagnosed during or shortly after the surgery; in the other, it is not rejected the hypothesis of no additional mortality. WI due to colorectal surgery results in a lower length of stay.
Table 13: Matching results for wound infections analyzes if readmissions are not considered
Analysis Outcome ATT P-value Std.
Err.
Lower-limit (95%C.I.)
Upper-limit (95%C.I.)
Perfect Matches
WI-HK LOS 118.27 0.001 37.02 45.72 190.83 100% Mortality Rate 23.98% 0.065 12.99% -1.47% 49.44% 100% WI-C LOS 18.03 0.000 3.63 10.91 25.15 100% Mortality Rate 11.53% 0.012 4.61% 2.50% 20.56% 100%
Another limitation inherent in this study, relates to the matched subject design. By restricting control subjects to one per infected subject, it will be lost the data for a large part of the population under study.
pg. 23 with worse outcomes and increased risk of wound infection that have not been included in the matching criteria, there is an overestimation of the increased length of stay and mortality rate. Third place, the number of patients with wound infection after hip and knee surgeries is very low. This is an issue that can jeopardize the validity of results, and so future analysis of nosocomial infections consequences should resort to a database including several Hospitals with longer follow-up time periods.
VII.
CONCLUSIONS
It was estimated that in CHLC wound infections due to hip or knee surgeries result in an average extra length of stay of about 74.97 days per case of infection, and difference in mortality rate of 27.27%. Concerning patients who undertook colorectal surgery, occurrence of wound infection estimated an increase of 20.23 days in length of stay, and an extra risk of dying of 10.69%. Moreover, bloodstream infections increase Hospital stay by 28.80 days and mortality rate by 32.27%. Urinary infections cause an average additional length of stay of 19.66 days and risk of death of 12.85%. Furthermore, Hospital-acquired pneumonia result in an extra Hospital stay of 24.71 days and mortality rate of 24.71%. Despite in line with previous literature, overall, this study presents worse results.
With regards to wound infections, if readmissions were not considered, those associated to hip and knee surgeries would have underestimated considerably the number of infection cases, and operations would have caused a higher additional LOS, but no additional mortality rate. Considering the case of WI due to colorectal operation, it would have underestimated the attributable additional Hospital stay.
This prolonged Hospital stay forces the Hospital (and the National Health System) to incur in additional expenditure, as well as in the use of supplementary resources, including drugs and
health professionals’ time. In economic terms, this waste of resources involves a problem of
pg. 24 The reduction of infection rates can be attained through two possible solutions. The first by creating (or improving) the payment system of administrators and health providers through an incentive scheme: premiums if the incidence rate of nosocomial infections decreases, and penalties if it increases. Obviously, the behavior of these persons would have to be monitored, otherwise this system would represent an incentive to misreport the number of infected patients. The second consists in funding prevention campaigns in order to promote the implementation of safe practices among the health care providers. Further research should focus on assessing the cost-effectiveness of these preventions campaigns.
VIII.
REFERENCES
Bercault, N. & Boulain, T., 2001. Mortality rate attributable to ventilator-associated nosocomial pneumonia in an adult intensive care unit: a prospective case-control study. Crit Care Med, December, 29(21), pp. 2303-9. Cameron, A. C. & Trivedi, P. K., 2005. Microeconomics: Methods and Applications. s.l.:Cambridge University
Press.
CDC, 2011. Control of Health-Care-Associated Infections, 1961-2011. Morbidity and Mortality Weekly Report, 7 October, Volume 60, pp. 60-63.
CDC, 2014. Multistate Point-Prevalence Survey of Health Care-Associated Infections. The New England Journal
of Medicine, pp. 370:1198-1208.
CHLC, 2014. Relatório Analítico da Actividade Assistencial e Desempenho Económico-Financeiro
Coskun, D., Aytac, J., Aydinli, A. & Bayer, A., 2005. Mortality rate, length of stay and extra cost of sternal surgical site infections following coronary artery bypass grafting in private medical centre in Turkey. J Hosp Infect,
June, 60(2), pp. 176-9.
DGS, 2014. Portugal - Prevenção e Controlo de Infecções e de Resistência aos Antimicrobianos em números -
2014, Lisboa: Direcção-Geral da Saúde.
ECDC, 2013. Health inequalities, the financial crisis, and infectious disease in Europe, Stockholm: European Centre for Disease Prevention and Control.
ECDC, 2013. Point prevalence survey of healthcare-associated infections and antimicrobial use in European
acute care hospitals, Stockholm: European Centre for Diseade Prevention and Control.
Eurostat, 2015. Hospital discharges and length of stay statistics. [Online] Available at: http://ec.europa.eu/eurostat/statistics-explained/index.php/Hospital_discharges_and_length_of_stay_statistics#Average_length_of_hospital_stay _for_in-patients
Fiorentino, F., 2013. Hospital-acquired infections: a cost estimation for BSI in Portugal, Lisbon: s.n. Fundação Calouste Gulbenkian, 2015. STOP infecção hospitalar!, Lisboa: Fundação Calouste Gulbenkian. Haddix, A. C., Teutsch, S. M. & Corso, P. S., 1996. Prevention Effectiveness: A Guide to Decision Analysis and
Economic Evaluation. s.l.:Oxford University Press.
Hollenbeak, C. et al., 2003. Surgical site infections following pediatric liver transplantation: risks and costs.
Transpl Infect Dis, June, 5(2), pp. 72-8.
Hollenbeak, C. et al., 2000. The clinical and economic impact of deep chest surgical site infections following coronary artery bypass graft surgery. Chest, August, 118(2), pp. 397-402.
Jackson, A., s.d. Mortality Rates. [Online] Available at: https://geographyas.info/population/mortality-rates/
pg. 25 Kaye, K. et al., 2014. Effect of Nosocomial Bloodstream Infections on Mortality, Length of Stay, and Hospital
Costs in Older Adults. Journal of the American Geriatrics Society, February.62(2).
Khandker, Shahidur R. et al., 2010. Handbook on Impact Evaluation: Quantitative Methods and Practices,
Washington: The World Bank
Kothari, A. et al., 2009. Costs associated with hospital-acquired bacteraemia in an Indian hospital: a case-control study. J Hosp Infect, February, 71(2), pp. 143-8.
Kusachi, S. et al., 2012. Length of stay and cost for surgical site infection after abdominal and cardiac surgery in Japanese hospitals: multi-center surveillance. Surg Infect (Larchmt), August, 13(4), pp. 257-65.
Laupland, K., Gregson, D. & Manns, B., 2006. Cost of intensive care unit-acquired bloodstream infections. J Hosp
Infect, June, 63(2), pp. 124-32.
Leistner, R. et al., 2013. Attributable costs of ventilator-associated lower respiratory tract infection (LRTI) acquired on intensive care units: a retrospectively matched cohort study. Antimicrob Resist Infect Control,
2(13).
Liu, J., Su, Y., Liu, C. & Chen, J., 2002. Nosocomial blood-stream infection in patients with end-stage renal disease: excess length of hospital stay, extra cost and attributable mortality. The Journal of Hospital Infection,
March, 50(3), pp. 224-227.
Madani, N. et al., 2009. Health-care associated infections rates, length of stay, and bacterial resistance in an intensive care unit of Morocco: Findings of the International Nosocomial Infection Control Consortium. Int
Arch Med, October.2(29).
Mpogoro, F. et al., 2014. Incidence and predictors of surgical site infections following caesarean sections at Bugando Medical Centre, Mwanza, Tanzania. Antimicrob Resist Infect Control, 3(25).
NIH, 2010. CMS Changes in Reimbursement for HAIs, s.l.: Med Care.
Pirson, M. et al., 2005. Costs associated with hospital-acquired bacteraemia in a Belgian hospital. J Hosp Infect,
January, 59(1), pp. 33-40.
Primo, M. et al., 2012. Healthcare-associated Staphylococcus aureus bloodstream infection: length of stay, attributable mortality, and additional direct costs. Braz J Infect Dis, November.16(6).
Roberts, R. et al., 2010. Costs attributable to healthcare-acquired infection in hospitalized adults and a comparison of economic methods. Med Care, 48(11), pp. 1026-35.
Rosenthal, V., Guzman, S. & Orellano, P., 2003. Nosocomial infections in medical-surgical intensive care units in Argentina: attributable mortality and length of stay. Am J Infect Control, August, 31(5), pp. 291-5. Semmelweis, I. & Carter, K. C., 1983. Etiology, Concept and Prphylaxis of Childbed Fever. Madison, WI:
University of Wisconsin Press.
Song, X., Srinivasan, A., Plaut, D. & Perl, T., 2003. Effect of nosocomial vancomycin-resistant enterococcal bacteremia on mortality, length of stay, and costs. Infect Control Hosp Epidemiol, April, 24(4), pp. 251-6. Statistics Solutions, s.d. McNemar, Marginal Homogeneity, Sign, Wilcoxon Tests. [Online]
Available at: http://www.statisticssolutions.com/mcnemar-marginal-homogeneity-sign-wilcoxon-tests/ Vrijens, F., Hulstaert, F., Devriese, S. & van de Sande, S., 2012. Hospital-acquired infections in Belgian
acute-care hospitals: an estimation of their global impact on mortality, length of stay and healthacute-care costs.
Epidemiol Infect, January, 140(1), pp. 126-36.
Warren, D. et al., 2006. Attributable cost of catheter-associated bloodstream infections among intensive care patients in a nonteaching hospital. Crit Care Med, August, 34(8), pp. 2084-9.
Whitehouse, J. et al., 2002. The impact of surgical-site infections following orthopedic surgery at a community hospital and a university hospital: adverse quality of life, excess length of stay, and extra cost. Infect Control
Hosp Epidemiol, April, 23(4), pp. 183-9.
WHO, 2005. Clean Care is Safer Care: The First Global Challenge of the WHO World Alliance for Patient Safety,
Switzerland: World Health Organization.
WHO, 2011. Report on the burden of endemic health care-associated infection worldwide, Switzerland: WHO Press.
Zimlichman, E. et al., 2013. Health Care-Associated Infections: A Meta-analysis of Costs and Financial Impact on the US Health Care System. JAMA Intern Med, pp. 173(22):2039-2046.