-
March, 2015
Ricardo Jorge Henriques da Conceição
Bachelor Degree in Biomedical Engineering
Resource recovery from used water
Thesis submitted in partial fulfillment of the requirements for the degree of
Master of Chemical and Biochemical Engineering
Supervisor: Willy Verstraete, Director, Avecom NV
Professor, Gent University
Co-supervisors: Maria da Ascensão Carvalho Fernandes Miranda Reis,
Prof. Dr., Departamento de Química, FCT-UNL
Resource recovery from used water
Copyright © Ricardo Jorge Henriques da Conceição, Faculdade de Ciências e Tecnologia, Uni-versidade Nova de Lisboa.
‘My mother is the most beautiful woman I ever saw. All I am I owe to my mother. I attribute my success in life to the moral, intellectual and physical education I received from her.’
(George Washington)
1
Abstract
Single cell protein (SCP) defines the dried cells of microorganisms that can be used as a
protein supplement both in animal feed or human food. SCP could represent an effective
alterna-tive to meet the high and growing demand of feed products.
This work aimed to develop a simple and economically feasible process to obtain SCP by
adding value to an industrial waste stream. Spent sulfite liquor (SSL), pure glycerol and crude
glycerol and two different types of wood oils were selected. However, the wood oils were early
discharged (after characterization) as possible substrates due to their low chemical oxygen
de-mand (COD) content and an unpleasant and undesirable smell. Thus, only SSL and pure and
crude glycerol were tested.
Crude glycerol proved to be the most viable choice given the high COD content – - g O2/L –
and the low price per ton of COD –200 €/ton COD. In continuous mode it was possible to achieve
biomass concentrations of - g CDW/L (- g CDW/g COD) while efficiently removing - % of the COD
of the influent stream. When tested in batch mode, biomass concentration reached a maximum
of - g CDW/L (- g CDW/g COD) after - days of operation. After - days of operation, CDW per liter
started to decrease which could indicate some sort of inhibition by fermentation by-products or
other toxic compounds.
Considering a batch operation mode, it was possible to produce SCP (- %w/w of protein
content) with a commercial price of - €/ton protein. Thus, SCP production was considered feasible
since it was possible to obtain a product that can highly compete with other feed products, for example, fishmeal (market price: 1.940 €/ton protein).
3
Resumo
Single cell protein (SCP) são suplementos proteicos obtidos a partir de microrganismos, após secagem, que podem ser usados como aditivo alimentar em ração animal ou para consumo
humano. SCP podem representar uma alternativa eficiente para atender à elevada e crescente
procura de produtos alimentares para animais.
Este trabalho teve como objetivo a projeção de um processo simples e economicamente
viável para obtenção de SCP valorizando um efluente industrial. Licor de sulfito gasto, glicerol
(puro e bruto) e dois tipos de óleos foram estudados. Contudo, após caracterização, os óleos
foram descartados como possível substrato devido à baixa carência química de oxigénio (CQO)
e ao seu odor desagradável e indesejável. Posto isto, apena o licor de sulfito e os gliceróis foram
testados.
Devido ao elevado CQO (- g O2/L) e ao baixo preço por tonelada de CQO (200 €/ton CQO),
o glicerol bruto foi selecionado como substrato mais viável. Em contínuo foi possível obter
den-sidades celulares de - g CDW/L (rendimento de - g CDW/g CQO), removendo - % do CQO do
influente. Em batch, após - dias de operação, a densidade celular máxima obtida foi de - g CDW/L (- g CDW/g CQO). A densidade celular diminui após o segundo dia de operação devido,
prova-velmente, a inibição por subprodutos de fermentação ou outros compostos tóxicos.
Operando em batch foi possível produzir SCP (- % w/w de proteína) com um preço comercial de - €/tonelada de proteína. A produção de SCP foi considerada exequível considerando que se
obteve um produto que poderá ser altamente competitivo com outros produtos alimentares para
produção animal. Ração a partir de desperdícios de piscicultura, por exemplo, é atualmente ven-dida a 1.940 €/tonelada proteína).
5
Acknowledgements
I would like to take this moment to acknowledge everyone that took part in this adventure
with me. It is rather amazing how I spent 7 months living abroad, with no financial aid, and when
I returned to my home country I was richer. Not with money. Richer in knowledge. In experience.
In memories. In friends.
Firstly, I would like to express my special appreciation and thanks to my advisor Prof. Willy
Verstraete, Director of Avecom, who so well received me in Avecom. Thank you so much for your
inspiration, guidance and constructive advices. Thank you for giving me the opportunity to finish
my master studies in Avecom.
To Prof. Maria da Ascensão Reis, my thesis coordinator, who made the first contact with
Prof. Verstraete. Thank you for your support and guidance throughout my master studies.
To all my colleagues at Avecom, thank you for being so helpful and encouraging. A special
thank you to engineers Silvio Matassa and Stef Vervaet for their guidance during my internship.
A deepest acknowledgment to engineers Filipe Silva and Vanda Branco for being so helpful, even
before I arrived Avecom. Thank you to the other interns, especially Irene González Barahona, for
being a great colleague and friend.
A big and warm thank you to my parents who always encouraged me to take part in this
adventure. Thank you for your support, education and financial aid. Thank you for everything! To
the other family members, thank you for your love and support especially during my university
years.
My heartfelt gratitude to Ana. More than believing in me, thank you for believing in us. The
past months we proved that a 9 years relationship can survive the distance. Thank you for
show-ing me that it is possible to love you even more. I appreciate your patience and your support
during my stay in Gent.
To my friends, my other family: Fábio, Gil, Inês, João, Lénia, Mauro, Milton, Rafaela, Raquel
and Rute. Thank you for your support and friendship. A special thank you to Inês and Rafaela for
their big companionship, mainly during the past two years. Thank you Inês for the brainstorm
during this thesis.
Thank you to all the other students I have met during my stay in Gent and shared their
expe-rience with me. A special thank you to my bratu Blaž: thank you for all the moments we shared and for your support. This adventure would not be the same without you! Also, a big and warm
thank you to the amazing Portuguese people (Seixos) I have met: Afonso, Cátia, Diana, Isabel, João, Liliana, Maria Inês, Mariana, Patrícia, Raul, Sara, Thibaut, and Tiago. Thank you for all the
memories and for your support.
7
Table of contents
Abstract ... 1
Resumo ... 3
Acknowledgements ... 5
List of figures ... 9
List of tables ... 11
List of terminology: Abbreviations, Units and others ... 13
1. Introduction ... 15
1.1 Avecom NV ... 16
1.2 Goals of the internship ... 16
1.3 Thesis organization ... 17
2. Literature review ... 19
2.1 World feed panorama ... 19
2.2 Single cell protein (SCP) ... 22
2.2.1 Historical Perspective ... 22
2.2.2 SCP sources... 23
2.2.3 Substrates used for SCP production ... 24
2.2.4 SCP nutritional value and use limitations ... 25
2.2.5 SCP production process ... 27
2.2.6 Economic viability of SCP production ... 28
3. Materials and Methods ... 29
3.1 Microbiome, substrates and nutrients ... 29
3.1.1 Microbiome ... 29
3.1.2 Substrates ... 29
3.1.3 Nutrients ... 29
3.2 Reactors operation ... 30
3.2.1 Continuous mode ... 30
3.2.2 Batch mode ... 31
3.2.3 Follow-up of CSTR and batch reactors ... 31
3.3 Analytical techniques ... 32
3.3.1 Total suspended solids (TSS) ... 32
3.3.2 Volatile suspended solids (VSS) ... 32
3.3.3 Dissolved Oxygen (DO) ... 33
3.3.4 pH ... 33
3.3.5 Chemical Oxygen Demand (COD) ... 33
3.3.6 Ammonium nitrogen ... 34
8
3.3.8 Phosphate as orthophosphate ... 34
3.3.9 Kjeldahl-Nitrogen and protein content ... 34
3.3.10 Total fat content determination ... 35
3.3.11 Carbohydrate concentration ... 36
3.4 Harvesting, drying and grinding ... 36
3.5. SCP characterization ... 36
3.6 Economic evaluation ... 36
4. Results and Discussion... 38
4.1. Characterization of the waste streams ... 38
4.2 Waste stream selection ... 39
4.3 Bioreactors operation ... 39
4.3.1 Continuous mode ... 40
4.3.1.1 Spent sulfite liquor ... 40
4.3.1.2 Pure glycerol ... 40
5.3.1.3 Crude glycerol ... 45
5.3.1.4 Remarks on the CSTR operation ... 48
5.3.2 Batch mode ... 48
5.3.2.1 Crude glycerol ... 48
5.3.2.2 pH control ... 50
5.3.2.3 Follow-up of nitrogen content ... 51
5.4 Harvesting, drying and grinding ... 51
5.4.1 Tumble-drying... 52
5.4.2 Microwave drying ... 52
5.4.3 Oven-drying ... 52
5.4.4 Drying temperature ... 53
5.4.5 Grinding ... 53
5.5 Nutritional value and safety of SCP ... 54
5.5.1 Nutritional value ... 54
5.5.2 Safety and quality... 54
5.6 Economic evaluation ... 55
5. Conclusions and future work ... 60
5.1 Conclusions ... 60
5.2 Future work ... 60
9
List of figures
11
List of tables
13
List of terminology:
Abbreviations, Units and othersAbbreviations, Units and others
€ - Euro, monetary unit CDW – Cell dry weight
CFU – Colony forming unit
CG – Crude glycerol
cm – centimeter, unit of length
COD –Chemical oxygen demand
CSTR – Continuous stirred-tank reactor
d – day, unit of time
FAO – Food and agriculture organization
h – Hour, unit of time
HRT – Hydraulic retention time
L – Liter, unit of volume
mL – milliliter, unit of volume
NA – Not available
ºC – Celsius degree, unit of temperature
OLR – Organic loading rate
OPEX – Operational expenditure
PG – Pure Glycerol
sCOD – Soluble chemical oxygen demand
SRT – Sludge retention time
SSF – Solid state fermentation
SSL – Spent sulfite liquor
tCOD – Total chemical oxygen demand
Ton – tonne, unit of mass
TSS – Total suspended solids
VSS – Volatile suspended solids
WO-1 – Wood oil 1
15
Chapter
1
1.
Introduction
World resources for feed production, and thus food production, by conventional methods are hard-pressed to satisfy the needs of an increasing population. Agriculture alone is unlikely to cover the additional demand for feed protein.(Hamdan & Senez, 2009).
Population growth and development are increasing the demand, both quantitatively and
qual-itatively, of animal protein. This is expected to continue as real income grows, particularly in
emerging economies, changing the nutritional habits of the population (Food and Agriculture
Or-ganization, 2004). With the increasing demand for animal protein supply, the demand for feed,
mainly cereals and seed-oil meals, will also increase. The increasing demand for feed are a cause
of great concern since the same grains can compete directly, or in the use of land, with grains for
human consumption (FAO, 2004; Feed International, 2012). According to the International Grain
Council (2014), the 746 million tons of grains used as feed in the crop year of 2010/2011 will
increase to a staggering 834 million tons in 2015/2016 due to the increased protein demand and
consumption.
Recently, for economic and healthy concerns, an increasing consumption of aquaculture
products has been observed and, consequently, an increasing demand for feed for farmed fish
and crustaceans. In fact, over the last 30 years aquaculture production was the segment of world
food production that grew more rapidly, with the highest growth rate (approximately 6 % per year)
(FAO 2012; Feed International, 2012). In 2008, 29 million tons of feed were produced globally for
aquaculture production and the forecasts for 2015 are 51 million tons of feed (Feed International,
012). Aquaculture production alone is projected to increase by 90% between 2010 and 2050,
according to the International Feed Industry Federation (2013). Hence, there is the need to find
16
production from livestock and aquaculture. Protein is the key building block for feed formulationsystems thus the main focus for feed improvement (FAO, 2004).
Protein production via microbiological synthesis could be an effective alternative for feed
production in comparison with conventional agricultural technologies (e.g. soybean cultivation).
Microbiological production uses resources more efficiently, requires less arable land, does not
depend on climate and does not pollute the environment with pesticides. Proteinaceous biomass,
usually called single cell protein (SCP), already outperform plant proteins and are comparable to
traditional animal proteins Daramwal & Gaur, 2004; Jay, Loessner, Golden., 2005).
1.1 Avecom NV
This thesis was carried out at Avecom NV located in Gent, Belgium, within a six months
period internship.
Avecom NV was founded in 1995 as a spin-off of the Laboratory of Microbial Technology
(LabMET) of Prof. Dr. Ir. Willy Verstraete (Ghent University). Avecom NV is now a small and
medium-sized enterprise with focus on steering and optimizing microbial and environmental
pro-cesses. It has expertise in research, development and tailor-made solutions for particular
prob-lems related to microbial waste water treatment and soil remediation. The company offers its own
product portfolio as well as a wide spectrum of lab- and pilot-scale feasibility studies for
valoriza-tion of organic side streams, waste water treatment, anaerobic digesters and soil remediavaloriza-tion.
Avecom NV has a broad know-how in biological concepts thanks to a profound collaboration with
different universities, institutes and industrial partners.
1.2 Goals of the internship
The goal of this 6 months work was to gain know-how on the operation of lab-scale
bioreac-tors, namely for production of protein-enriched biomass, and on several analysis methods
typi-cally associated with biotechnological processes. In this scope, the goal was to add value to a
waste stream in order to develop a new product that Avecom NV could add to their already vast
portfolio.
The waste stream to be used was selected according to the bioconversion efficiency of the
waste into proteinaceous biomass as well as economic factors (e.g. operation costs and price of
final product). The product obtained should be market-competitive.
In order to have a more accurate follow-up of the bioreactors there was also interest in
17
1.3 Thesis organization
This thesis is organized into 6 chapters with 1 appendix. Chapter 1 provides the introduction,
an overview of the company and the goals of the internship. In Chapter 2 is presented a literature
review about the current food and feed consumption as well as a review about single cell protein.
Chapter 3 presents the materials and methods of this work. In Chapter 4 is presented a standard
operation procedure developed during the internship, regarding the determination of
carbohy-drates in aqueous solutions. Chapter 5 contains the results of the study and respective discussion
of results. Finally, Chapter 4 is the conclusion chapter and you can also find some future
19
Chapter
2
2.
Literature review
2.1 World feed panorama
The growing worldwide demand for food of animal origin has been caused by continuing
population growth combined with income growth, urbanization and changes in lifestyles and food
preferences. According to the Population Division of theDepartment of Economic and Social
Af-fairs of United Nations (2013), between 2000 and 2011 the world population grew 5,4 % from 6,1
to 7 billion. Within the next 14 years, population is projected to increase by more than 1 billion
reaching 8,2 billion in 2015 and further increase to 9,6 billion in 2050. Since population growth
and development are correlated with a larger protein consumption, demand for protein, mainly
from animal origin, is also increasing (FAO, 2014; Hamdan & Serez, 2009). Between 2000 and
2011, demand for food of animal origin rose from 226 to 291 million tons, representing 42 kg meat
per capita per year, and this growing trend is expected to continue in the following years (FAO,
200 220 240 260 280 300 6,0 6,2 6,4 6,6 6,8 7,0 7,2
2000 2001 2002 2003 2004 2005 2006 2007 2008 2009 2010 2011
M ea t d emand (million t o n s) P o p u latio n ( b illi o n s) Time (Years)
Population Meat supply
20
2014). The graphic of Figure 2.1 shows the population growth between 2000 and 2011 and meatconsumption in the same period.
The growing trend of meat demand shown in Figure 2.1, projected to continue in the next
years, will severely impact both livestock and crop production systems.
As the demand for meat is climbing, demand over the last few years has been largely met by
the worldwide growth in intensive livestock production, particularly poultry, pigs and aquaculture
products (FAO, 2006). The growth in this three sectors is due to a shifting towards animals that
convert grain into protein more efficiently, representing lower cost products. Considering the four
major meat sources (cattle, pigs, poultry and aquaculture), aquaculture is the livestock sector with
the highest efficiency grain-into-protein, followed by poultry and pigs respectively, while cattle is
the sector with the lowest efficiency of grain conversion (Alexandratos & Bruinsma, 2012; FAO
2014). Cattle requires roughly 7 kilograms of grain to produce 1 kilogram gain in live weight while
most species of farmed fish require less than 2 kilograms of grain. Pigs and poultry production
require 4 and 2 kilograms, respectively, per kilogram of weight gain (Brown, 2006).
Hence, given the highly efficient conversion of feed into protein, aquaculture production
ex-panded at a compound annual growth rate of 6,2 % within the period 2000-2011 (FAO, 2014),
being the sector with the highest growth rate (see Figure 2.2). In the same period, the growth rate
of poultry, pigs and cattle was 3,7%, 2,5% and 0,9%, respectively. As shown in Figure 2.2,
aqua-culture already overtook cattle production, becoming the third most demanded animal protein
source.
Although feed production for aquaculture does not currently represent a great amount, given
the increasing consumption of aquaculture products, thus increasing demand for feed, special
attention should be given to this sector. Production of feed for the aquaculture sector is expanding
at a rate of 6-11 % per year, with no signs of peaking, being the most rapidly expanding market 40 50 60 70 80 90 100 110
2000 2001 2002 2003 2004 2005 2006 2007 2008 2009 2010 2011
M ea t d emand ( million ton s ) Time (Years)
Pigs Poultry Cattle Aquaculture
21
of animal feeds production (Rust, Barrows, Hardy, Lazur, Naughten, Silverstein, 2011; Tacon,Hasan, Metian, 2011). Commercial aquaculture feed sector has grown from 7,6 million tons in*
1995 to 35,3 million tons in 2010 and is projected to reach 71 million tons by 2020 (Feed
Interna-tional, 2012; Tacon et al., 2011). In contrast to commercial aquaculture feeds, farm-made aqua-culture feeds, non-commercial, a rough estimate made by Tacon (2008) forecasted a production
between 18,7 and 30,7 million tons in 2006.
Feed for aquaculture can be obtained from three different sources: animal nutrient sources
(aquatic or land animal protein meals and lipids), plant nutrient sources and microbial nutrient
sources. Although animal and plant nutrient sources play the major role in terms of aquaculture
diet, they have several disadvantages. Plant sources main concerns are the high occupation of
arable land (arable land for feed crops is increasing mainly due to deforestation which has severe
environmental impacts) (Alexandratos & Bruinsma, 2012; FAO, 2006) and competition between
cereals and oil-seeds for human consumption and feed purposes; besides that, plant sources are
highly dependent upon the climate and have other environmental implications (e.g. continuing soil
degradation and loss of fertility) (FAO, 2004). Soybean meal, the most common plant source of
protein, accounted for 25% of the total aquafeed production in 2008 (Feed International, 2012).
As for the animal sources, considering land animals, they are directly and highly dependent
on plant sources; besides, land animal sources are also undesirable considering the severe
en-vironmental impacts of massive livestock production (e.g. land degradation, high emissions of
greenhouse gases and high water usage) (FAO, 2006). Considering aquatic animals the major
concern is the currently highly restrictive policies of fish capture that are slowing down the use of
wild fish as feed for both aquaculture and livestock; the competition factor (human consumption
and feed purposes), already mentioned for plant sources, is also a major concern (FAO, 2014;
Rust et al., 2011). Animal sources have an advantage towards plant sources since sometimes plant feedstuffs have more indigestible organic matter (carbohydrates and fibers) that result in
higher amount of wastes (Naylor, Hardy, Bureau, Chiu, Elliott, Farrel, 2009).
There is then the need to identify and develop sustainable alternatives to both agricultural
and animal nutrient sources that have limited requirements of land, freshwater, nutrients and
en-ergy (Diana, Egna, Chopin, Peterson, Cao, Pomeroy et al., 2013). Microbial nutrient sources (al-gae, thraustochytrids, yeasts, fungi and bacteria) are a promising substitute of conventional
nu-trient sources – animal and plant. Currently, there is only yeast-derived products (brewer’s yeast
and extracted fermented products), in commercial quantities, available for feed purposes (Naylor
et al., 2009; Tacon et al., 2011). Single Cell Protein (SCP) are currently seen as one of the major and most promising alternatives to plant and animal proteins. The main reason is the high growth
rate and efficiency of microorganisms to produce protein compared to traditional sources (animal
and plant) (Jay, Loessner, Golden, 2005).
Despite the potential of SCP to be used as animal feed has been recognized for years, SCP
never fully replaced fish meal at production scale (Zee, Logan, Terry, Spear, 2015). The potential
to substitute, mainly, plant-based proteins into aquafeeds is high but depends on their relative
22
the first criteria that should be addressed is the competitive pricing. Since feed costs typicallyaccount for 40 to 60 % of production costs of aquaculture products is then imperative to use good
quality feeds at reasonable prices to ensure profitability (Hasan & New, 2013; Naylor et al., 2009). Other properties should also be present, such as high protein content, nutritional suitability (e.g.
favorable amino acid profile), high digestibility and pleasant odor and palatability. Additionally, the
product should be ease to handle, ship and store (Naylor et al., 2009).
2.2 Single cell protein (SCP)
The term Single Cell Protein (SCP) was used for the first time by C. Wilson, professor in the Massachussetts Institute of Technology, in 1966, so the product could be seen more favorably by
the target market which could have been reluctant to the idea of a microbial protein or bacterial protein (Ware, 1977). SCP is the name given to dried cells of microorganisms (algae, fungi, yeast and bacteria), used as protein supplement in animal feed or human food (Najafpour, 2015; Ware,
2007). The term should not be understood only as protein source since it refers to the whole
microbial biomass which includes proteins, carbohydrates, lipids, nucleic acids, vitamins, minerals
and other cell constituents.
2.2.1 Historical Perspective
Before the term SCP was first introduced in the 60’s, a pioneer research project conducted by M. Delbrück (Institut für Gärungsgewerbe, Germany), in 1910, had already showed the value
of adding yeast as a feeding supplement for animals. This study would be useful years later in
the Word War I, when Germany faced a shortage of grain and replaced as much as half of its
imported protein sources by yeast, obtained via batch aerobic fermentation of beet and cane
molasses (Nasseri et al., 2011; Rose & Harrison, 1993). In 1919, S. Sak (Denmark) and F.F. Hayduck (Germany) patented a fed-batch process –Zulaufverfahren– in which the sugar supply solution (molasses) was incrementally added to an aerated suspension of yeast instead of adding
yeast to diluted sugar solution (Rose & Harrison, 1993; Ugalde & Castrillo, 2002). Though the
interest in yeast technology declined post-war period, regained interest in 1936 with the Word
War II when several types of yeasts were used as supplement for both human food and animal
feed (Ugalde & Castrillo, 2002).
Post-war years rose awareness to face and tackle the problems of humanity and a number
of international organizations emerged in this scope, under the leadership of the United Nations.
Regarding the United Nations, was created the Food and Agricultural Organization (FAO) which
highlighted worldwide malnutrition and hunger problems in 1960 by showing that 25% of the world population had a deficiency of protein intake in their diet. The population growth predictions com-bined with a prospect that the agricultural production would fail to meet the increasing food
23
(Hamdan & Senez, 2009; Ugalde & Castrillo, 2002). Relatively low selling price of SCP andabun-dant substrates (e.g. by-products such as cheese whey, molasses, methanol, hydrocarbon
sub-strates and spent sulfite liquor), with low prices, steered design towards large scale production and low product cost. In the 60’s, almost 250 million tons of yeast were being product worldwide in order to compensate agricultural shortages.
Although, SCP ended up by being outmarketed in the late 80’s due to an increased agricul-tural output lead by improvements in plant breeding and crop production and the approval of an
open agricultural product trade agreement. With these developments, the price of the major
agri-cultural crops (e.g. soybeans, maize, rice and wheat) did not show the forecasted increase. The
decrease observed in the market price of protein of plant origin effectively conditioned the
expan-sion of the promising SCP market and several industrial processes for SCP production were
dis-continued (Ugalde & Castrillo, 2002). Despite that, in 1985 Quorn™, a SCP-based company,
received unrestricted clearance to start marketing its products and, as for 2007, Quorn™ products
were currently the only SCP produced exclusively to human consumption (Glazer & Nikaido,
2007; Quorn, 2014).
Nowadays, SCP technology is still an attraction as part of an integrated food system for
ani-mal production (poultry, veal and fish) as well as human consumption (e.g. meat substitutes,
tex-ture providing agents and flavor enhancers) (Ugalde & Castrillo, 2002).
2.2.2 SCP sources
Bacteria, yeast, fungi and algae are the main sources of microbial protein that can be used
as SCP (Anupama & Ravindra, 2000). Microorganisms are an excellent source of SCP due to
their rapid growth, ability to grow on inexpensive waste materials and high yield of carbon
source-to-protein (in grams of protein per kilogram of waste). Thus, the requisites for a microorganism to
be suitable for SCP production are high protein content, high growth rate (high productivity),
non-pathogenic characteristics, cellular resistance against medium fluctuations and should be able to
utilize complex mixture of carbon sources, with particular interest to waste materials (Cooney &
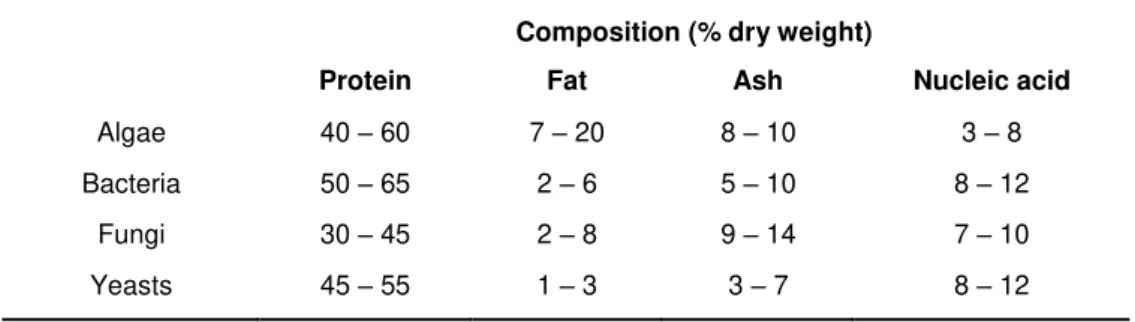
Tannenbaum, 2012; Daramwal & Gaur, 2004; Nasseri et al., 2011). The average composition of SCP, considering the four main sources, is shown in Table 2.1.
Table 2.1 – Composition of SCP (protein, fat, ash and nucleic acid content), in % dry weight, according to the four main sources of SCP: algae, bacteria, fungi and yeasts (Najafpour, 2015).
Composition (% dry weight)
Protein Fat Ash Nucleic acid
Algae 40 – 60 7 – 20 8 – 10 3 – 8
Bacteria 50 – 65 2 – 6 5 – 10 8 – 12
Fungi 30 – 45 2 – 8 9 – 14 7 – 10
24
Bacteria and yeast are particularly interesting due to the shorter doubling time (5-15 minutes)when compared to algae and fungi (2-4 hours) (Najafpour, 2015). Other advantages of yeasts
include their high lysine content, ability to grow at acidic pH and high acceptability by the
popula-tion (Nasseri et al., 2011). As example of species of yeasts used as SCP are Pichia, Candida,
Saccharomyces, Kluyveromyces and Koloechera (Jay et al., 2005; Nasseri et al., 2011). Bacteria have the highest protein content, considering the four major SCP sources, and
pro-tein with good quality, mainly due to a higher amount of lysine and sulfur-bridge amino acids
(Daramwal & Gaur, 2004). However, the high content of nucleic acids and the general public
resistance to bacterial products may represent a disadvantage of SCP from bacteria, if
consider-ing food purposes. Cellulomonas, Pseudomonas, Methylococcus, Bacillus, Rhodopseudomonas,
Lactobacillus, Methanomonas and others, are amongst the genera of bacteria used for SCP pro-duction (Anupama & Ravindra, 2000; Daramwal & Gaur, 2004).
Algae are the source of SCP with the lowest nucleic acid content and they also have high
protein content. Although, the high production costs and technical difficulties associated with the
cultivation, mainly due to the need of light and high surfaces to grow as well as a difficult
harvest-ing process, are big disadvantages when considerharvest-ing cultivation of algae for SCP production.
Production costs can be reduced by placing production plants of such cells in areas where
sun-light is available most of the year although, this characteristic makes the process of producing
SCP climate dependent which is undesirable. Chlorella and Spirulina are the most reported gen-era of algae used for SCP production (Daramwal & Gaur, 2004).
Fungi are the source of SCP with the lowest protein content. Additionally, they have slower
growth rates, when compared to yeasts and bacteria, and low content of sulfur-bridge amino acids
(Daramwal & Gaur, 2004; Nasseri et al., 2011). However, some fungal species have the ability to bioconvert lignocellulosic wastes (Anupama & Ravindra, 2000). Aspergillus, Penicillium, Rhizo-pus, Agaricus, Chaetomium, Fusarium and Phanerochaete are amongst the several fungal spe-cies reported for SCP production (Daramwal & Gaur, 2004).
2.2.3 Substrates used for SCP production
The interesting characteristic inherent to SCP production is the flexibility and suitability of
microorganisms to convert waste materials into protein-enriched biomass (Najafpour, 2015).
Cost-effectiveness production of SCP is directly linked to the substrate used and the
bioconver-sion efficiency into biomass (Daramwal & Gaur, 2004). Hence, there is a great interest in using
waste material as substrate for SCP production since their use as substrate contributes for a
cheaper production cost as well as control the accumulation of wastes (Daramwal & Gaur, 2004;
Najafpour, 2015). Several waste materials have been reported for SCP production including
pe-troleum-based hydrocarbons, methane, methanol, starch, bagasse, manure and animal wastes,
wheat bran and straw and other agricultural and industrial wastes (Anupama & Ravindra, 2000;
Najafpour, 2015).
Although there were already several industrial processes running on high energy sources
25
such as price of substrates highly dependent of oil prices, carbohydrates remainders and politicaland economic decisions (Najafpour, 2015; Trinci, 1992). For instance, in the USA the price of
methanol-derived SCP is 2 to 5 times higher than fish meal, making it an uninteresting alternative.
Due to the highly competitive soya price and the presence of carcinogens in petroleum-based
SCP is no documented company producing petrochemical-derived proteins (Nasseri et al., 2011). Waste materials as substrates is probably the only way to make a large-scale protein
pro-duction unit profitable. Waste materials should be selected according to the local availability to
avoid extra costs resulting from transportation of substrates over long distances. Constant supply
and large volumes of substrate should also be ensured (Daramwal & Gamur, 2004).
Lignocellu-losic substrates can also represent an extra production cost since it is usually necessary a
pre-treatment step to release the fermentable sugars (Nasseri et al., 2011). Despite the promising performance of waste materials as substrate for SCP production, selection of domestic
wastewaters should be avoided. Zee et al. (2014) reported the contamination of SCP products with heavy metals and faecal pathogens due to the processing of domestic sewage.
2.2.4 SCP nutritional value and use limitations
The nutritional value of SCP is based on its composition (protein, fats/lipids, ash, nucleic
acids, carbohydrates and vitamins) and is linked to the selected microorganism, the substrate and
the growth conditions.
The most attractive characteristic of SCP is their high protein content and balanced amount
of enzymes, minerals and vitamins. As drawbacks, mainly when considered for human
consump-tion, there are the rigid cell wall (mainly in algal products), the high content of nucleic acids,
aller-gies, and gastrointestinal effect (Jamal, Alam, Salleh, 2008; Najafpour, 2015). If considering SCP
for food purposes, nucleic acids content should be reduced below 2% either by chemical or
en-zymatic procedures (Nasseri et al., 2011); for the same purpose, the cell wall should also be removed since
Considering the four major SCP sources, bacterial cells produce biomass with the highest
protein content while algae products have the highest lipid content (see 2.1.2 SCP sources, Table
2.1) (Najafpour, 2015). As previously said, amino acids and vitamins are well balanced in all SCP
products. Vitamins of the B-complex are present in all SCP sources (Anupama & Ravindra, 2000;
Jay et al., 2005). Essential amino acids content in SCP from bacteria, yeast and algae is higher than that of plant proteins and essentially similar to animal protein (e.g. casein), as shown in Table
2.2 (Volova & Barashkov, 2010).
Optimal concentration of lysine, an important amino acid, found in SCP and not in major plant
proteins (e.g. wheat) indicates that SCP can successfully replace plant proteins and are
compa-rable to animal proteins (Daramwal & Gaur, 2004; Jay et al., 2005). Amino acids content found in SCP is also comparable with FAO guidelines (Anupama & Ravindra, 2000). When it comes to
digestibility, SCP slightly yield animal proteins but surpass plant proteins (Jay et al., 2005; Volova
26
Table 2.2 – Amino acid composition, in % dry weight, of SCP from bacteria, yeast and algae and amino acid composition of a standard animal protein – casein (Volova & Barashkov, 2010).
Amino acid composition (%dry weight)
Bacteria Yeast Algae Casein (animal protein)
Lysine 8,61 7,02 5,98 7,33
Histidine 2,48 1,96 1,81 2,20
Arginine 8,00 7,30 7,74 3,19
Asparagine 9,57 10,08 9,49 7,11
Threonine 4,52 5,29 4,88 4,22
Serine 3,47 4,02 4,86 5,72
Glutamic 11,17 12,56 13,12 22,20
Proline 3,46 4,58 5,74 10,41
Glycine 5,47 6,05 6,34 1,88
Alanine 8,80 9,07 9,18 2,96
Cystine - 0,56 1,37 0,42
Valine 7,13 6,38 5,41 5,72
Methionine 2,69 2,63 2,16 2,47
Isoleucine 4,58 4,47 3,55 4,10
Leucine 8,52 8,60 8,91 9,39
Tyrosine 3,26 3,62 3,13 4,75
Phenylalanine 3,96 4,42 4,41 4,62
Tryptophan 1,24 1,40 1,58 1,32
Hence, nutritive value of SCP is higher than plant proteins and can be used as a substitute
or a fortifier of this protein source (Daramwal & Gaur, 2004). The majority of SCP products are
found to have a comparable amino acid profile with fish meal (Tacon, Metian, Hasan, 2009; Zee
et al., 2015).
Although, when grown on substrates like hydrocarbons and wastes contaminated with heavy
metals, several toxins and other undesirable compounds can accumulate which decreases the
27
2.2.5 SCP production process
SCP are usually produced by two types of fermentation processes: submerged
fermenta-tion and solid state fermentafermenta-tion (SSF), as shown in Figure 2.3.
(Adapted from FAO, n.d.)
In a submerged fermentation process, the substrate to be used is liquid and is held in the
bioreactor which is operated continuously. The product is filtered or centrifuged and finally dried,
originating the SCP. As for the SSF, is generally used with solid substrates and are more water
efficient and have lower operating costs, when compared with submerged fermentation (Chen,
2013; Mitchell, Berovič, Krieger, 2006). SSF can run efficiently with a water content of 60 % (or in the range 12 – 80% depending on the process); on the contrary, submerged fermentation requires
a water content of around 95%. SSF needs no centrifugation/filtration to harvest the
microorgan-isms which is related to the reduced operation costs. In Table 2.3 is shown a comparison between
both fermentation processes. Although, SSF has several advantages, their use is more suitable
for fermentation of lignocellulosic wastes, where simultaneous saccharification and fermentation
are desirable. It is also more suitable for SCP production from fungi since higher biomass
con-centrations are obtained (Mitchell et al., 2006).
28
Table 2.3 – Comparison between the two fermentation processes usually used for SCP production: submerged fermentation and solid state fermentation (SSF) (Adapted from Chen and Xu, 2004).
Solid-state fermentation Submerged fermentation
Low water content Water is the main component of the culture
Microorganisms absorb nutrients from the wet solid substrate; a nutrient concentration gradient exists
Microorganisms absorb nutrients from the mixed liquor; there is no concentration gradient
Inoculation size is large (> 10%) Inoculation size is small (< 10%)
Required oxygen is from the gas phase; low energy consumption
Oxygen is provided as dissolved oxygen; higher energy consumption due to dissolved oxygen
Microorganisms adsorb or penetrate into the solid substrates
Microorganisms distributed uniformly in the mixed liquor
High production rate and high product yield Low production rate and low product yield
Mixing is difficult and the growth is restricted by nu-trient diffusion
Easy to mix; growth not restricted by nutrient diffusion
Difficult control of temperature Easy control of temperature
Energy consumption and equipment investment are high
Low investment in equipment; low energy con-sumption
Low raw material cost High raw material cost
Little waste organic water Large amount of waste organic water
Heterogeneity Homogeneity
2.1.6 Economic viability of SCP production
Estimating cost of SCP product is of extreme importance for the feed market industry. When
considering SCP production it is relevant to accurately estimate the associated costs since in
most cases the product will be competing with protein sources, mainly of plant origin, and the
profit margins are predictably low. Several parameters can be used to estimate the economic
viability of the process. In SCP production, with no pre-treatment or purification (e.g. nucleic acids
removal) the substrate is the key element and accounts for nearly 62% of the total product cost
followed by 19% of fixed costs, related to the production process (Stanbury, Whitaker, Hall, 2000;
Ugalde & Castrillo, 2002).
To be market-competitive, at least with plant proteins, SCP produced should have at least
the same price. As of December 2014, soybean meal (with 48% of protein), the major source of
plant protein used as feed, was marketed in the USA at 340 euros per ton; fishmeal (with 60%
protein), one of the prime animal protein sources used as feed, was sold at 1.940 euros per ton
29
Chapter
3
3.
Materials and Methods
3.1 Microbiome, substrates and nutrients
3.1.1 Microbiome
A hydrogenotroph was used to inoculate the reactors.
The mixed liquors from the bioreactors were periodically harvested (typically 10% of the total
volume) and stored in a cold room, for further inoculation. Prior to use, the inoculum was
accli-mated to 23 ºC (room temperature).
3.1.2 Substrates
Four types of industrial waste streams were tested to determine the best substrate for protein
production: glycerol (65% purity from Proviron, Belgium), crude glycerol (technical grade from
Delabie, Belgium), spent sulfite liquor and wood oil (Biomass Technology Group, Belgium).
Substrates were previously submitted to several analysis in order to do its characterization,
namely, pH, total and soluble chemical oxygen demand (COD), total suspended solids (TSS),
volatile suspended solids (VSS), ammonium nitrogen, orthophosphate and Kjeldahl nitrogen. The
substrates were stored in a cold room and acclimated to room temperature (23 ºC) before analysis
or feeding.
3.1.3 Nutrients
Apart from the inoculum and substrate, the reactor was fed with nitrogen and phosphate
30
Eq. 3.1
Eq. 3.2
Eq. 3.3
et al. (2013) with 0,26 g CH4N2O, 0,6 g H3BO3, 0,4 g CoCl26H2O, 0,2 g ZnSO47H2O, 0,06 g MnCl24H2O, 0,06 g NaMoO42H2O, 0,04 g NiCl26H20 and 0,02 g CuSO45H2O; 1 mL of trace
elements solution per liter of reactor was added. All solutions and mixed liquors were prepared
with tap water.
3.2 Reactors operation
3.2.1 Continuous mode
A lab-scale continuous stirred-tank reactor (CSTR) was fed with a diluted solution containing
all the nutrients and the substrate (with different concentration), as indicated in Figure 3.1.
Aera-tion was made by means of a sparger of compressed air. The pH of the reactor was kept above
6,75 by automatically adding NaOH. The reactor was operated at room temperature (23 ºC). The
reactor was inoculated with 10% of the total effective volume. The inoculum was previously
accli-mated to the respective substrate.
Sludge retention time (SRT) and hydraulic retention time (HRT) of the reactor are equal. This
is guaranteed by feeding the influent continuously and removing the effluent via overflow. HRT
was calculated according to Eq. 3.1.
HRT = VF
Where:
- HRT represents the hydraulic retention time, in d;
- V is the volume of the reactor, in L;
- F is the influent flow rate, in L/d;
Organic loading rate (OLR) of the reactor was also calculated, in relation to HRT, as shown
in Eq. 3.2.
OLR=CHRTfeed
with:
- OLR representing the organic loading rate, in g COD/Ld;
- Cfeed as the desired COD content, in g COD/L, of the influent (feed) stream;
- HRT representing the hydraulic retention time, in d.
By calculating the OLR it is possible to determine the sludge loading rate (SLR) as shown in
31
Eq. 3.4
Eq. 3.5
SLR=OLR VSS
Where:
- SLR is the sludge retention time, in g COD/g VSSd;
- OLR is the organic loading rate, as mentioned before;
- VSS represents the volatile suspended solids, in g VSS/L;
The amount of substrate to be added to the feed stream in order to achieve the desired COD
in the influent was calculated according to Eq. 3.4.
Vsubs = CCfeed subs ∙Vfeed
Where:
- Vsubs represents the volume of substrate that should be added to the feed stream to
obtain the desired COD content, in L;
- Cfeed is the desired COD content, in g COD/L, of the influent (feed) stream;
- Csubs is the COD content, in g COD/L, of the substrate to be used;
- Vfeed is the volume of feed, in L, to be prepared for a given test.
-
3.2.2 Batch mode
A reactor with the same characteristics as the one previously described was operated in
batch mode. This typology was tested only with crude glycerol, with two different initial organic
loads –*. All nutrients and the crude glycerol were provided in the beginning of the batch. The
reactor was aerated with compressed air, through an air sparger, and the pH was kept above 6,8
by automatic addition of NaOH, as shown in Figure 3.2. The reactor was operated at 23 ºC (room
temperature).
3.2.3 Follow-up of CSTR and batch reactors
Both operation modes were monitored regarding the same parameters: soluble chemical
oxygen demand (sCOD), total suspended solids (TSS), volatile suspended solids (VSS),
dis-solved oxygen (DO) and pH.
Soluble COD was used to calculate the COD removal efficiency (in percentage) of each
reactor according to Eq 3.5.
COD removal efficiency = CfeedC -CML
feed ×100%
Where:
32
Eq. 3.6
Eq. 3.7
- CML is the soluble COD in the mixed liquor, in g COD/L.
3.3 Analytical techniques
3.3.1 Total suspended solids (TSS)
Total solids content in the samples was determined by the dry residue method as described
by Clescerl et al., 1999. Dry residue contains all suspended solids as well as soluble compounds. The dry residue was obtained after the evaporation of the water contained in a certain sample
volume, after drying in a kiln at 103–105 ºC until constant weight. According to this method, a
previously dried and empty crucible was weighted, by means of an analytical balance (Sartorius
TE64, Germany), and then filled with a certain sample volume. The crucible was then placed in a
kiln (Memmert, Germany) at 105 ºC overnight, until constant weight. After drying, the crucible was
placed in a desiccator in order to cool down until ambient temperature and then weighted. Total
solids (TSS), expressed in g/L, can then be calculated according to Eq. 3.6.
Total suspended solids (TSS) = m2V-m1 S
where: m2 = weight of the crucible with the sample after drying at 105 ºC (g);
m1 = weight of the pre-dried crucible (g);
VS = volume of sample used in the determination (L);
3.3.2 Volatile suspended solids (VSS)
Volatile solids content was determined by the ash content method, as described by Clescerl
et al., 1999. The ash content corresponds to the residue left after incineration of the dry residue (previously obtained by the dry residue method) in the muffle oven at 600 ºC ± 50 ºC.
Subse-quently, the porcelain crucible with the dry matter was placed in the muffle oven LE 4/11/R6
(Na-bertherm, Germany) at 600 ºC for 2 hours. The procedure was then the same as for the dry
residue method: after 2 hours the crucible was placed in the desiccator to cool down until ambient
temperature. After cooling down the crucible was weighted and the ash content (volatile
sus-pended solids, VSS) was calculated according to Eq. 3.7.
Volatilesolids (VSS) = m2V-m1 S
where: m2 = weight of the crucible with the sample after incineration at 600 ºC (g);
m1 = weight of the crucible with the sample previously dried at 105 ºC(g);
33
Eq. 3.8
Eq. 3.9
3.3.3 Dissolved Oxygen (DO)
Dissolved oxygen (DO) was measured using a DO meter (WTW Oxi 315i, Germany). DO in
the reactors was kept above 2 mg O2/L.
3.3.4 pH
pH was measured using the pH meter (Consort C535, Belgium).
3.3.5 Chemical Oxygen Demand (COD)
Chemical oxygen demand was determined by two different methods, depending on the
sam-ples. Chemical oxygen demand (COD) of mixed liquors was measured photometrically using a
spectrophotometer (HACH Lange DR 3900, USA) and easy-to-use kits LCK014 (range: 1.000 –
10.000 mg O2/L) and LCK 514 (range: 100 – 2.000 mg O2/L) as specified by the manufacturer;
solid samples and substrates were analyzed by means of the reference method. COD standard
method is based on the oxidation (destruction) of organic matter by potassium dichromate,
cata-lyzed by silver sulfate. Destruction was followed by a colorimetric titration with a ferroin indicator
of the excess of non-reduced potassium dichromate with iron ammonium sulfate. The COD can
then be calculated as shown in Eq. 3.8 and expressed in mg O2/L or, in case of a solid sample,
in mg O2/g sample.
COD = (A − BV)∙t∙8000 S
where: A = volume of iron ammonium sulfate solution used for titrate the blank (mL);
B = volume of iron ammonium sulfate solution used for titrate the sample (mL);
t = normality of the iron sulfate ammonium solution (N);
8000 = milliequivalent weight of oxygen
VS = amount of sample used in the determination (L or g);
The normality (t) of the iron sulfate ammonium solution is calculated according to Eq. 3.9.
t = 10 ×0,25n
with n = volume of iron ammonium sulfate solution for the normality determination (mL).
Mostly of the COD analysis performed were regarding the soluble COD. Analysis of soluble
COD are performed in the supernatant of a previously centrifuged sample (usually 20 mL volume)
34
Eq. 3.10
3.3.6 Ammonium nitrogen
Ammonium nitrogen (NH4+-N) was measured photometrically using a spectrophotometer
(HACH Lange DR 3900) and the commercial easy-to-use kits LCK302 (range: 47 – 130 mg NH4+
-N/L), LCK303 (range: 2,0 – 47 mg NH4+-N/L) and LCK304 (range: 0,015 – 2,0 mg NH4+-N/L),
ac-cording to the manufacturer indications. In order to remove suspended solids, the samples were
previously centrifuged at 10.000 rpm for 10 minutes (Eppendorf 5810, Germany).
3.3.7 Nitrate and nitrite as nitrogen
Nitrate as nitrogen (NO3--N) was measured photometrically using a spectrophotometer
us-ing the easy-to-use kits LCK339 (range: 0,23 – 13,5 mg NO3--N/L) and LCK340 (5 – 35 mg NO3-
-N/L), according to the manufacturers indications.
Nitrite as nitrogen (NO2--N) was measured photometrically using a spectrophotometer using
the easy-to-use kits LCK341 (range: 0,015 – 0,6 mg NO2--N /L) and LCK342 (range: 0,6 – 6 mg NO2--N/L) as indicated by the manufacturer. Samples were previously centrifuged at 10.000 rpm for 10 minutes in order to remove suspended solids.
3.3.8 Phosphate as orthophosphate
Phosphate as orthophosphate (PO43--P) was measured photometrically using a
spectropho-tometer using the easy-to-use kits LCK 348 (range: 0,5 – 5 mg PO43--P /L) and LCK350 (range: 2
– 20 mg PO43--P /L) as specified by the manufacturer.
3.3.9 Kjeldahl-Nitrogen and protein content
Kjeldahl method is used to determine organic and ammoniac nitrogen content of organic and
inorganic substances. This method is based on the conversion of organic nitrogen in ammonium
nitrogen under the form of ammonium sulfate, by means of destruction using concentrated sulfuric
acid (98%) and a Kjeldahl catalyst (catalyst tablet containing 5 g K2SO4 and 0,5 mg CuSO4.5H2O)
at high temperatures (400 ºC). After destruction, ammonium is released in alkaline solution as
ammonia, distilled and bound as borate. The nitrogen content was determined with an acid-base
titration. Nitrogen content, expressed as Kjeldahl nitrogen (Kj-N), was calculated according to
Eq.3.10.
Kj-N =(A - B)∙t∙MMN∙1000
VS ∙f
With A = volume of acid (HCl) titrated for the sample (mL)
35
Eq. 3.11
Eq. 3.12
t = titre of the HCl solution (usually 0,02 N)
MWN = molecular weight of Nitrogen (g/mol)
VS = volume of the sample in mL.
f = dilution factor
Protein content of biomass was determined using Kjeldahl method. Although, this method
does not measure the protein content directly, therefore a conversion factor (FK) was applied in
order to convert the measured nitrogen concentration to protein concentration, as shown in Eq.
3.11.
P=FK×N
with P = Protein content (mg/L)
FK = Kjeldahl conversion factor
N = content of nitrogen (mg/L)
The magnitude of the Kjeldahl factor depends on the sample matrix (e.g. amino acid
compo-sition of the proteins) but a conversion factor of 6,25 is usually accepted, for simplification
rea-sons.
3.3.10 Total fat content determination
Total fat content in biomass was determined using a lipids extraction method – Soxhlet
method. According to this method lipids were extracted from the sample by multiple rinsing out
with an organic solvent. The organic solvent used was fat-free petroleum ether (PE) with a boiling
point range between 40 and 60 ºC. At the end of the extraction process the organic solvent was
distilled out from the extracted lipid. The glass flask was then dried in the oven, at 105 ºC
over-night, until constant weight. After cool down, the mass of the extract (total fat) was then measured
and the percentage of extractable lipid (EL) in the initial sample was calculated according to Eq.
3.12. The fat content can also be expressed in miligrams of extractable lipids per gram of sample
(mg EL/g sample).
EL = (m2 - m1) mS ×100%
where,
m2 is the mass, in grams (g), of the extraction flask containing the extracted lipid after sol-vent evaporation (distillation and oven-drying) and cooled down to room temperature until
constant weight;
m1 is the mass, in grams (g), of the clean extraction flask (tare);
36
3.3.11 Carbohydrate concentration
The determination of the carbohydrate concentration was performed using a method
imple-mented and validated in Avecom throughout this work (See 4. Standard Operation Protocol).
3.4 Harvesting, drying and grinding
Reactors were harvested and the mixed liquor was kept in a beaker to let it settle
gravita-tionally for approximately - minutes. The supernatant was then discharged and the settled
bio-mass was centrifuged during - minutes at - rpm using - mL bottles. In order to wash the pellet
before drying, the pellet was centrifuged one time with water in the same conditions. Three
differ-ent drying processes were tested: (1) tumble drying, (2) microwave drying, and (3) oven drying.
The dried product was then ground by means of a pestle and a mortar.
3.5. SCP characterization
The characterization of the single cell protein – ProMic pure – was performed according to
content of protein (Kjeldahl method), lipids (Soxhlet method), carbohydrates (Dubois method),
ash and solubility in water.
3.6 Economic evaluation
Economic viability of the project was evaluated according to calculations regarding the
pro-cess operation costs (e.g. costs of substrate, base/acid, oxygen, centrifuging and drying) and the
price of the final product. The total process operation costs (Total OPEX) and the price of the final
37
Chapter
4
5
.
Results and Discussion
4.1. Characterization of the waste streams
Prior to use, pure glycerol (PG), crude glycerol (CG), spent sulfite liquor (SSL) and two
dif-ferent types of wood oil (WO-1 and WO-2) were characterized in order to evaluate its applicability
as carbon source for the reactor. In Table 5.1 are shown the main characteristics (pH, tCOD,
sCOD, TSS, VSS, ammonium nitrogen, orthophosphate, total and soluble Kjeldahl nitrogen, color
and scent) of the possible suitable substrates for production of proteinaceous biomass.
Table 4.1 - Characterization parameters (pH, total and soluble COD, TSS, VSS, ammonium nitrogen, phosphate, total and soluble Kjeldahl nitrogen, color and scent) of pure glycerol (PG), crude glycerol (CG), spent sulfite liquor (SSL) and wood oils (WO-1 and WO-2).
Sample
PG CG SSL WO-1 WO-2
pH
tCOD (g O2/L)
sCOD (g O2/L)
NH4+-N (mg/L)
PO43--P (mg/L)
TSS (g/L)
VSS (g/L)
Kj-Nt (mg/L)
Kj-Ns (mg/L)
Color
38
As shown in Table 4.1, pure glycerol, crude glycerol and SSL both have high COD (higherthan - g O2/L) which indicated they were promising substrates for the intended goal; on the other
hand, both wood oils (WO-1 and WO-2) had low COD which indicated that these two substrates
would not be a good choice as carbon source for the reactor.
4.2 Waste stream selection
In order to be selected as suitable substrates, there were some requirements that the waste
streams had to meet: (1) high COD content; (2) no presence of toxins or other potential harmful
compounds; (3) low cost per kilogram of COD; and (4) high availability (high volumes, constant
supply and no rupture of stocks). The COD content is shown in Table 4.1. Regarding this
param-eter, as previously explained, WO-1 would be the stream to be early discarded due to a low COD
content. Although, since both wood oils had an unpleasant smell they were both discarded as
possible substrates, since it is an unwanted characteristic of feeding products.
The presence of toxins is hard to determine therefore this parameter was not used to decide
the suitability of the streams as substrate. Since all the waste streams were readily available, their
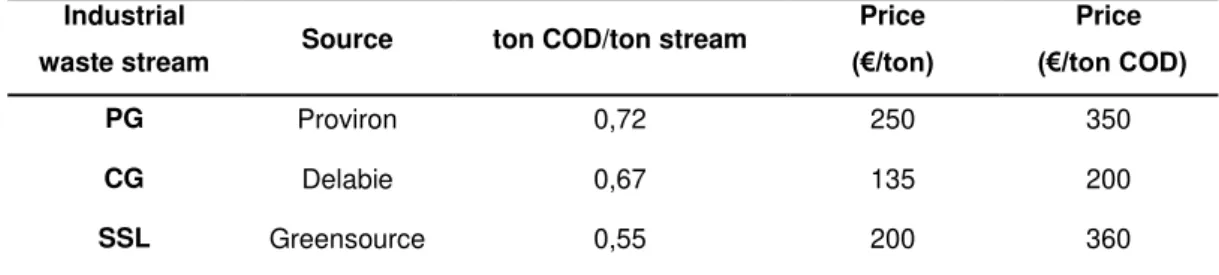
availability could not be used as an excluding factor. Considering the price of the different waste
streams (in euro per ton of COD), crude glycerol appeared to be the most promising waste stream
given that it had the lowest price per ton of COD (200 €/ton) comparing to 350 €/ton and 360 €/ton
for PG and SSL, respectively. Although PG was purchased at 250 € per ton the market price had
to be discussed with the supplier. The initial market price of PG was 650 € per ton which would
be unfeasible. In Table 4.2 is shown the price overview of the substrates tested: PG, CG and
SSL.
Table 4.2 –Price overview (as €/ton and €/ton COD) of the substrates tested.
Industrial
waste stream Source ton COD/ton stream
Price
(€/ton)
Price
(€/ton COD)
PG Proviron 0,72 250 350
CG Delabie 0,67 135 200
SSL Greensource 0,55 200 360
Comparing the characteristics of the five acquired waste streams, the substrates selected to
be tested were the pure glycerol, crude glycerol and SSL. A mixture of pure glycerol and SSL was
39
4.3 Bioreactors operation
4.3.1 Continuous mode
CSTRs were tested since it is one of the most widely typologies used for SCP production.
Continuous operation was only tested with SSL, PG and an equal mixture of both. The reactors
were followed-up during several weeks in order to achieve a steady-state biomass, thus protein,
production. Previously to this work, the CSTRs were operated under the same process conditions,
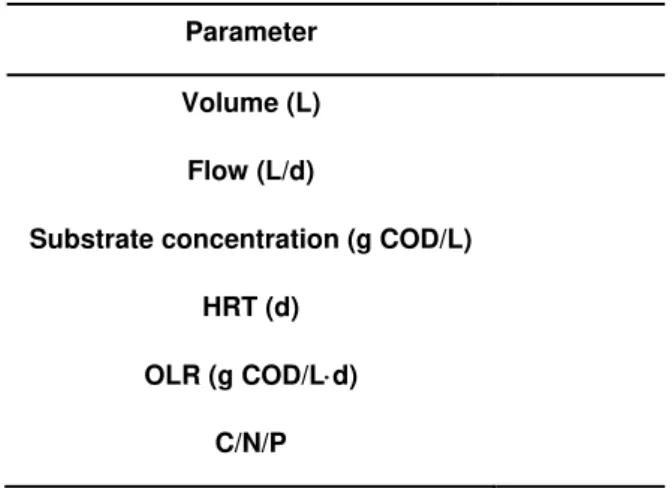
as evidenced in Table 4.3.
Table 4.3 – Previous process conditions of the CSTRs operated in Avecom
Parameter
Volume (L)
Flow (L/d)
Substrate concentration (g COD/L)
HRT (d)
OLR (g COD/Ld)
C/N/P
Although this organic concentration – - g COD/L – was not inhibitory of bacterial growth, the
substrates were too recalcitrant (results not shown). Therefore the initial substrate concentration
provided to the reactors was decreased from - g COD/L to - g COD/L. Since there was also a high
amount of ammonium nitrogen left in the effluent (results not shown), the nitrogen source was
reduced. The C/N/P was then changed from -/-/- to 100/5/1. The flow rate was increased from - L
feed/d to - L feed/d. The reactors already showed a constant performance to the previously
im-posed - g COD/Ld. Thus this one was increased to - g COD/Ld.
4.3.1.1 Spent sulfite liquor
Two tests, with different feed concentrations were performed with spent sulfite liquor. Feed
solutions were prepared with - g COD/L (- mL SSL/L) and - g COD/L (- mL SSL/L). Feed flow rate,
HRT, OLR and C/N/P were kept constant in both tests. Ammonium chloride was used as nitrogen
source and dipotassium phosphate was used as phosphate source. The - L CSTRs fed with SSL
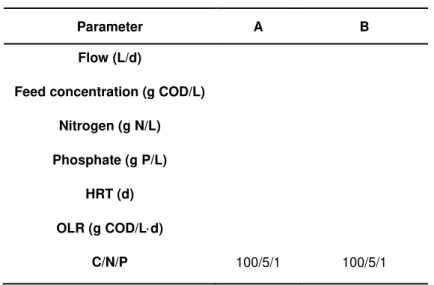
40
Table 4.1 - Process parameters of the SSL–reactor fed with 20 gCOD/L (A) and 10 g COD/L (B).
Parameter A B
Flow (L/d)
Feed concentration (g COD/L)
Nitrogen (g N/L)
Phosphate (g P/L)
HRT (d)
OLR (g COD/Ld)
C/N/P 100/5/1 100/5/1
The results of the follow-up, namely the COD and the COD removal efficiency, of the CSTR
fed with - g COD/L are shown in the graph of Figure 4.1.
As evidenced in Figure 4.1, the highest SSL consumption rate was obtained between day -
and day - (removing - % of the COD of the influent). In the following days, the COD removal
efficiency continued to increase, although at a slower rate. It reached a maximum peak at day - 0% 10% 20% 30% 40% 50% 60% 70% 80% 90% 100% 0 2 4 6 8 10 12 14 16 18 20 22
0 1 2 3 4 7 8
COD r e m o v al e ff ic ie n cy solub le C OD (g COD /L) Time (days)
Removal efficiency sCOD
41
with - % of COD removal from the influent. After day -, the consumption of substrate stabilizedaround - g COD/L. In Figure 4.2, is shown the cell dry weight (CDW) as well as the biomass yield.
Maximum cell dry weight – - g CDW/L – was achieved in the - day of operation. This
corre-sponded to a yield of approximately - g CDW/g COD. The maximum yield obtained was within the
range usually reported in literature (Guo & Olsson, 2014; Helle, Lin, Duff, 2008). After day -,
bio-mass concentration showed a decreasing tendency.
A test with a stream with lower COD content (- g COD/L) was also performed. The results
are shown in Figure 4.3.
0 0,025 0,05 0,075 0,1 0,125 0,15 0,175 0,2
0 1 2 3
0 1 2 3 4 7 8
Yi
e
ld
(g CDW
/g
COD
)
CDW
(g/L)
Time (days)
DCW Yield DCW/COD
42
Figure 4.3 – Soluble COD, in g COD/L, and COD removal efficiency (%) of a reactor continuously fed with - g COD of SSL per L.
Comparing the graphs of Figures 4.1 and 4.3 one can tell that both reactors showed a similar
performance. The reactor fed with - g COD/L reached the maximum of COD consumption at day
- of operation, with a removal efficiency of -%. From day - onwards COD consumption stabilized:
the COD left in the effluent was around - g/L; the COD removal efficiency was approximately - %.
Cell dry weight and respective yield CDW/COD was not considered in this test.
A great amount of base was consumed in order to control the pH of the reactors.
Approxi-mately - mL of NaOH were pumped to the reactor per day (considering the one fed with - g
COD/L). This highly influences the process costs since a higher amount of base is linked to higher
process costs. SSL and the high amount of base consumed combined with its high cost (350 €
per ton of COD), SSL was economically unfeasible and should not be considered for scale-up (for
detailed economic viability please refer to 4.6 Economic evaluation). The process could still be
considered feasible if the biomass yield was high since the high amount of cell produced would
compensate the high costs. Though, this was not verified since the biomass yield was too low.
4.3.1.2 Pure glycerol
Pure glycerol was tested an influent stream containing - g COD/L. The process parameters
applied were the same as described before (see Table 4.4).
0% 10% 20% 30% 40% 50% 60% 70% 80% 90% 100% 0 2 4 6 8 10 12 14
0 1 2 3 4 7 8
COD r e m o v al e ff ic ie n cy solub le C OD (g COD /L) Time (days)