A Work Project presented as part of the requirements for the Award of a Master’s Degree in Economics from the Nova School of Business and Economics – Universidade Nova de Lisboa
On the Labor Share
The Long-run equilibrium and its adjustment process
Eduardo Polena Pacheco Araújo Costa Student number 689
A project carried out under the supervision of:
Professor Miguel Lebre de Freitas Professor Luís Catela Nunes
On the Labor Share: The Long-run equilibrium and
its adjustment process
Eduardo Costa
Nova School of Business and Economics – Universidade Nova de Lisboa
Master’s Thesis developed under the advisory of Professor Miguel Lebre de Freitas and Professor Luís Catela Nunes
January, 2016
Abstract
This research computes an Equilibrium Labor Share using a VECM for a panel of 19 countries,
analyzes what determines the speed at which the labor share adjusts towards that equilibrium and
decomposes this adjustment in terms of real wages and employment. Results suggest that the speed
at which a country adjusts decreases with employment protection legislation and labor taxes. Most
countries’ labor shares adjustment is made through real wages changes instead of changing employment, suggesting that wage moderation policies may play an important role on the
adjustment process without harming employment.
Keywords: Equilibrium Labor Share; Real Wages; Unemployment; VECM
Acknowledgments: I would like to thank to my family and to Inês for all the support during the
last few months. Additionally, I would like to thank to António Ribeiro dos Santos, Rui
1.
Introduction
The distribution of income between labor and capital has always been a very relevant topic in
economics. The portion of income attributed to remunerate the labor input is known as labor share1.
Until recently, labor share did not generate a lot of curiosity since, in 1963, Kaldor documented its
stability as a stylized fact of economic growth. Nevertheless, data from recent decades has
challenged this stability as a steady decline in the labor share was observed (Arpaia, et al. 2009),
while several European countries faced a rising inequality and decreasing real wages for
low-skilled workers (European Commission, 2007). The labor share decay is frequently employed by
unions in Europe as a reason against wage moderation policies, and it is being seized upon by
governments as an argument for profit taxation. Policy makers struggle to understand what drives
the labor share in the long-run and which factors are likely to deviate it from its long-run
equilibrium level in the medium/short-run.
The paper objectives are threefold. Firstly it aims to estimate the equilibrium labor share as a
function of key determinants. Secondly, it intends to analyze why countries adjust at different
speeds to equilibrium. Finally it will study how this adjustment is made. Since one can decompose
labor share as real wages times the inverse of labor productivity, this research aims to understand
which variable is responsible for the adjustment to its long-run level. For instance, if labor share is
higher than its equilibrium, in some countries, firms may adjust by dismiss workers while others
will opt by wage cuts.
1The Labor Share is defined as the nominal total compensation of labor (wage bill) over the nominal gross domestic product.
𝑠𝐿=𝑤𝐿𝑃𝑌=𝑤𝑃1𝑌 𝐿
The policy pursued will have significant implications. Wage changes may be seen as a more
equitable tool since it circumvents unemployment and firing costs to firms. Additionally, up to a
certain extent, wage moderation policies (nominal wage increases below inflation), may slyly
contribute to the adjustment – without having such explicit and immediate consequences as firing workers. On the other hand, significant employment changes may reflect a more flexible labor
market where hiring and firing workers is easier. This may dodge real wage adjustments but will
require more support for the unemployed – otherwise significant social problems might arise. Thus, the adjustment variable should depend on labor and product market characteristics, and will be
different, not only among countries, but also over time.
The paper innovates on introducing an equilibrium labor share concept, independent of economic
cycles, which will allow us to analyze the adjustment process towards that benchmark in terms of
wages and employment, as well as to relate this adjustment with country-specific characteristics.
This research also innovates on using a VECM model to capture this long-run relation.
The structure of this paper is the following: the next chapter reviews the theoretical determinants
of the labor share, while presenting and proposing a theoretical model to explain its dynamics.
Section 3 presents some stylized facts about the Labor Share and describes the data used in the
estimation. Section 4 explains the methodology pursued and discusses some econometric concerns.
Using a VECM model, the equilibrium labor share is estimated and the corresponding gap is
computed in section 5. Since the model estimated predicts different adjustment speeds among
countries, section 6 takes a closer look on factors driving those speeds, in light of the theoretical
model proposed before. Section 7 extends the analysis on the adjustment process and decomposes
it in real wages and employment effects. The last section presents the main conclusions and its
2.
Labor Share dynamics: a model for the Labor Share
The neo-classical growth model assumptions imply that the equilibrium labor share would always
be constant over time. Since this is not the case, as a decline trend is observed, the model proposed
deviates from the Cobb-Douglas function and uses instead a Constant Elasticity of Substitution
production function (CES) that allows the elasticity of substitution to be different from one. This
model will allow the long-run labor share to evolve over time. Please refer to appendix I for more
details on model derivations.
Let L and K be Labor and Capital inputs with costs w and r respectively. A and B are labor and
capital productivity levels, while γ is the substitution parameter which is closely related to the elasticity of substitution between capital and labor2. Firms in this economy aim to maximize their
profits according to the following formulation:
max
{𝐿,𝐾}𝜋 = 𝑃𝑌 − 𝑤𝐿 − 𝑟𝐾 𝑠. 𝑡. 𝑌 = [𝛽(𝐴𝐿)
−𝛾+ (1 − 𝛽)(𝐵𝐾)−𝛾]−𝛾1 (1)
According to Bentolila and Saint-Paul model (2003), differences across countries’ long-run labor shares are explained by different steady-state levels of capital-output ratio (k) – this relation is known as the SK schedule. If however there is capital-augmenting technical progress the SK
relation will shift3. Arpaia et al. (2009) argue that capital-augmenting technical progress, which is
low-skilled labor saving, is a main driver in plummeting European countries’ labor share. Also if the production function depends in an intermediate input (such as an imported material like
energy), the labor share will no longer be a sole function of k since it will hinge on also on the real
2𝜎 = 1
1+𝛾 𝑎𝑛𝑑 𝛾 = 1−𝜎
𝜎
3 Considering a production function as follows the labor share will be given by: 𝑌 = 𝑓(𝐴𝐾, 𝐵𝐿) ⇒ 𝑠
𝐿=
price of this good. Accordingly, as in the long-run companies operate under perfect competition
without market frictions, real wages will be equal to the marginal product of labor.
𝑤
𝑃 = 𝑀𝑃𝐿 = 𝜕𝑌
𝜕𝐿 = 𝛽𝐴−𝛾(
𝑌
𝐿)
1+𝛾
(2)
The Labor Share is therefore given by:
𝑠𝐿,𝑃𝐶= 𝑤𝐿𝑃𝑌 = 𝑀𝑃𝐿𝑌 = 𝛽𝐿 (𝐴𝐿𝑌 ) 𝛾
= 𝛽(𝐵𝑘)−𝛾 = 𝛽(𝐵𝑘)𝜎−1𝜎 (3)
Equation (3) suggests that, in the long-run, Labor Share is determined by the level of the
capital-output ratio and capital augmenting technical progress. However, in the medium-run markets are
not competitive. Therefore we the need to depart from the assumption behind the SK schedule
(Magnani, 2009) and account not only for monopolistic competition (imperfections in the product
market) but also to union wages bargaining (imperfections on the labor market). Blanchard (1997
and 1998) has empirically found that the presence of imperfect competition decreases the labor
share. According to Arpaia et al. (2009) and to the European Commission (2007), wages will no
longer be equal to the marginal productivity of labor since firms will apply a markup over the
marginal cost which is influenced by the business-cycle, competition regulations and entry costs.
Let 𝜀 be the product demand elasticity4, then prices will be set as described by (4):
𝑃𝑖= 1 + 𝜀𝜀 𝑀𝑃𝐿 = 𝜇𝑤 𝑀𝑃𝐿 (4)𝑤
From (4) we have that the labor share under imperfect competition will be equal to:
𝑠𝐿,𝐼𝐶 = 𝜇 𝛽1 (𝐵𝑘)−𝛾 = 𝛽𝜇(𝐵𝑘) 𝜎−1
𝜎 (5)
4𝜇 = 𝜀
1+𝜀 The price-markup reflects the degree of competition in the market. The more competition, the lower the
Under a Cobb-Douglas framework with σ=1, the labor share will be equal to 𝛽
𝜇. Within a perfect
competition background there will be no markup on prices (𝜇 = 1), since demand will be fully
elastic. Thus the labor share will be equal to β - its equilibrium level (just as forecasted by theory).
The presence of adjustment costs also impacts the labor share behavior (Arpaia et al, 2009). If the
labor share is above its long-run level there will be downward pressure on the wage bill. High
hiring and firing costs (like in Europe), or even higher labor taxes, prevent a quicker adjustment
towards the equilibrium labor share level. This happens since firms will set wages bellow marginal
productivity of labor, signaling an insurance premium. Thus, if real wages are not flexible
downwards, the unemployment may surge due to misalignments between wages and productivity.
Take C5 as an insurance premium proportional to wage. In this analysis no capital adjustment costs
were considered. Assuming also an imperfect product market, firms will set real wages equal to:
𝑤𝑃 =(1 + 𝑐)𝜇 𝑀𝑃𝐿 (6)1
The first order conditions maximization will lead to the following labor share:
𝑠𝐿,𝐼𝐶,𝐴 =𝑤𝐿𝑃𝑌 =(1+𝑐)𝜇𝑌𝑀𝑃𝐿×𝐿 = (1+𝑐)𝜇1 𝛽(𝐵𝑘)−𝛾 =(1+𝑐)𝜇𝛽 (𝐵𝑘)
𝜎−1
𝜎 (7)
With no adjustment costs and a fully elastic demand (perfect competition), labor share will be equal
to (3). The increase in adjustment costs will nonetheless lessening the labor share since rigidities
are introduced in the labor market.
As discussed previously, in the medium-run, markets might not be competitive since changes in
the relative bargaining power of workers are likely to affect the long-run relation. This effect is
obviously larger in European countries where unions play a pivotal role, leading to a higher workers
bargaining power. In fact, Schneider (2011) shows that changes in the bargaining power will
change the SK relation, impairing labor share. Let δ be the relative workers bargaining power. Assuming that firms and workers determine both wage and employment levels under an efficient
bargaining framework6 then real wages will be equal to:
𝑤𝑃 = 𝛿𝑌𝐿 + (1 − 𝛿)(1 + 𝑐)𝜇 𝑀𝑃𝐿 (8)1
If workers have all bargaining power (𝛿 = 1), then wages will be equal to 𝑌/𝐿, with no income
addressed to the remuneration of capital. If workers have no relative bargaining power, the closer
wage will be to (6). Replacing (8) in the labor share definition we reach:
𝑠𝐿,𝐼𝐶,𝐴,𝐵 = [𝛿𝑌𝐿+ (1 − 𝛿)(1+𝑐)𝜇1 𝑀𝑃𝐿]𝑌𝐿= 𝛿 + ((1+𝑐)𝜇1−𝛿 ) 𝛽(𝐵𝑘)
𝜎−1
𝜎 (9)
The previous equation describes the labor share dynamics and accounts for imperfections both in
the product and labor market (not only adjustment costs but also efficient wage bargaining).
Nevertheless, labor share dynamics are also flanked by other issues. In fact, Harisson (2005) and
Guscina (2006), show that higher economic integration – measured in terms of trade flows - lowers the labor share in developed economies, while government spending and capital controls increase
it. Bernanke (2007) has found a complementary effect between high-skilled workers and capital,
but a substitution effect amongst low-skilled workers and capital. Karanassou and Sala (2010) have
shown that the labor share is not neutral to employment suggesting that declining labor shares harms employment. This view is challenged by Bridgman (2014) that suggests that a labor’s loss
is not necessarily a capital’s gain. The declining labor share is also associated to the global rise of corporate savings as shown by Karabarbounis and Neiman (2012, 2014), and to the increase on
ICT investment (Jaumotte and Tytell, 2007).
Given the above specifications the labor share will therefore depend on several variables according
to the following functional form:
𝑠𝐿 = 𝑓(𝐵, 𝑘, 𝜇, 𝛿, 𝐶) (10)
The long-run labor share is determined according to the capital-output ratio as well as to capital
augmenting technical progress. In the medium-run, market frictions in the product and labor market
displace the labor share from its equilibrium. In the short-run the speed of adjustment towards its
long-run level depends on the magnitude of labor adjustment costs.
3.
Methodology and econometric concerns
The purpose of this research is to study the adjustment of the Labor Share and analyze the impact
of changes on real wages and employment on its adjustment. In order to accomplish this, paper
follows a three-step procedure.
Firstly the equilibrium labor share is computed given the predictions of the theoretical model
derived above. Although equation (10) identifies the main drivers of the Labor Share, in the
long-run Labor Share is expected to change only according to the variables in equation (3). In order to
account for unitary roots and to distinguish the long-run components from other medium and
short-run shocks, a Vector Error Correction model is employed:
∆𝑋𝑡 = 𝛼𝐸𝐶𝑡−1+ ∑ 𝛾𝑖∆𝑋𝑡−𝑖+ 𝑣𝑡 (11) 𝑖
Where EC is the error correction term, and X is a vector of the labor share and explanatory variables
specified by equation (3). This will allow to deal not only with the unitary roots, but also to account
for possible endogeneity concerns, such as reverse causality relations likely to occur. The OLS
estimation would not be suitable when all variables are integrated of order one since it would not
account for short run dynamics and deviations from a long-run equilibrium.
There are few studies that have used error-correction models to understand labor share dynamics.
Schneider (2011) employs an error-correction framework to discuss the long and short-run
dynamics of bargaining in the labor share. Karanassou and Sala (2010), have used an
Autoregressive distributed lag model as an alternative to the VECM approach to understand
whether labor share was neutral, or not, to employment. Azetsu (2013) also employed a VECM to
study the adjustment of wages and employment in the Japanese labor market, using the model to
estimate the optimal labor demand. Nonetheless, a common alternative to error-correction models
on studying labor share determinants is the use of instrumental variables and panel data methods
(Jaumotte and Tytell, 2007; Buch, et al. 2008; European Commission, 2007).
Prior to estimation, stationary tests were carried out (Augmented Dickey-Fuller tests are enclosed
in appendix III) and the optimal number of lags was selected – since there was evidence of the same order of integration among variables (test was performed up to a maximum of 4 lags)7.
The presence of a cointegration relation was tested following Johannsen multiple trace statistic
method (1991) which is based in the Johansen’s maximum likelihood estimator. Cointegration relations were not found in Canada, and therefore this country was dropped out from estimation.
7 The lag length was chosen arbitrarily. The optimal number of lags was chosen according to the results of the following
information criteria: final prediction error (FPE), Akaike’s (AIC), Schwarz’s Bayesian (SBIC), and the Hannan and
In Belgium and Portugal the Johansen test was inconclusive8, still estimation was pursued since
models provided a good fit. For the remaining countries one cointegration vector was found
between the three variables.
A VECM for the labor share and its long-run determinants: capital output ratio and total factor
productivity (as a proxy for capital technical progress) was estimated for a panel of 18 OECD
countries between 1970 and 2014. Since the rank is always equal to one, no additional restrictions
were imposed. All models were subjected to robustness tests which are described in appendix IV.
Seven countries exhibit not normal error terms and, despite the presence of lags, Finland and Spain
present autocorrelation in the second lag – additional lags were not incorporated in order to avoid losing more observations. Data exhibit some turbulences in the first years of the sample, which
may reflect the impact of oil shocks and other factors. Thus, whenever necessary, the sample was
restricted. In Austria, Italy, Sweden, Portugal and Norway estimation was performed from 1980 to
2014, while in Japan the estimation was carried out from 1975 to 2014.
Given the estimates, the labor share that balances the cointegration equation was derived. Since the
expected value of the long-run error term is zero, one can derive the labor share as a function of
the observed values of both capital output ratio and total factor productivity in each year:
𝑠𝐿∗𝑡 = −𝛽0 − 𝛽1(𝐾𝑌)𝑡− 𝛽2𝑇𝐹𝑃𝑡 (11)
This long-run labor share represents the level that would be required to achieve the long-run
relation given the levels of capital and productivity observed. However, in order to achieve
equilibrium, labor share does not necessarily have to be equal to the estimated level, since
equilibrium could also be reached with changes in capital and productivity. Still, as labor share is
8 The null hypothesis is always rejected suggesting that the number of cointegration relations is always larger than the
usually more volatile than its two long-run determinants, adjustments should be mainly made
through changes in the labor share. The VECM adjustment parameters estimates will assess
whether the adjustment towards the relation found is in fact made by this variable or through
changes in the long-run determinants.
With this equilibrium benchmark, the gap was computed as the division between the observed labor
share and the equilibrium one according to equation (12). A positive gap betokens a labor share
above its equilibrium level, while a negative gap means the opposite.
𝑔𝑎𝑝𝑡 = 𝑠𝐿𝑡
𝑠𝐿∗
𝑡− 1
(12)
The second step of this research aims to understand which factors determine the adjustment speed
predicted by the VECM estimated. Different countries will adjust at different speeds towards
equilibrium. The theoretical model proposed suggests that the presence of adjustment costs,
imperfect competition or efficient wage bargaining might deviate the labor share from its
fundamental level. Therefore, a cross-sectional OLS equation is employed to capture the impact of
these short and medium-run shocks in the adjustment speed towards the long-run.
𝛼𝑖 = 𝛽0+ 𝛽𝑖𝑋𝑖+ 𝜀𝑖 (13)
Let 𝛼 be the labor share adjustment parameter predicted by the VECM model and X the explanatory
variable that will capture the dynamics associated to adjustment costs, imperfect competition or
imperfect labor market. Since we are now dealing with cross-sectional data (given that for each
country we only have one adjustment parameter), we will the average value for each explanatory
variable from 2000 to 2014 as described by appendix II. The model estimated was corrected for
Finally, after computing the equilibrium and examine its adjustment speed, the third step intends
to analyze the impact of changes in real wage (price effect) and unemployment (quantity effect) on
the adjustment process. We aim to understand which variable is responsible for the adjustment, in
order to appreciate how different countries perform the predicted adjustment towards equilibrium.
Significant coefficients of explanatory variables imply that changes on those variables explain the
adjustment.
The change in gap across periods indicates whether a country’s Labor Share is adjusting towards its equilibrium or not. If the change in the absolute value of the gap is positive, a country is
diverging from its equilibrium, since the gap (in absolute terms) is increasing. In order to converge,
a country must have a negative change in the absolute value of the gap.
Although the adjustment behavior may hinge on whether a country is adjusting or diverging from
equilibrium, it may also be subject to the gap sign. The impact of real wages and unemployment
changes on the adjustment may differ if the country is above equilibrium or below it. However, the
sample is not large enough to estimate the four different cases.
Thus, we regressed the change in the gap with the change in real wage and the change in
unemployment rate, both for the cases when a country is converging and diverging. All variables
are now stationary, so OLS yields solid estimates. The models estimated were corrected for
autocorrelation and heteroscedasticity and are displayed in appendix VI.
{
∆𝑔𝑎𝑝𝑡 = 𝛽0 + 𝛽1(∆𝑤𝑃)
𝑡+ 𝛽2(∆𝑈)𝑡+ 𝜐𝑡 𝑖𝑓 ∆|𝑔𝑎𝑝𝑡| < 0 (14)
∆𝑔𝑎𝑝𝑡 = 𝛽0 + 𝛽1(∆𝑤𝑃)
𝑡+ 𝛽2(∆𝑈) 𝑡+ 𝜐𝑡 𝑖𝑓 ∆|𝑔𝑎𝑝𝑡| > 0 (15)
4.
A closer look on Labor Share data
Labor Share computation is a matter of discussion due to difficulties on estimating the income
generated by self-employed or unpaid family workers. Although several contributions to solve this
problem have already been made9, studies on labor share often ignores it. This paper uses the
adjusted labor share from AMECO which is computed as the compensation per employee over the
GDP at current market prices per unit of employment, accounting therefore for the income of the
self-employed.
Regarding labor share dynamics, figure 1 describes the pattern of the labor share in the European
Union (15 countries), the US, UK, Germany and Australia using data from 1970 until 2014. One
can observe a steady decline in the labor shares for all countries. Extending the analysis to other
countries will not affect significantly the conclusions. In fact, looking into to the constant annual
growth rate of the labor share (figure 2), one can easily check that all countries exhibit a significant
deterioration of the labor share over time, except Belgium. Countries like Portugal or Ireland have
seen their labor share decreasing by 27,64% and 24,17%, respectively, since 1970.
Figure 1: Labor Share Decline (1970-2014) Figure 2: Labor Share Constant Annual Growth Rate (1970-2014)
9The adjusted labor share attributes a proportion of proprietor’s income to wage bill (Gollin, 2002 and Freeman, 2011). This avoid measurement errors especially in countries with a high-share of self-employed workers.
50
55
60
65
70
1970 1980 1990 2000 2010
Year
EU USA
UK Australia
Germany
Labor Share 1970-2014
-. 8 -. 6 -. 4 -. 2 0 .2 C AG R
Constant Annual Labor Share Growth Rate
A U S A T BG C A N D EN EU 1 5 FI N G RE
GER IRE IRE ITA JA
P N H T N O R
PRT ESP SW
E
For the estimation, in order to capture the long-run relation, we will use the adjusted labor share
and its long run determinants predict by equation (3). The capital-output ratio was computed as the
capital stock over the GDP in market prices and total factor productivity was employed as a proxy
for capital augmenting technical progress.
The second step of the estimation was performed using the adjustment parameter for the labor share
given by the VECM and a set of variables according to equation (12). In order to capture product
market frictions, we have computed a trade openness variable (the higher the openness, the higher
should the competition level on an economy be, according to Chen et al, 2009) as the sum of exports
and imports as a percentage of GDP, and also employed the product market regulation index from
OECD. Finally we use the trade union density and employment strictness protection index to
capture labor market frictions. Adjustment costs were captured by the unemployment rate and labor
taxes (the sum of social security contributions with direct taxes as percentage of GDP).
For the last step of the estimation, we used real wages and the unemployment rate in order to
decompose the adjustment process. Variables were collected for a panel of 19 OECD countries – although Canada was dropped out from estimation. Appendix II describes the sources and data
computations with more detail.
5.
The equilibrium Labor Share
Following the methodology proposed in section 3, a VECM was estimated for the labor share (s)
and its two long-run determinants (the capital-output ratio – k - and the capital augmenting technical progress - captured by total factor productivity - TFP). VECM estimates are enclosed in
appendix IV while output and gap plots are enclosed in appendix V. As expounded previously, the
equilibrium relation may be achieved by changes in labor share, capital-output ratio and total factor
relation assuming the observed values for the two long-run determinants. However, since these
variables might also have adjustment dynamics, it is important to analyze the adjustment
parameters (Table I).
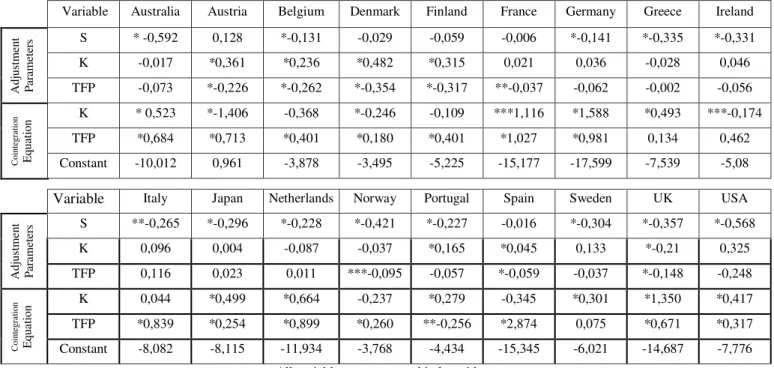
Table 1: Adjustment Parameters and Cointegration Equation Coefficients from VECM Estimates
Variable Australia Austria Belgium Denmark Finland France Germany Greece Ireland
A dj us tm ent P ar ame te
rs S * -0,592 0,128 *-0,131 -0,029 -0,059 -0,006 *-0,141 *-0,335 *-0,331
K -0,017 *0,361 *0,236 *0,482 *0,315 0,021 0,036 -0,028 0,046
TFP -0,073 *-0,226 *-0,262 *-0,354 *-0,317 **-0,037 -0,062 -0,002 -0,056
Coi nt egra ti on E qua ti on
K * 0,523 *-1,406 -0,368 *-0,246 -0,109 ***1,116 *1,588 *0,493 ***-0,174
TFP *0,684 *0,713 *0,401 *0,180 *0,401 *1,027 *0,981 0,134 0,462
Constant -10,012 0,961 -3,878 -3,495 -5,225 -15,177 -17,599 -7,539 -5,08
Variable Italy Japan Netherlands Norway Portugal Spain Sweden UK USA
A dj us tm ent P ar ame te
rs S **-0,265 *-0,296 *-0,228 *-0,421 *-0,227 -0,016 *-0,304 *-0,357 *-0,568
K 0,096 0,004 -0,087 -0,037 *0,165 *0,045 0,133 *-0,21 0,325
TFP 0,116 0,023 0,011 ***-0,095 -0,057 *-0,059 -0,037 *-0,148 -0,248
Coi nt egra ti on E qua ti on
K 0,044 *0,499 *0,664 -0,237 *0,279 -0,345 *0,301 *1,350 *0,417
TFP *0,839 *0,254 *0,899 *0,260 **-0,256 *2,874 0,075 *0,671 *0,317
Constant -8,082 -8,115 -11,934 -3,768 -4,434 -15,345 -6,021 -14,687 -7,776
All variables are expressed in logarithms
Significance levels: * 1% **5% ***10%
For Austria, Denmark, Finland, France and Spain, the labor share is not predicted to adjust and
therefore the equilibrium labor share computed might not be fully achieved through changes in
labor share. In fact, for these countries the adjustment might be accomplished with capital and
productivity fluctuations. This helps to explain the behavior of France’s and Spain’s equilibrium labor share, which exhibit unusually large gaps. This analysis is also pertinent since countries
which exhibit fast adjustment should exhibit high unemployment when their labor share is below
equilibrium, if wages are not flexible downwards.
Results suggest that, for the majority of countries, an increase in capital output ratio or in total
to increase labor share only for Portugal, while a positive response of the labor share given a shock
in capital is predicted only for Austria, Denmark and Ireland.
Australia’s, Japan’s and Italy’s labor shares are usually slightly above their predicted long-run level, Although in Australia, in the first years of the sample and during the late 80’s, the labor share was below its benchmark level. In Japan, since 2008, the labor share has always been close to
equilibrium both with positive and negative gaps.
The opposite situation is verified for Belgium, Ireland, Germany and the Netherlands. Historically,
Belgium’sand Germany’s labor shares have always been close, but below, their equilibrium level. However, since 2000, labor shares have been converging towards equilibrium. On the other hand,
since the financial 2008 crisis, Finland’s and Ireland’s labor shares have been above equilibrium. The Netherlands exhibit a cyclical behavior, although its labor share is usually below equilibrium.
Still, since 2008, this gap became positive. Greece’s, Norway’s, Sweden’s, the UK’sand USA’s labor shares evolve cyclically around their long-run level exhibiting several convergence and
divergence processes, although their gap relative to equilibrium have always been small.
In the beginning of the 80’s, Portugal’s labor share has been significantly above equilibrium (about 10 percentage points). This result may be attributed to the return of Portuguese people from the
ex-colonies as well as to substantial wage increases experienced after the 1974 revolution. These two
factors are likely to have increased pressure on the wage bill leading to a higher labor share.
However, the gap was corrected in the last years of the decade. From 1990 onwards the labor share
has been close to equilibrium levels although slightly above it. The situation has changed recently.
In fact, since 2010 the labor share is now below its equilibrium level suggesting that, given the
capital-output ration and productivity levels observed, the wage bill (wages and employment)
6.
The adjustment speed towards equilibrium
The previous section describes the long-run equilibrium level for the labor share. Each country
exhibit a specific performance on adjusting its labor share to the predicted long-run level. This
volatility around equilibrium depends on the magnitude of the labor share adjustment coefficient
estimated. The adjustment coefficients on each VECM equation allows one to understand at what
speed each variable, and specifically the labor share, adjusts to the equilibrium relation found.
Equation (10) suggests that imperfections both in product and labor market, as well as adjustment
costs, may put the Labor Share off its long-run level. Therefore, those factors are likely to affect
the speed at which each country’s labor share converges to its fundamental level.
Equation (12) is estimated given the specifications and variables discussed on previous sections.
We have used an employment protection index as well as the trade union density variable to capture
imperfections in the labor market. Product market imperfections were captured by both product
market regulation index and trade openness, while adjustment costs were captured by both the
unemployment rate and labor taxes (which include social security contributions).
There is evidence that employment protection and labor taxes are individually statistically
significant on explaining the adjustment speed. Results however do not hold when additional
variables are included in the regression. Trade union density, trade openness, product market
regulation and unemployment rate, fail to explain different adjustment speed among countries.
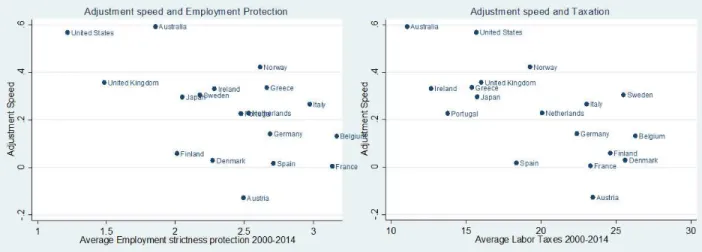
Countries such as France, Denmark, Austria or Spain present not only a highly protective labor
market legislation but also an adjustment coefficient not statistically different from zero, meaning
that the labor share does not adjust towards its equilibrium. On the other hand, countries like the
following, and at the same time exhibit a more flexible labor market when compared to other OECD
countries.
Table 2: Individual regressions of the labor share adjustment parameter on a set of explanatory variables
Explanatory Variable
Employment Protection
Unemployment
Rate Labor Taxes Union Power
Product Market
Regulation Trade
Coefficient -0,2034543* -0,01136973 -0,0262303* -0,001598 -0,1563607 -0,1467186
(0,0580806) (-1,01) (-3,78) (-0,75) (-0,85) (-1,21)
Constant -0,7161961* 0,3378853* 0,7454153* 0,2864539* 0,4847889* 0,344947*
(4,88) (2,64) (5,39) (2,92) (1,59) (3,20)
R2 0,3013 0,0517 0,4367 0,0302 0,0430 0,0853
Prob > F 0,0029 0,3288 0,0016 0,4633 0,4061 0,2445
Observations 18 18 18 18 18 18
Significance levels: * 1% **5% ***10%
Dependent Variable: VECM Labor Share Adjustment parameter Robust Standard Errors - t-statistics in brackets
Similar conclusions may be derived by looking to the relation between the adjustment speed of the
labor share and labor taxes. In fact, the higher the labor taxes (direct taxes on payroll and social
security contributions), the less a country fine-tunes towards equilibrium.
Figure 3: Adjustment Speed and Employment Protection Figure 4: Adjustment Speed and Labor Taxes
Estimates show that one point increase in the employment protection strictness index will decrease
percentage point in labor taxes (as percentage of GDP) decreases the adjustment speed by almost
2.6 percentage points.
Results are in line with economic intuition and with model predictions, while having significant
policy implications since higher regulation in the labor market is likely to prevent a quicker labor
share adjustment towards its fundamental level.
7.
The adjustment process: wages versus employment
This section aims to study which component of the labor share is responsible for the adjustment.
As explained above, the labor share is equal to real wages times the inverse of labor productivity.
This decomposition allow us to decompose the adjustment towards the long-run level estimated in
terms of changes in real wages (capturing a price effect) and changes in unemployment (capturing
a quantity effect). Changes in GDP are considered to be exogenous.
Equation (14) and (15) target to explain the speed at which a country converges or diverges,
respectively, with changes in real wage and in unemployment. A positive change in real wage
means that nominal wage has increased or price has decreased. By the same token, a positive
change in unemployment rate means that employment has decreased – assuming a constant labor force. Besides these two adjustment variables, labor share is also changing with GDP changes.
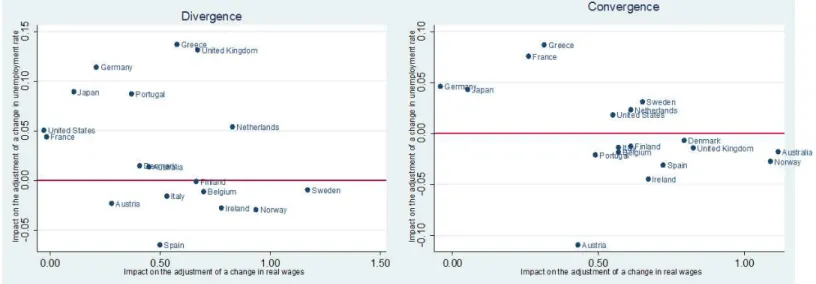
Results are enclosed in appendix VI. The behavior of countries is significantly different depending
on whether a country is converging or diverging from its long-run equilibrium. The following
figures represent the impact of real wages or unemployment changes in the adjustment process,
both when a county is diverging and converging.
A positive change in real wages is expected to increase the speed at which a country converges or
the adjustment process at all – suggesting that the adjustment is made through employment changes or through exogenous shocks (changes in GDP). Similarly, when the USA and France are diverging
from equilibrium, real wages are not expected to influence the adjustment, since its coefficient is
not statistically different from zero. Although several countries should exhibit a nominal wage
downwards rigidity, increases of the nominal wage below inflation will decrease the real wages.
This mechanism may help to explain why most countries adjustment is significantly explained with
changes in real wages.
Figure 5: Impact of real wages and unemployment rate changes in a diverging and converging adjustment path.
The impact of the unemployment rate in the adjustment depends on countries. When Australia,
Austria, Belgium, Finland, France, Ireland, Italy and Sweden are diverging, changes in
employment are not expected to affect the adjustment. This advocates that the labor share
adjustment in these countries is made through real wage changes or even external shocks. For
Austria, Belgium, Ireland and Norway an increase in the unemployment rate change is expected to
decrease the speed at which countries converge. Conversely, for France, Germany, the Netherlands
and the USA, an increase in the unemployment rate change is expected to increase convergence
Results suggest that most countries adjustment process is made through changes in real wages
instead of changes in employment. This result implies that some unemployment may be avoided
when the labor share is below equilibrium since real wages adjust. Furthermore, when labor share
is above equilibrium, employment increases will be partially crowded out by wage changes.
8.
What have we learned about the Labor Share Adjustment?
This paper analyzes the Labor Share adjustment process. A cointegration relation between the labor
share, capital-output ratio and total factor productivity was found. From this result the labor share
that would balance this relation, given the values observed for the remaining variables, was
computed. The estimation indicates that, for the vast majority of countries, labor share declines
with increasing capital-output ratio and total factor productivity – which helps to explain the global declining labor share trend (since both capital-output ratio and total factor productivity tend to
increase over time).
Most countries adjust towards the long-run relation through changes in the labor share. This is not
the case for Austria, Denmark, Finland, France and Spain, which adjust with changes in the two
long-run determinants (capital-output ratio and total factor productivity).
Different countries’ labor shares are predicted to adjust at different speeds towards the long-run relation. This adjustment speed increases with less labor taxes (personal income tax and social
security contributions) and with less employment protection strictness. The USA, the UK and
Australia are countries that adjust quickly towards equilibrium and exhibit lower labor taxes as
well as a low employment protection legislation index. A fast adjustment implies however higher
Finally, we study the adjustment of the labor share in terms of changes in real wages and changes
in unemployment in order to capture a price/quantity effect and to understand which variable is
responsible for the adjustment analyzed in the previous sections. A positive change in real wages
is expected to increase the speed at which a country converges or diverges. Additionally when
Austria, Germany and Japan are converging ,the adjustment process is not made through real
wages. The same situation is verified for those countries as well as for the USA and France, when
diverging. On these countries, the adjustment is solely made through changes in employment
suggesting that wage rigidities will harm employment during adjustment.
On the other hand, for several countries, the adjustment is not explained in terms of employment
changes. Changes in employment may have different effects on the speed of adjustment depending
on countries. Results suggest that most countries adjust with real wage changes instead of through
employment changes. This implies that, when the labor share is above equilibrium, wage
moderation policies – nominal wage increases below inflation - may be driving the adjustment of the labor share, protecting employment.
It would be interesting to further analyze the existence of a benchmark labor share using sectorial
data in order to understand whether our results are different depending on workers skill level (since
a complementary relation between high skilled workers and capital is observed, while low skilled
workers tend to be seen as substitutes to capital). Additionally, extending the sample or using
quarterly data, would allow one to study the adjustment in terms of employment and real wage
changes, not only for converging and diverging situations but also for positive and negative gaps
scenarios, overcoming the current data restrictions. Finally, results suggest that, for some countries,
the labor share behavior has changed since the 2008 financial crisis. It would be useful to further
9.
Bibliography
Acemoglu, Daron.2000. “Labor and CapitalAugmenting Technical Change.” NBER Working Paper 7544.
Arpaia, Alfonso, P Esther, Karl Pichelmann. 2009. “Understanding Labor Income Share dynamics in
Europe.” European Commission – Economic Papers, 379.
Azetsu, Kenji, Junya Masuda. 2013. “The wage and employment adjustment process in the Japanese
Labor Market: A VECM approach.” Chukyo University of Economics Discussion Paper Series 1208.
Bassanini, Andrea, Romain Duval. 2006. “Employment Patterns in OECD Countries.” OECD
Employment and Migration Working Papers 35.
Bental, Benjamin, Dominique Demougin.2006. “Institutions, Bargaining Power and Labor Shares.” SFB
649 Discussion paper 2006-009.
Bentolila, Samuel, Gilles Saint-Paul.2003. “Explaining Movements in the Labor Share.”The BE Journal
of Macroeconomics, Volume 3 Issue 1 October 2003.
Bernanke, Ben. 2007. ‘The level and distribution of economic well-being.’ Greater Omaha Chamber of
Commerce, Omaha, Nebraska on 6 February
Blanchard, Olivier J., William D. Nordhaus, and Edmund S. Phelps. 1997. “The Medium Run.”
Brookings Papers on Economic Activity 1997.2.
Blanchard, Olivier.1998. “Revisiting European Unemployment: unemployment, capital accumulation and
factor prices.” NBER Working Paper Series 6566.
Bridgman, Benjamin.2014. “Is Labor’s Loss Capital’s Gain ? Gross versus Net Labor Shares.” Bureau of
Economic Analysis WP 2014-204
Buch, Claudia M, Paola Monti, Farid Toubal.2008. “Trade’s Impact on the Labor Share: Evidence from
German and Italian Regions.” IAW-Diskussionspapiere 46.
Chen, Natalie, Jean Imbs, Andrew Scott. 2009. "The dynamics of trade and competition." Journal of
Dickey, David A., Wayne A. Fuller. 1981. “Likelihood ratio statistics for autoregressive time series with a
unit root." Econometrica: Journal of the Econometric Society: 1057-1072.
Diwan, Ishac.1999. “Labor Shares and Financial Crises.” World Bank, Washington, DC. Mimeo.
Elsby, Michael W L, Bart Hobijn.2013. “The Decline of the U.S. Labor Share.” Federal Reserve Bank
of San Francisco Working Paper 2013-27.
Enders, Walter. 2004. Applied Econometric Time Series. Wiley.
European Commission.2007. “The Labour Income Share in the EU.” In Employment in Europe, Ch. 5.
Freeman, Rebecca A. 2011. “Accounting for the Self-Employed in Labour Share Estimates.” OECD
Science, Technology and Industry Working Papers 2011/04.
Gollin, Douglas.2002. “Getting Income Shares Right.” Journal of Political Economy 110-2 p458-474.
Gunes, Sahabettin. 2007. “Functional Income Distribution in Turkey : A Cointegration and VECM
Analysis.” Journal of Economic and Social Research, 9(2), 23-36.
Guscina, Anastasia. 2006. “Effects of globalization on labor's share in national income.” International
Monetary Fund, Working Paper 06/294.
Harrison, Ann. 2005. "Has globalization eroded labor’s share? Some cross-country evidence." MPRA
paper 39649
Jaumotte, Florence, Irina Tytell. 2007. “How Has The Globalization of Labor Affected the Labor Income
Share in Advanced Countries?” IMF Working Papers/07/298.
Johansen, Søren. 1991. "Estimation and hypothesis testing of cointegration vectors in Gaussian vector
autoregressive models." Econometrica: Journal of the Econometric Society: 1551-1580.
Josheski, Dushko, Darko Lazarov, Cane Koteski. 2011. “Cobb-Douglas production function revisited,
VAR and VECM analysis and a note on Fischer/Cobb-Douglas paradox.” MPRA paper 33576.
Kaldor, Nicholas. 1961. Capital accumulation and economic growth. Macmillan.
Karabarbounis, Loukas, Brent Neiman. 2012. “Declining Labor Shares and the Global Rise of Corporate
Karabarbounis, Loukas, Brent Neiman. 2014. “The Global Decline of the Labor Share.” Quarterly
Journal of Economics, 61-103.
Karanassou, Marika, Hector Sala. 2010. “The Wage-Productivity Gap Revisited.” Universitá Autónoma
de Barcelona Departament D’Economia Aplicada – Document de Treball 10.06.
Kessing, Sebastian. 2002. “A note on the determinants of labour share Movements.” WZB Discussion
Paper, No. FS IV 02-30.
Krämer, Hagen. 2010. “The alleged stability of the labour share of income in macroeconomic theories of
income distribution.” Macroeconomic Policy Institute Working Paper 11/2010.
Krolzig, Hans-martin, Massimiliano Marcellino, Grayham E. Mizon. 2000. “Markov–Switching
VECM of the UK Labour Market.” In Advances in Markov-Switching Models pp 91-112.
Magnani, Marco.2009. “Labor Share Dynamics: A Survey of the Theory.” Parma University Economics
Department Working Papers 2009-EP07.
Ordóñez, Javier, Hector Sala, José Silva.2010. “Oil Price Shocks and Labor Market Fluctuations.” The
Energy Journal, 32 (5096): 1–32.
Prasad, Eswar, Michael Keane. 1991. “The Employment and Wage Effects of Oil Price Shocks: A
Sectoral Analysis.” Federal Reserve Bank of Minneapolis Discussion Paper 51.
Rodriguez, Francisco, Arjun Jayadev. 2010. “The declining Labor Share of Income.” United Nations
Development Programme – Research Paper 2010/36.
Schneider, Dorothee. 2011. “Bargaining, Openness, and the Labor Share.” SFB 649 Economic Risk
Discussion Paper 2011-068.
Schneider, Dorothee. 2011. “Monitoring, Information Technology and the Labor Share.” SFB 649
Economic Risk Discussion Paper 2011-066.
Schneider, Dorothee.2011. “The Labor Share : A Review of Theory and Evidence.” SFB 649 Economic
Risk Discussion Paper 2011-069.
Stockhammer, Engelbert. 2013. “Why Have Wage Shares Fallen?” International Labour Office: