Original Article
Artigo Original
Ariane Damasceno Pellicani1 Hilton Marcos Alves Ricz2 Lilian Neto Aguiar Ricz2
Descritores
Voz Fadiga Mulheres Disfonia Esforço
Keywords
Voice Fatigue Woman Dysphonia Effort
Correspondence address: Ariane Damasceno Pellicani
Universidade Federal de Sergipe, campus Lagarto Rua Padre Álvares Pitangueira, 248, Lagarto (SE), Brasil, CEP: 49100-000. E-mail: [email protected] Received: 11/18/2014
Accepted: 04/22/2015
Study carried out at the School of Medicine of Ribeirão Preto, Universidade de São Paulo – USP – Ribeirão Preto (SP), Brazil.
(1) Speech-Language Pathology and Audiology Department, Universidade Federal de Sergipe, Campus Lagarto – UFSE – Largato (SE), Brasil.
(2) Department of Ophthalmology, Otorhinolaryngology and Head and Neck Surgery, School of Medicine of Ribeirão Preto, Universidade de São Paulo – USP – Ribeirão Preto (SP), Brazil.
Conlict of interests: nothing to declare.
Phonatory function after prolonged
voice use in brazilian woman
Função fonatória após o uso prolongado
da voz em mulheres brasileiras
ABSTRACT
Objectives: To evaluate the behavior of the phonatory function and the perceived strain in Brazilian young women, before and after a test of prolonged voice use test, for a period of one continuous hour. Methods: Twenty young women without laryngeal disorders participated in the study and were submitted to vocal acoustic analysis (MDVP-Advanced, CSL-Kay Pentax®), perceptual voice assessment, carried out by ive judges, and the measurement of speech–strain level using a visual analog scale before and after a prolonged use of the voice, from the reading of a standardized text for one hour in usual vocal intensity and frequency, without breaks for hydration or vocal rest. The description and comparison between the variables and the appropriate statistical analysis were carried out. Results: The acoustic parameters of fundamental (f0) and low frequency (Flo) of the emission increased after 1 hour of voice use, while the values for the amplitude tremor intensity index (Atri), amplitude variation (vAm), noise-to-harmonic ratio (NHR), and soft phonation index (SPI) were reduced after the prolonged voice use test. The judges agreed with the decrease in the overall level of dysphonia (kappa=0.66), roughness (kappa=0.59), and vocal breathiness (kappa=0.73); increased phonatory stability (kappa=0.64); vocal projection (kappa=0.48); pitch (kappa=0.74); and loudness (kappa=0.65). The phonatory strain increased signiicantly after the test (p=0.003). Conclusion: One hour of prolonged voice use seems to favor laryngeal adaptation and increased adductor muscle activity to maintain vocal eficiency. However, the self-perception of vocal strain is evident and can be understood as a sign of muscle fatigue caused by continuous use.
RESUMO
INTRODUCTION
Prolonged voice use has been employed in the literature as a method to evaluate and understand the laryngeal adjustments and the negative consequences that can result from vocal fati-gue(1). The tests used to induce vocal fatigue in experimental media are not consensual and may vary from 15 minutes(2) to 2 hours(3,4), or more, of continuous voice use in regular or pre-determined intensity, with normal or symptomatic individuals, with or without a vocal training and technique. The continuous voice use for long periods, especially in teachers and telemar-keters, has been studied owing to the high frequency of com-plaints of vocal tiredness and fatigue caused by these types of activity, which may result in functional dysphonia or organic changes in the larynx.
Therefore, vocal fatigue is usually described as the result of phonotraumatic voice use, with prolonged use and in high vocal intensity, and the most common signs and symptoms are hoarseness, breathiness, loss of vocal power and of phonatory extension, dificulty in performing high-pitched sounds, sen-sations such as burning and pain during phonation, pain when swallowing, dryness in the larynx and pharynx, increased throat clearing, and coughing(4).
Such symptoms are described in various laryngeal disea-ses such as in nodular lesions. Studies show that changes in the basal membrane result from repetitive abusive impacts(5). These abuses may be associated with prolonged voice use at an average to high intensity, common in teachers. There is a clear predisposition of women to the development of vocal pro-blems in a 2/1 ratio compared with men(6) and a higher preva-lence of vocal symptoms in women/teachers with educational activities similar to men(7).
Despite the extensive description of vocal fatigue symptoms associated with prolonged voice use, there is no precise dei-nition for its etiology. Vocal fatigue is deined as an increased strain for phonation followed by a decrease in phonatory skills(8), showing an intimate relationship with vocal hyperfunction and a self-report of increased sensation of strain in prolonged voice use(9). In addition, the existence of the involvement of neuro-muscular fatigue, increased viscosity of the vocal fold, reduc-tion of blood circulareduc-tion, stress of nonmuscle tissues, such as the epithelium and the lamina propria, vocal ligaments, and cartilage, and the fatigue of the respiratory muscles are also related to voice fatigue(1).
The level of hydration of vocal folds seems to be a major factor that can cause a greater strain on the laryngeal muscles during prolonged voice use and, thus, generate fatigue(10-13). However, the phonation threshold pressure is the objective measure that presents a greater sensitivity to represent vocal fatigue(14). According to Verdolini, Titze, and Fennel(13), increa-ses in the strain felt during phonation and phonation thre-shold pressure measures are dependent on the hydration level to which the individual is exposed. Hemler et al.(15), despite having used dissected sheep larynxes, also observed changes in the mechanical parameters of the vocal folds mucosa and found increased viscosity of the mucosa, when subjected to low relative humidity.
Another important aspect is the amount of hyaluronic acid present in the extracellular matrix of the lamina propria of the vocal fold mucosa, because it has the function of attracting and regulating the entry of water molecules, which changes the biomechanical properties of viscosity and elasticity(16-18). Because they are susceptible to the symptoms observed when prolonged voice use occurs, leading to vocal fatigue, the lower concentration of hyaluronic acid in women could be a possible explanation to the female predisposition to vocal and laryn-geal diseases(16).
Sander and Ripich(19) reported the possibility of com-pensatory adjustments, in which the frequency of speech would be the most important factor for vocal fatigue, while other studies also consider compensatory adjustments and increased laryngeal adductor muscle activity in prolonged voice use tasks(10,12,19-22). However, for believing in a muscu-lar manifestation, they understand that vocal fatigue should be studied by laryngeal electromyography(21,23,24). These stu-dies point to changes in the spectral behavior of laryngeal electromyography of the cricoarytenoid muscle after intense voice use tasks.
Regardless of the etiology approach, objective measures of vocal assessment, except for the phonation threshold pres-sure, have not shown sensitivity or similarity in indings bet-ween studies in the literature. There are no descriptions on the Brazilian population regarding the speech behavior of young women without vocal alterations or voice professionals.
Therefore, this study aims to evaluate the behavior of phona-tion and the perceived strain in young, healthy Brazilian women without vocal problems, and who are not voice professionals, before and after prolonged voice use tests for one continuous hour, without breaks for hydration or vocal rest.
METHODS
This is a prospective study approved by the Research Ethics Committee of Hospital das Clínias of Faculdade de Medicina de Ribeirão Preto, Universidade de São Paulo, protocol no. 12101/2006.
The sample consisted of 20 female subjects, aged between 18 and 35 years (mean 22.0 years), who were in the vocal efi-ciency period for the development of vocal resistance activity and who had no history of previous dysphonia, professional use of voice, vocal training, or sports, and leisure activities that characterize continuous voice use. Women diagnosed with gastroesophageal relux disease, hormonal changes, allergies, respiratory diseases, and hearing, neurological, or psychiatric disorders were prevented from participating. Smokers, drug users, and users of continuous medications such as antihista-mines, antidepressants, antihypertensives, hypoglycemics, and anti-inlammatories were excluded.
involving questions divided in blocks — social and professio-nal use of voice, vocal health habits, history of dysphonia, and medical diagnostics with direct or indirect action on the voice.
After the selection of the sample, the evaluation date was scheduled beforehand, in order to avoid coinciding with the menstrual period, insomnia, respiratory infections, use of alcohol the day before, and overuse of caffeine. If the partici-pant attended presenting any of these complications, they were not allowed to continue in the study.
The evaluations were scheduled in the morning in a room with acoustic treatment and monitoring of the temperature (mean 26.5ºC) and relative humidity (mean 86%), where the capture of vocal recordings of perceived vocal strain and the performance of the prolonged voice use test took place. No vocal warm-up exercises were performed before the test.
The capture of voice recordings was performed on the pre- and posttest moments of continuous speech, using a unidirec-tional microphone positioned at 45° and 4 cm away from the participant’s labial commissure. The participants were asked to produce the vowel /a/ for at least 4 seconds, in usual vocal intensity and frequency, favoring both the collection of acous-tic measures and the perceptual evaluation.
The measurement of vocal intensity was performed using a digital sound pressure level meter positioned 1 m away from the participant’s lips and collected through the emission of the vowel /a/ sustained before and after the vocal use and at the end of the continuous speech test.
To collect the perceived strain level that the participant went through when phonating, they were requested to produce the prolonged vowel /a/ and count numbers in order to recognize any negative signs and symptoms regarding voice production. Then, they were asked to grade the strain through a visual analog scale of 100 mm, whose extremes were classiied as “absence” and “extreme” strain, which was applied before and after the prolonged voice use test.
After the recording of voice samples and the data collection of the vocal intensity and vocal strain, the prolonged voice use test began. The participants were asked to position themselves sitting comfortably in a chair and to start the prolonged voice use test. In order to standardize the emission of participants’ speeches, it was proposed that the reading of a previously pre-pared text, which addressed vocal health and hygiene, should be performed in usual vocal frequency and intensity. This text should be read repeatedly for an hour, without breaks for hydra-tion or vocal rest.
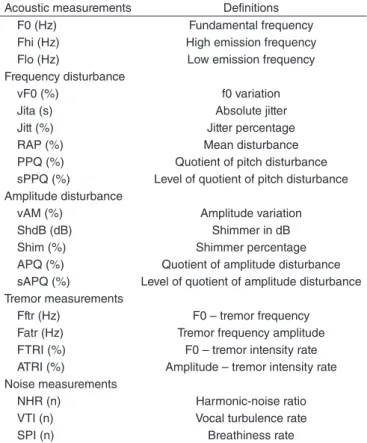
For the computerized acoustic analysis of the records, the software used were Advanced Multi-Dimensional Voice Program (MDVP-Adv) and Computerized Speech Lab(CSL), Model 6103, by Kay Pentax®. Acoustic parameters before and after prolonged voice use test, related to the fundamental fre-quency (f0), were extracted, along with frefre-quency disturbance, amplitude disturbance, and tremor and noise measurements, as described in Table 1.
Data from the capture of vocal recordings for acoustic analy-sis were used for further perceptual analyanaly-sis, carried out by ive speech-language pathologist judges, with an average clinical experience of 7.43 years in the ield of voice.
As an analytical tool, the GRBASI 4-point scale was used: 0=absent/normal; 1=mild; 2=moderate; 3=severe, and which assesses the overall grade of dysphonia (G), the roughness (R), breathiness (B), asthenia (A), phonation strain (S), and instability (I).
To complete the evaluation, the vocal projection parameters were added: pitch, loudness, and phonation stability. The analy-sis of these parameters was carried out in a comparative way between the time pre- and posttest. The judges were reques-ted to evaluate if there was an “increase” or “decrease” or if it was “unchanged,” between measurements for pre- and posttest emissions. The parameter pitch also used this form of analy-sis and should be classiied as increase and decrease, whene-ver the voice was high or low pitched, respectively, in relation to the posttest continuous speech moment. This assessment provided the origin of the analyzed emission.
Initially, the objectives of the study and the descriptions of each variable used were presented to the judges, for instruction and calibration of the evaluators. To this end, each judge was given a form containing a description of each parameter to be analyzed and discussed item by item, so that all of them could have a uniform understanding of the concept. All judges were given an informed consent form, regarding the entire analysis process: the participation in the study occurred voluntarily, free of charge, or need for authorship in the article.
Initially, training was conducted, with the submission of pre- and posttest voices samples from 5 participants, chosen and presented at random by the researcher, a procedure that lasted approximately 60 minutes.
Table 1. Acoustic parameters assessed before and after prolonged voice use. Acoustic measurements Definitions
F0 (Hz) Fundamental frequency
Fhi (Hz) High emission frequency
Flo (Hz) Low emission frequency
Frequency disturbance
vF0 (%) f0 variation
Jita (s) Absolute jitter
Jitt (%) Jitter percentage
RAP (%) Mean disturbance
PPQ (%) Quotient of pitch disturbance sPPQ (%) Level of quotient of pitch disturbance Amplitude disturbance
vAM (%) Amplitude variation
ShdB (dB) Shimmer in dB
Shim (%) Shimmer percentage
APQ (%) Quotient of amplitude disturbance sAPQ (%) Level of quotient of amplitude disturbance Tremor measurements
Fftr (Hz) F0 – tremor frequency
Fatr (Hz) Tremor frequency amplitude
FTRI (%) F0 – tremor intensity rate ATRI (%) Amplitude – tremor intensity rate Noise measurements
NHR (n) Harmonic-noise ratio
VTI (n) Vocal turbulence rate
After training, the judges started the analysis of voice sam-ples. The room was acoustically treated and the presentation of the voices was done by the researcher through a personal com-puter and speakers positioned close to the evaluators. Loudness was adjusted comfortably to the judges and kept stable until the end of the analysis.
Each judge was given an answer card and a sheet with the description of each parameter being evaluated, to be used if needed. Judges should analyze the sample of each individual separately, starting with the pretest sample and comparing it with the posttest sample, in order to establish the sample obtained before the continuous speech test as a reference for the voice sample obtained after 1 hour of reading. Repetition was accepted, as many times as necessary, aiming at the cor-rect appraisal by experts.
The comparison between the variables of the acoustic measurements of before and after prolonged voice use test, such as vocal intensity and level of strain, was performed by applying the Wilcoxon test for dependent samples, considering the median between the two groups that showed to be depen-dent on each other.
The intra- and interjudges comparison of the perceptual analysis variables was performed using the kappa coeficient (k), which indicates the extent of the probability of agreement, which is more perfect when the coeficient is close to 1, its maximum value. In this study, only the results whose kappa coeficient was equal to or greater than 0.41 were considered.
For the correlation between the acoustic variables, audi-tory perception, vocal intensity, and speech strain, Spearman’s nonparametric correlation coeficient was applied.
The signiicance level (p), for rejection of the nullity hypo-thesis, using the test, in all calculations described earlier, was always set at a value equal to or lower than 0.05 (5%).
RESULTS
The acoustic measurements of fundamental (f0), high fre-quency (Fhi), and low frefre-quency (Flo), the frefre-quency and ampli-tude disturbance, the tremor, and noise measurements obtained in the pre- and posttest are shown in Table 2.
Vocal intensity showed medians of 62 and 63.4 Db NPS in pre- and posttest moments, respectively, showing no sig-niicant results for changes in prolonged voice use (p=0.19). Of the total participants, 45% of them showed a slight increase in absolute terms, 30% a slight decrease, and 25% no change in the intensity values.
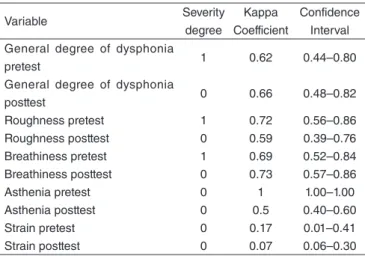
The data obtained from the perceptual evaluation variables, their respective kappa coeficients, and conidence intervals are listed in Table 3. The degree of agreement of the judges remai-ned above 0.41, considered moderate, and the overall degree of dysphonia pre- and posttest, roughness pretest, breathiness pre- and posttest, and vocal stability presented a degree of agreement classiied as “substantially large”; vocal projection and asthenia posttest has “almost perfect” agreement. Pre- and posttest strain parameters were discarded, because they obtained a degree of agreement below 0.41, being classiied as insignii-cant to the study. Thus, the analysis of the judges agreed on the
Table 2. Comparison of acoustic variables measured pre- and post-prolonged voice use test.
Acoustic
measurements
Pre-Standard Deviation
Post-Standard Deviation p-value
F0 (Hz) 197.551 21.289 215.0235 22.63 0.03*
Fhi (Hz) 205.072 23.883 224.2755 25.029 0.06
Flo (Hz) 190.891 20.539 205.425 21.313 0.02*
Frequency disturbance
vF0 (%) 1.182 0.44 1.1685 0.649 0.63
Jita (s) 58.5155 29.003 56.7715 33.93 0.63
Jitt (%) 1.106 0.593 1.141 0.714 0.9
RAP (%) 0.671 0.365 0.6925 0.431 0.9
PPQ (%) 0.6425 0.353 0.6825 0.42 0.78
sPPQ (%) 0.694 0.35 0.7125 0.43 0.98
Amplitude disturbance
vAM (%) 11.405 5.159 9.6475 3.851 0.03*
ShdB (dB) 0.197 0.069 0.1745 0.53 0.64
Shim (%) 2.2645 0.765 1.993 0.617 0.72
APQ (%) 1.571 0.493 1.408 0.395 0.84
sAPQ (%) 2.656 2.354 0.876 0.31
Tremor measurements
Fftr (Hz) 2.287 2.531 2.299 3.055 0.71
Fatr (Hz) 0 2.015 0 1.76 0.12
FTRI (%) 0.2795 0.845 0.25 0.236 0.1
ATRI (%) 0 3.26 0 1.208 0.01*
Noise measurements
NHR (n) 0.138 0.024 0.1105 0.028 0.01*
VTI (n) 0.039 0.01 0.0425 0.023 0.1
SPI (n) 16.96 8.125 9.951 7.457 <0.001*
Test used: Wilcoxon’s.
*statistically significant for p≤0.05
Table 3. Dysphonia severity degree by the GRBAS scale, according to the evaluation and analysis of the judges.
Test used: Kappa coefficient. Values considered: k≥0.41
Variable Severity
degree
Kappa Coefficient
Confidence Interval General degree of dysphonia
pretest 1 0.62 0.44–0.80
General degree of dysphonia
posttest 0 0.66 0.48–0.82
Roughness pretest 1 0.72 0.56–0.86
Roughness posttest 0 0.59 0.39–0.76
Breathiness pretest 1 0.69 0.52–0.84
Breathiness posttest 0 0.73 0.57–0.86
Asthenia pretest 0 1 1.00–1.00
Asthenia posttest 0 0.5 0.40–0.60
Strain pretest 0 0.17 0.01–0.41
reduction of the severity of dysphonia (kappa=0.66), roughness (kappa=0.59), breathiness (kappa=0.73), and maintenance of the degree of asthenia (kappa=0.50), which was normal before and after the prolonged voice use test.
The comparison between the emissions from both moments of the study observed increased phonatory stability (kappa=0.64), vocal projection (kappa=0.48), pitch (kappa=0.74), and loud-ness (kappa=0.65), as shown in Table 4.
The measurement of speech strain by the participants before and after continuous vocal use was the variable that showed the greatest difference between the means. There was an increase of 75.07% in the values between the pre- (7.6± 11.5 mm) and
posttest moments (30.5± 23.6 mm), and the resulting p-value
was 0.003. It is noteworthy that most of the participants repor-ted increased feelings of dryness in the pharynx and/or larynx. In the sample, 23.8% of participants showed decreased fee-lings of straining, 19.0% of them did not present any manifes-tations, and 9.5% of them showed an increase in strain higher than 70 mm.
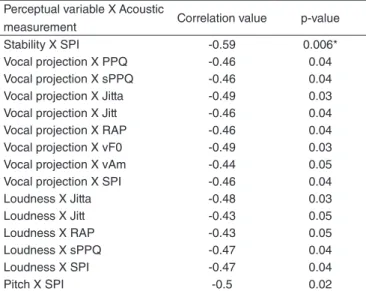
The correlations between the variables are presented in Table 5. The GRBAS parameters showed no correlation with any variable. On the other hand, the parameters such as vocal projection, phonatory stability, loudness, and pitch were
negatively correlated with the soft phonation index (SPI) and the frequency disturbance measures.
DISCUSSION
For this study, young women without laryngeal and/or vocal changes and who were not voice professionals were selected. A reading test was applied, in usual voice frequency and inten-sity, aiming at a prolonged voice use for a continuous period, in order to evaluate the behavior of laryngeal function and vocal strain in a quiet environment. The humidity and temperature were monitored, and there were no breaks for hydration, vocal rest, or previous vocal warm-up. Such conditions of the prolon-ged voice use test are different than in the occupational envi-ronment, such as a classroom. So, the study question raised was what would be the vocal behavior and speech strain in female individuals without changes or vocal training.
The f0 and Flo values showed a signiicant increase in the posttest moment, and FHi showed a strong increasing trend, which shows that even the lowest points of the emission deviated to high, which agrees with the data in the literature regarding the elevation of vocal frequency measured after a prolonged use of voice(1,4,6,10-14,25,26). Similarly, the pitch of emissions analy-zed by judges in the perceptual voice assessment also became higher in the posttest moment.
The elevation of f0 has been seen as a signiicant measure of prolonged voice use, but its increase is not always related to the occurrence of vocal fatigue. Boucher(21) found a nega-tive correlation between f0 and estimated fatigue, that is, the increase of voice frequency may be contrary to the presence of voice fatigue.
All parameters related to the fundamental frequency, fre-quency and amplitude disturbance measures, and tremor and noise measurements available in the software chosen for the measurement were investigated. There were no signiicant varia-tions in the frequency disturbance, except for the short-term and long-term amplitude variation measures (vAm), and the same was observed for the amplitude disturbance measures. The mean vAm declined in the posttest moment, suggesting reduced phonation instability.
Few studies involving vocal fatigue and disturbance measures were found, and there is still no consensus among the results. Stemple, Stanley, and Lee(4) found a reduction in jitter when a high-pitched emission was requested after 2 hours of continuous speech. On the other hand, Rantala and Vilkman(11) found increased shimmer in teachers after a day of work, and the greater the number of complaints, the greater the f0 and less are the disturbances. Both studies showed changes in some of the disturbance measures after prolonged use, equal to or longer than two continuous hours. Remacle et al.(25) reported that jitter, shimmer, and harmo-nic–noise ratio measures do not change with the vocal inten-sity. However, they found a decrease in shimmer values as a result of prolonged voice use.
In this study, absolute means of jitter and especially of shimmer showed a decrease but were not representative to the study of prolonged vocal use, which may be because these
Table 4. Degree of agreement among the judges for the variables stability, projection, loudness, and pitch when comparing the moments of the test.
Variable Kappa Coefficient Confidence interval
Stability 0.64 0.45–0.81
Projection 0.48 0.28–0.70
Loudness 0.74 0.58–0.87
Pitch 0.65 0.43–0.84
Test used: Kappa coefficient. Values considered: k≥0.41
Table 5. Correlation between acoustic variables and auditory and perceptual variables that were significant. Variables without significant correlation are not displayed.
Test used: Spearman’s Correlation; *Statistically significant for p≤0.05
Perceptual variable X Acoustic
measurement Correlation value p-value
Stability X SPI -0.59 0.006*
Vocal projection X PPQ -0.46 0.04
Vocal projection X sPPQ -0.46 0.04
Vocal projection X Jitta -0.49 0.03
Vocal projection X Jitt -0.46 0.04
Vocal projection X RAP -0.46 0.04
Vocal projection X vF0 -0.49 0.03
Vocal projection X vAm -0.44 0.05
Vocal projection X SPI -0.46 0.04
Loudness X Jitta -0.48 0.03
Loudness X Jitt -0.43 0.05
Loudness X RAP -0.43 0.05
Loudness X sPPQ -0.47 0.04
Loudness X SPI -0.47 0.04
assessments were carried out after an hour of continuous voice use in women and without monitoring of vocal intensity.
Aside from the amplitude tremor intensity index (Atri) varia-ble that presented statistical signiicance of p=0.01, other tre-mor measures showed no sensitivity to prolonged voice used. The Atri values showed a considerable decrease in the posttest moment, suggesting a possible improvement of vocal instabi-lity. In contrast, Sander and Ripich(19) analyzed acoustic mea-surements that showed correlation with vocal fatigue and found modest increase in FAtri and Fftr, which indicated the presence of a slight vocal tremor. However, the evidence used by the author did not involve prolonged voice use in usual intensity and frequency, but vocal repetition of tasks every 12–15 minu-tes within approximately 12 to 14 hours.
The acoustic measurements of noise-to-harmonic ratio (NHR) (p=0.01) and SPI (p<0.0001) showed greater sensiti-vity to the study of prolonged voice use. The reduction of the NHR demonstrates greater amount of harmonics present in the emission, and the SPI, aside from being considered a pre-ceptor of breathiness and asthenia(27), is an indicator of increa-sed glottal adduction in the posttest moment. This measure was negatively correlated with vocal projection, loudness, pitch, and especially with vocal stability. It is believed that the pro-longed phonation period used in this study has brought about increased laryngeal activity, thus favoring not only a larger glottal adduction (demonstrated by decreasing SPI) but also an improved stability in speech and other correlated percep-tual parameters.
SPI, NHR, and vocal intensity are objective measures that relect the behavior of the laryngeal muscles in relation to the aerodynamic properties of phonation. However, contrary to SPI and NHR, vocal intensity showed no signiicance to the study of prolonged voice use. Thus, the study failed in not evalua-ting the scope of vocal intensity by extracevalua-ting the minimum and maximum vocal intensity, as perhaps these measures could have presented some sensitivity or could be correlated to some perceptual and auditory variable.
Among the acoustic parameters, measures characterized as noise and frequency seem more sensitive to prolonged voice use, and it is perceived that the frequency of the mea-sures tend to increase as the noise meamea-sures tend to subside. However, acoustic measurements might not be sensitive to represent the effect of prolonged voice use for 1 hour, espe-cially for measuring normal voices with no history of pro-fessional use.
As for perceptual and auditory parameters in the GRBAS scale, there was no correlation with any other variable, including vocal strain. In this study, prolonged voice use in a continuous period showed improvement in these para-meters. The consensus among the judges showed improved overall degree of dysphonia, roughness and breathiness, and asthenia showed no change between the moments of the test. Perhaps, the time of the test was enough for the level of phonatory strain to interfere negatively in the efi-ciency of vocal production.
In contrast, other perceptual parameters, aside from having showed an increase in posttest moment, were correlated with
some acoustic variables (Table 6). However, these correlations occurred in a negative way with the SPI noise measurement, especially with the frequency disturbance measures. The study showed that the increase in vocal projection was contrary to the reduction of the frequency disturbance measures. It is believed that an appropriate source–ilter relationship is necessary for the occurrence of increase in vocal projection, a larynx with proper closure of the vocal folds, and a good harmonics pro-duction, justiied in this study by the inverse relationship bet-ween the vocal projection and the decrease in SPI and NHR, respectively, as well as a vocal tract positioned so as to facili-tate ampliication.
The results found suggest that 1 hour of prolonged voice use in normal intensity and frequency can improve the acous-tic measures of frequency and amplitude disturbance, jitter, and noise. Despite the possible improvement observed in vocal quality, some questions should be raised, for exam-ple, whether the observed improvement can be the result of vocal warm-up.
It is imperative to note that the study was conducted in the morning, with participants undergoing fasting for hydration, food, and vocal use. Therefore, there could be an accumula-tion of luid and swelling that could have been removed and balanced during the test, which may have caused the impro-vement in voice quality when comparing with the moments of test. On the other hand, this hypothesis would suggest that the effect caused by 1 hour of prolonged voice use could result in vocal warm-up, if not for the measurement of speech strain, which increased signiicantly (p=0.003), pointing to the increa-sed effort and possible vocal fatigue, as observed in other studies(1,3,4,6,7,10-14,20,28,29).
The improvement observed in vocal quality from acoustic and auditory perception measures suggests an adaptation of the laryngeal muscles to perform the requested vocal func-tion. However, the increase in sensations of strain can result in laryngeal and voice disorders, as observed in the case of teachers, where the continued use of voice at high intensi-ties, without control of external noise, points to the develop-ment of vocal problems among female and male subjects in a 2:1 ratio(6). In a study related to laryngeal morphology, Pontes et al.(30) commented that the association between muscle ten-sion and phonotraumatic use may result in changes in glot-tal coniguration, and in the case of presence of glotglot-tal gap and tension of the thyroarytenoid muscle, a concentration of vocal energy can occur in the middle third of the vocal folds in larynxes with female morphology, causing trauma to the tissue and, consequently, the formation of nodules. It is still necessary to mention that, as reported in studies related to the biomechanical properties of the mucosa of the vocal fold, the emergence of laryngeal disorders may be related to a decrea-sed presence of hyaluronic acid in the female vocal fold(16), which, in turn, presents a close relationship with the visco-sity and mucosal hydration level(18) and phonation threshold pressure, as also used in voice fatigue studies.
It is believed that there is an increased activity of laryngeal adduc-tor muscles to enable the vocal production for one continuous hour, but the negative feeling caused by speech strain sounds like a warning sign to indicate the fatigue of those muscles. These data become signiicant to the routine of a voice profes-sional, enabling interventions for prevention and promotion of vocal health. Furthermore, it is believed that there may be seve-ral compensatory adjustments inluenced by the work environ-ment, such as competitive environmental noise, emotional stress, and general fatigue.
It is believed that vocal fatigue and its effects resulting from prolonged voice use must involve not only one factor but also the possibility of combining biomechanical, aerodynamic, and acoustic factors, which not only involve the glottal level but also the behavior of resonator and articulatory cavities. No studies evaluating the behavior of the entire vocal tract as a result of prolonged voice use were found, although it is believed that this use triggers adaptation between all these systems until the level of phonatory strain, together with the onset of fatigue, causes the breakdown of this adaptation and generates consequences such as chronic vocal fatigue, vocal hypofunction, or vocal hyperfunction, and even the appea-rance of laryngeal diseases.
This study analyzed the vocal characteristics of healthy young women with normal voice, in an acoustically treated environ-ment, when subjected to prolonged voice use. The aim was to provide data on normal subjects in an ideal environment for speech, in order to contribute to the literature for future com-parisons with different populations and in different situations such as with professional voice users.
CONCLUSION
After one hour of continuous voice use, we observed an increase in acoustic frequency measures, decreased tremor and noise measures, increased phonatory stability, vocal projection, pitch, and loudness.
Self-perception of vocal strain became evidently more pronounced after one hour of continuous voice use. Increased sensation of strain to produce voice after one hour of con-tinuous reading demonstrated to be contrary to improved perceptual and acoustic parameters, which indicated voice improvement.
Therefore, one hour of prolonged voice use seems to favor laryngeal adaptation and increased adductor muscle activity to maintain eficiency in vocal production. However, the self-per-ception of vocal strain is evident and can be understood as a sign that fatigue may occur in the muscles, caused by continuous use.
*ADP participated in the project design, submission to the ethics committee, data collection and analysis, and preparation of the article; HMAR participated in the data collection and analysis, and preparation and review of the article; LNAR participated in the project design, submission to the ethics committee, data collection and analysis, and preparation of the article.
REFERENCES
1. Welham NV, Maclagan MA. Vocal fatigue: current knowledge and future directions. J Voice. 2003;17(1):21-30.
2. Linville SE. Changes in glottal coniguration in women after loud talking. J Voice. 1995;9(1):57-65.
3. Solomon NP, DiMattia MS. Effects of a vocally fatiguing task and systemic hydration on phonation threshold pressure. J Voice. 2000;14(3):341-62. 4. Stemple JC, Stanley J, Lee L. Objective measures of voice production in
normal subjects following prolonged voice use. J Voice. 1995;9(2):127-33. 5. Gray SD, Pignatari SS, Harding P. Morphologic ultrastructure of
anchoring ibers in normal vocal fold basement membrane zone. J Voice. 1994;8(1):48-52.
6. Russell A, Oates J, Greenwood KM. Prevalence of voice problems in teachers. J Voice. 1998;12(4):467-79.
7. Smith E, Kirchner HL, Taylor M, Hoffman H, Lemke JH. Voice problems among teachers: differences by gender and teaching characteristics. J Voice. 1998;12(3):328-34.
8. McCabe DJ, Titze I. Chant therapy for treating vocal fatigue among public teatchers: a preliminary study. Am J Speech Lang Pathol. 2002;11:356-69. 9. Solomon NP. Vocal fatigue and its relation to vocal hyperfunction dagger.
Int J Speech Lang Pathol. 2008;10(4):254-66.
10. Laukkanen AM, Ilomaki I, Leppanen K, Vilkman E. Acoustic measures and self-reports of vocal fatigue by female teachers. J Voice. 2008;22(3):283-9. 11. Rantala L, Vilkman E. Relationship between subjective voice
complaints and acoustic parameters in female teachers’ voices. J Voice. 1999;13(4):484-95.
12. Rantala L, Vilkman E, Bloigu R. Voice changes during work: subjective complaints and objective measurements for female primary and secondary schoolteachers. J Voice. 2002;16(3):344-55.
13. Verdolini K, Titze IR, Fennell A. Dependence of phonatory effort on hydration level. J Speech Hear Res. 1994;37(5):1001-7.
14. Chang A, Karnell MP. Perceived phonatory effort and phonation threshold pressure across a prolonged voice loading task: a study of vocal fatigue. J Voice. 2004;18(4):454-66.
15. Hemler RJ, Wieneke GH, Dejonckere PH. The effect of relative humidity of inhaled air on acoustic parameters of voice in normal subjects. J Voice. 1997;11(3):295-300.
16. Butler JE, Hammond TH, Gray SD. Gender-related differences of hyaluronic acid distribution in the human vocal fold. Laryngoscope. 2001;111(5):907-11.
17. Hammond TH, Zhou R, Hammond EH, Pawlak A, Gray SD. The intermediate layer: a morphologic study of the elastin and hyaluronic acid constituents of normal human vocal folds. J Voice. 1997;11(1):59-66. 18. Ward PD, Thibeault SL, Gray SD. Hyaluronic acid: its role in voice. J
Voice. 2002;16(3):303-9.
19. Sander EK, Ripich DE. Vocal fatigue. Ann Otol Rhinol Laryngol. 1983;92(2 Pt 1):141-5.
20. Kostyk BE, Putnam Rochet A. Laryngeal airway resistance in teachers with vocal fatigue: a preliminary study. J Voice. 1998;12(3):287-99. 21. Boucher VJ. Acoustic correlates of fatigue in laryngeal muscles: indings
for a criterion-based prevention of acquired voice pathologies. J Speech Lang Hear Res. 2008;51(5):1161-70.
22. Carroll T, Nix J, Hunter E, Emerich K, Titze I, Abaza M. Objective measurement of vocal fatigue in classical singers: a vocal dosimetry pilot study. Otolaryngol Head Neck Surg. 2006;135(4):595-602.
23. Boucher VJ, Ayad T. Physiological attributes of vocal fatigue and their acoustic effects: a synthesis of indings for a criterion-based prevention of acquired voice disorders. J Voice. 2010;24(3):324-36.
24. Boucher VJ, Ahmarani C, Ayad T. Physiologic features of vocal fatigue: electromyographic spectral-compression in laryngeal muscles. Laryngoscope. 2006;116(6):959-65.
26. Remacle A, Morsomme D, Berrue E, Finck C. Vocal impact of a prolonged reading task in dysphonic versus normophonic female teachers. J Voice. 2012;26(6):820e1-13.
27. Bhuta T, Patrick L, Garnett JD. Perceptual evaluation of voice quality and its correlation with acoustic measurements. J Voice. 2004;18(3):299-304. 28. Laukkanen AM, Jarvinen K, Artkoski M, Waaramaa-Maki-Kulmala T,
Kankare E, Sippola S, et al. Changes in voice and subjective sensations
during a 45-min vocal loading test in female subjects with vocal training. Folia Phoniatr Logop. 2004;56(6):335-46.
29. Laukkanen AM, Kankare E. Vocal loading-related changes in male teachers’ voices investigated before and after a working day. Folia Phoniatr Logop. 2006;58(4):229-39.