LONGITUDINAL STUDY OF VOCAL
CHARACTERIZATION IN CHORAL SINGING
Estudo longitudinal de caracterização vocal em canto coral
Raquel Hochmuller Vieira (1), Camila Dalbosco Gadenz (1), Mauriceia Cassol (1)
(1) Universidade Federal de Ciências da Saúde de Porto
Ale-gre – UFCSPA. Porto AleAle-gre/RS - Brasil Conlict of interest: non-existent
a choir group, speech therapists not only can act
performing group work, but also provide individual
support to singers. Additionally, they can develop
vocal awareness activities such as lectures and workshops. Moreover, they can perform warm ups before and cool downs after rehearsals which are important to maintain a healthy voice. Furthermore, they have the capability of evaluating and monitoring
all voices in the entire choir5.
In the adult choir, it is observed a division of voices in four groups, called suits. There are two male suits, tenors and basses, and two female suits,
sopranos and altos, representing respectively high
and low pitch voices of each gender. The interim vocal ratings, baritone, male voice, and mezzo-soprano, female voice, are hardly separated in suits, like the others, only being requested in more complex and advanced choirs5,6 .
The speech assessment involves speciic execution such as auditory-perceptual evalu
-ation and computerized acoustic analysis. In the auditory-perceptual assessment, the listener and evaluator will deine how the individual uses his voice indicating the laryngeal vocal ability and the characteristics of the vocal tract and its articulators. In other words, what is the overall impression of
INTRODUCTION
The voice is the sound produced predominantly in expiration, through the vocal folds adduction and reined by the speech organs, such as the palate,
tongue, teeth, lips and nose1. Diferential param -eters can be observed in the singing and speaking voice, as such: respiration, phonation, vocal quality, vibrato, resonance and voice projection, articulation of speech sounds, pauses and body posture. In short, the spoken voice is valued by the intelligibility of the text, not in sound and audio quality that is
presented. On the contrary, the singing voice is at
times valued with moments of text unintelligibility deliberately performed with the purpose of reaching the sound quality intended2.
In Brazil, there is an immense variety of amateur and professional choral groups. A survey with 150 regents from the State of São Paulo indicates that 97.9% of the studied chorals are amateurs. This demonstrates the great ield of activity there is within reach of speech pathologist practitioners3,4. In
ABSTRACT
Purpose: to verify what the beneits of choral singing for the improvement of vocal patterns pre and
post singing activity. Methods: in three diferent times in one year, data were collected on signs and
symptoms vocals, voice recordings for auditory perception and acoustic analysis, with fundamental
frequency, jitter, shimmer, glottal noise, as well as the vocal range and maximum phonation time. The sample consisted of 23 amateur singers in a university choir, belongs to the Federal University of Health Sciences of Porto Alegre. The statistical analysis consisted of crossing data at diferent stages of evaluation. Results: it was observed that the majority of singers has no inadequate patterns when
it comes to the use of their voices. There was improvement in awareness of use and vocal care and in acoustic parameters. Conclusion: within one year of measurement, it was veriied that the practice
of choir singing brought vocal beneits for individuals, through developments and improvements
individual in phonation.
the Health Sciences department in the Federal University of Porto Alegre (UFCSPA) with 029/12 record. All subjects were instructed about the research and were asked to sign the Free Consent Term in accordance with current regulations.
The work evaluates vocal aspects of a choral belonging to UFCSPA. The development of the research was conducted at three diferent stages (step 1 - ET1; step 2 - ET2, and Step 3 - ET3) within one year, in order to assess the development of vocal aspects with the practice of choral singing. The sample consisted of 23 people (14 female and 9 male) members of Coral UFCSPA who expressed interest in collaborating with the research, thus deining a sampling by convenience. The interval between the evaluation stages was approximately six months.
It was considered as inclusion criteria: participate in the UFCSPA Choral more frequently than 75% of all rehearsals; receive clariication notice regarding the research, signing the informed consent form authorizing the use of data in the study; and to be at least 18 years old; as exclusion criteria, individuals who did not meet the above requirements.
The UFCSPA Choral is amateur, not having a test for admission, just a vocal classiication. University students, teachers, institution staf, and people from the community compose it. Rehearsals take place at the University with a weekly frequency and duration of approximately 1 hour and 30 minutes. The choir is part of a Pro Dean Project University Extension. Under faculty guidance of a specialist in voice, speech therapy tutors perform warm ups and cool downs in all rehearsals.
During the data collection process, voice
recordings were taken for acoustic and perceptual analysis, vocal range, maximum phonation time (TMF), and the questionnaire signs and vocal symptoms were applied.
The survey was developed by the researcher based on a questionnaire of vocal signs and symptoms already validated12. This was sent by e-mail, using Google’s Drive automated petition form and data storage. The assessment procedure
involving voices perceptual analysis, included
recording a sustained habitual emission of vowels /a, i/, count from 1 to 10 and singing “Happy Birthday”. During the assessments subjects remained standing. Voice analysis was performed by GRBASI9 scale by two speech pathologists judges, blinded to the condition of the sample. The voices were presented randomly and individually by randomizing cases and controls. To obtain the acoustic analysis data, it was recorded the issuance of the sustained vowel /ε/, and extracted the fundamental frequency measures ilter usage and glottal source1-7. Despite this type of
voice evaluation being considered subjective, as it depends on the auditory training of the evaluator, it is a traditionally basic tool and reference in speech therapy as it ascertains the progress of the treatment, facilitates the understanding of vocal organs physi -ology directing the speech therapy, it sensitizes
the individual to their need to behavioral change, and it also clariies causal factors of disorder1,8. To measure the auditory-perceptual assessment in a standardized way, numerical scales were organized and validated through vocal classiication. Among them, two are widely used in clinical practice and
vocal research, GRBASI9 and CAPE-V10.
The acoustic analysis is the extraction and quantiication process of vocal signal by means of objective instruments. This assessment provides indirect measurements on the vocal cords vibratory patterns, potential vocal tract adjustments, and its changes over time. Its interpretation varies according to age, gender, type of phonation, and
vocal training7-11. Among the various acoustic measurements that voice laboratories can ofer, some are more applied because they ofer a more reliable voice quality description like: fundamental frequency, jitter, shimmer and glottal noise (GNE - glottal Noise Excitation)1.
Vocal range, which is the number of notes that an individual has, from the lower note to the more acute, and the maximum phonation time, the amount of time that they can sustain note, word or phrase with only one breathing, is of utmost importance in the activity of choral singing for speech therapy. If using these factors the individual can sing a larger amount of notes, in a greater amount of time, this may help him interpreting and singing1,6.
Vocal assessment protocols have now been presented as a basis for the creation of speciic questionnaires in speech therapy, both spoken
and singing voice1. This guides the professional to develop protocols, which will provide relevant data on the vocal behavior of the singer. Through these questionnaires it is possible to identify signs and vocal symptoms that may indicate improper speech behavior or even a vocal pathology signal. There are protocols for this purpose in the literature, where there is a cutof point (number of signals) considered normality standard1,2,12.
This research aimed to verify what are the beneits of choral singing for improvements on pre and post vocal emission standards.
METHODS
and who satisied the inclusion and exclusion
criteria.
All data was equally collected in the three stages, with the exception of vocal signs and symptoms questionnaire, which was collected only on steps
1 and 3. Data collection occurred in the Voice and
Speech Lab at the university.
RESULTS
Over the large number of variables collected, the results were separated into two groups as to be better observed. Firstly, questionnaire results of voice signs and symptoms are exposed, which were applied in steps 1 and 3, and then the results of other
evaluations, applied in three steps. In each stage
there was variation in the sample amount. In ET1, 80 subjects were initiated, 30 subjects remained in ET2, and inally 23 subjects in ET3.
Questionnaire of vocal signs and symptoms
Fifteen subjects (65.2%) are students, and the entire sample average age is 26.48 years old (DP 6.16). Most participants (82.6%), had not sung in a choir before joining the institution Choral, and
also had not undergone speech therapy (91.3%).
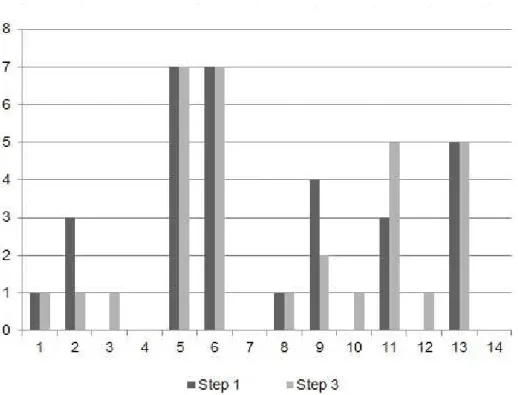
Figure 1 shows the sample distribution by voice classiication in each step, Figure 2 shows the found relationship between vocal signals and symptoms, and Table 1 shows the statistical relationship related to vocal signals and symptoms.
In ET1, 21.7% of the subjects noticed a change in their voice throughout the day; in ET3 34.8% did not notice changes, followed by the same number reported having felt that the voice alters with temperature changes. Eighteen subjects (78.3%) reported that their voices came out efortlessly during the test in ET1 and in ET3 this igure rose to 91.3% (p = 0.019). Regarding foreign body sensa
-tions, scratches, bites, pain or irritation in the larynx during singing, 26.1% felt at least one symptom in ET1 compared to 21.74% in ET3. The most referred sensation was that of “scratches” (17.4% for both phases; p = 0.038). Table 2 presents pain or strain regions reported by subjects in their daily routine. (f0), jitter, shimmer and noise level (ratio GNE) using
VoxMetria software - CTS Informática, version 4.0.
The two recordings taken (perceptual and acoustic analysis) occurred in silent environment with microphone Shure SM58 brand model, and a
pedestal aid to support, directly in digital recorder. A
distance was maintained between the microphone and the participant’s mouth, 5 cm to sustained vowels, and 10 cm for sequential speech.
For vocal range evaluation, it was used an Yamaha keyboard, PSR-E213 model, in which it obtained the lowest and highest note reached by the subject without detuning during broadcast. In this regard, during the evaluation, the notes were selected before the person entered into falsetto zone and basal register. In the maximum phonation time (TMF) all vowels (a, ε, i, ᴐ, u) were requested to be issued plus the phonemes /s, z/.
Statistical analysis was performed using SPSS software version 19. The Shapiro-Wilk test was used to verify the normality of variance for continuous variables. For categorical variables, data was described in absolute and relative value; due to the reduced number of continuous variables with normal distribution, variables will be presented by accom
-panied minimum and maximum mean value. The inferential analysis was performed through variable comparisons during the three evaluation periods. The Wilcoxon U test was used to compare intra-group means, and the Mc Nemar test to compare the frequency of symptoms in each stage of the study. It was considered the 5% signiicance level. Analyses relating to the questionnaire of vocal signs and symptoms were compared, no gender difer
-entiation. The other collected data were analyzed amongst each other and with gender diferentiation.
Description of the data collection steps
ET1: held in the winter of 2012, it included all participants who had shown initial interest in partici -pating in the research.
ET2: held in the summer of 2012-2013, included participants who expressed interest in staying in the research and who satisied the inclusion and exclusion criteria.
Figure 1 – Number of subject classiied by vocal sample in steps 1 and 3 of the data collection
1 - Hoarseness; 2 - Voice tires or changes quality after short use; 3 - Trouble speaking or singing softly; 4 - Efort to talk; 5 - Diiculty projecting voice; 6 - Loss of singing range; 7 - Discomfort while using voice; 8 - A monotone voice; 9 - Chronic throat dryness; 10 - Swallowing diiculties; 11 - Frequent throat clearing; 12 - Bitter or acid taste; 13 - A wobbly or shaky voice; 14 – Chronic throat soreness
occurred only when subjects believed to be strictly necessary (30.4% in ET1 and ET3 at 39.1%). The number of subjects who took vocal activities, such
as speech therapy, speech diction, singing lessons and theater, also increased (34.78% to 43.48%
in ET1 and ET3 respectively / p = 0.000), singing lesson being the most recurrent (26.08% to 43.48% in ET1).
Eight subjects (34.8%) present at least one respi
-ratory disease in both stages. The most prevalent diseases were rhinitis (ET1 - 47.8% / ET3 - 56.5% / p = 0.002) and sinusitis (ET1 - 34.8% / ET3 - 39.1% / p = 0.001). Referring to vocal health habits, in ET1 30.4% performed vocal warm ups regardless of the regent’s presence or stimulus, subsequently in the ET3 that number changed signiicantly (p = 0.026) to 43.5%. The water intake during the rehearsals
Table 1 – Signiicance Values for Vocal Signs and Symptoms by Roy (2004) relating between steps 1
and 3 of data collection
Variable Subject Amount (%)
step 1
Subject Amount (%)
step 3 Value p
1 1 (4,3%) 1 (4,3%) 1
2 3 (13%) 1 (4,3%) 0,5
3 0 1 (4,3%) NA
4 0 0 NA
5 7 (30,4%) 7 (30,4%) 1 6 7 (30,4%) 7 (30,4%) 1
7 0 0 NA
8 1 (4,3%) 1 (4,3%) 1
9 4 (17,4%) 2 (8,7%) 0,625
10 0 1 (4,3%) NA
11 3 (13%) 5 (21,7%) 0,687
12 0 1 (4,3%) NA
13 5 (21,7%) 5 (21,7%) 1
14 0 0 1
Mc Nemar test. Signiicant results at p <0.05
NA – not applicable statistical test (one of the values is equal to 0)
1 - Hoarseness; 2 - Voice tires or changes quality after short use; 3 - Trouble speaking or singing softly; 4 - Efort to talk; 5 - Diiculty projecting voice; 6 - Loss of singing range; 7 - Discomfort while using voice; 8 - A monotone voice; 9 - Chronic throat dryness; 10 - Swallowing diiculties; 11 - Frequent throat clearing; 12 - Bitter or acid taste; 13 - A wobbly or shaky voice; 14 – Chronic throat soreness
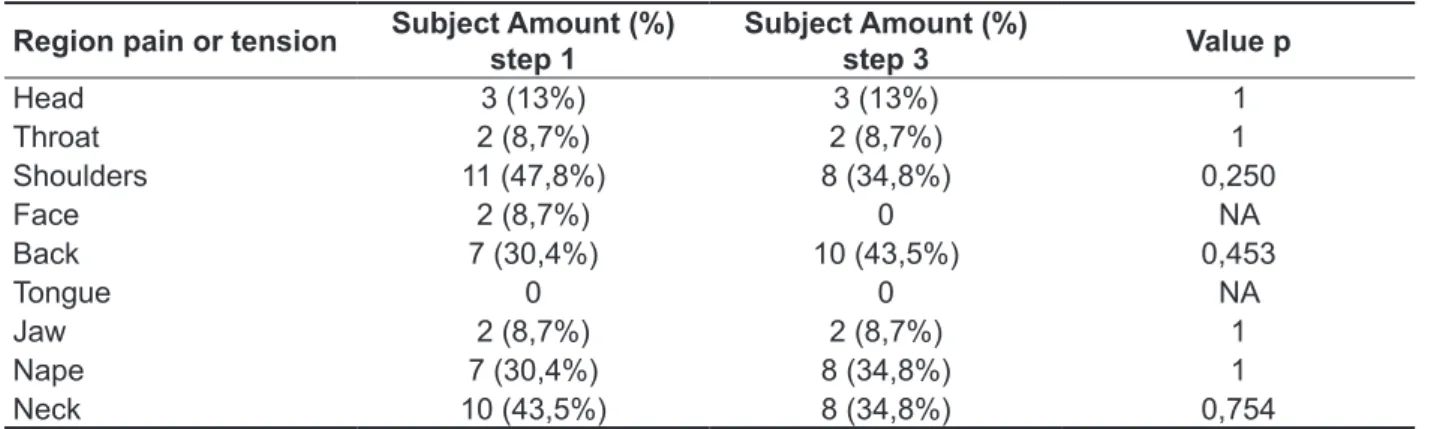
Table 2 – Overview of muscle pain in daily routine and their signiicance level
Region pain or tension Subject Amount (%) step 1
Subject Amount (%)
step 3 Value p
Head 3 (13%) 3 (13%) 1
Throat 2 (8,7%) 2 (8,7%) 1
Shoulders 11 (47,8%) 8 (34,8%) 0,250
Face 2 (8,7%) 0 NA
Back 7 (30,4%) 10 (43,5%) 0,453
Tongue 0 0 NA
Jaw 2 (8,7%) 2 (8,7%) 1
Nape 7 (30,4%) 8 (34,8%) 1
Neck 10 (43,5%) 8 (34,8%) 0,754
Mc Nemar test. Signiicant results at p <0.05
73.9% agreement with ET1; 69.3% agreement with ET2 and 100% agreement with ET3. In the infer
-ential analysis, there was only signiicance between
steps 1 and 2 (p = 0.003). Other data are listed on
the following Tables.
Other evaluations
The vocal range found in the research, along with the vocal classiication stipulated by the conductor of the choir was compared with Tonal Vocal Assessment Correspondents Table13 and resulted in
Table 3 – Mean values with minimum and maximum fundamental frequency, maximum phonation
time, amount of semitones and vocal range by gender and research steps
Males Females
Med. Min. Max. Med. Min. Max.
Fundamental Frequency - Hz
Step 1 121,3 104,84 215,55 208,175 177,66 247,32 Step 2 131,33 111,17 158,76 220,125 184,45 242,52 Step 3 131,54 119,57 158,08 233,26 211,95 264,46
Maximum Phonation Time - s
Step 1 16,41 9,32 22,39 10,92 6,19 13,87 Step 2 18,09 8,86 28,22 12,52 8,72 17,33 Step 3 16,20 7,36 34,71 14,09 7,28 22,1
Amount of Semitones
Step 1 27 21 36 24,5 13 32 Step 2 24 20 31 24 17 35 Step 3 24 14 32 25 22 34
Vocal Range – Hz
Step 1 LP 98 72,5 116,5 185,5 147 196 HP 416 349 659 678,5 392 880 Step 2 LP 98 62 116,5 165 123 247 HP 370,5 330 494 698 494 988 Step 3 LP 165 110 196 196 147 247 HP 555 392 784 856 587 988
Table 4 – Signiicance values for fundamental frequency, maximum phonation time, amount of
semitones and vocal range related to gender and research steps
GM GF
Step 1 and Step 2
Fundamental frequency p = 0,859 p = 0,124
Maximum phonation time p = 0,139 p = 0,087 Vocal range LP p = 0,574 p = 0,722 HP p = 0,767 p = 0,223
Amount of semitones p = 0,138 p = 0,570
Step 2 and Step 3
Fundamental frequency p = 0,767 p = 0,013*
Maximum phonation time p = 0,859 p = 0,006* Vocal range LP p = 0,012* p = 0,142
HP p = 0,013* p = 0,006*
Amount of semitones p = 0,624 p = 0,107
Step 1 and Step 3
Fundamental frequency p = 0,515 p = 0,008*
Maximum phonation time p = 0,441 p = 0,011* Vocal range LP p = 0,008* p = 0,288
HP p = 0,051* p = 0,002*
Amount of semitones p = 0,123 p = 0,032*
GM = Males GF = Females LP = Lowest Frequency HP = Highest Frequency
* = Statistically signiicant results (Wilcoxon’s U test, p <0.05)
Table 5 – Mean values, minimum and maximum for the proportion glottal noise excitation, jitter,
shimmer and s/z ratio by gender and research steps
Males Females
Med. Min. Max. Med. Min. Max.
Proportion GNE
Step 1 0,95 0,82 0,97 0,91 0,71 0,96 Step 2 0,85 0,43 0,95 0,885 0,62 0,96 Step 3 0,84 0,53 0,96 0,82 0,50 0,96
Jitter
Step 1 0,10 0,07 0,26 0,185 0,10 0,41 Step 2 0,15 0,00 0,28 0,135 0,07 0,50 Step 3 0,19 0,08 0,25 0,20 0,09 1,29
Shimmer
Step 1 4,60 2,81 6,88 2,73 1,86 5,36 Step 2 5,18 3,84 7,35 3,26 2,26 5,52 Step 3 4,28 2,66 8,41 3,45 1,59 6,75
Ratio s/z
Step 1 1,094 0,63 1,35 1,01 0,60 1,62 Step 2 0,87 0,78 1,49 0,93 0,67 1,77 Step 3 0,89 0,82 1,79 1,03 0,72 1,78
spoken voice5. Another research15 demonstrates that 45% of their sample showed between 1 and 2 vocal symptoms, including the diiculty of singing in
high-pitched tones.
When singers start their activities, they can choose diferent ways to reach vocal control, where active efort is no longer needed. This path varies for each individual, but progress always occurs16. So, it was observed over time, the increasing amount of subjects (91.3%) who reported not making any eforts at the time of singing, thus demonstrating that they were able to learn with choral singing how to practice and enjoy the best capabilities of their
vocal tract.
Also, within the singing learning process, it is possible to highlight the importance of vocal health awareness. This goes beyond voice care, it also encompasses vocal physiology and understanding about factors that can impair the singing or speaking voice. The absence of speciic voice care practices can bring harm to the singer’s voice, both short and long term2,5. In this research we can observe positive and negative aspects about the quality of noise emission. The presence of roughness during
singing, and changes in voice during a regular day,
under the inluence of sudden temperature changes, can be considered negative aspects, however, other data also point in a diferent direction. The increase number of subjects who performed voice warm ups, water intake, speciic care of the voice and increased demand for professional vocal activities show the growing awareness about the issue.
This research also veriied the occurrence of complaints related to muscle pain or tension. Table 2 shows that a lot of subjects reported pain or muscle tension in the neck or shoulder girdle,
DISCUSSION
The challenge of learning how to sing involves a diverse range of organic, technical and psycho
-logical factors2. For singers, the instrument is their voice; they must perceive and improve themselves with it, so that the inal result may transpire what the composer imagined. Group singing is no exception
to this rule, and since there is a strong plurality in
choirs, the members are required to have greater commitment, after all reaching a sound unit is quite complicated4,5.
In the studied group, during the research
development, there was constant exchange of
choristers2,5. This justiies the fact that the sample decreased over time. Change can be observed in the number of subjects in each suit due to the fact that the conductor led new trials in diferent periods of the year.
It was observed a prevalence of 14 vocal signs and symptoms, which when present in the subject’s complaint, may suggest a functional imbalance in
voice production12,14. By observing Figure 2, the results showed that the average symptoms of the studied group are within normal range, although it disagrees with the literature indings about the most common symptoms, which were: dry throat, hoarseness, vocal fatigue and throat clearing. However, the research group was a sample of basic educational teachers where vocal demand is primarily spoken. Conversely, for this research, singers were investigated, although the majority were amateurs, they require a diferent vocal demand since it is known that singing voice requires prior training and greater voice awareness, unlike
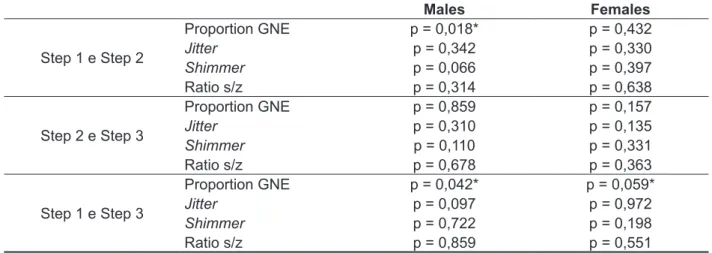
Table 6 – Signiicance values for proportion glottal noise excitation, jitter, shimmer and s/z ratio relating with gender and research steps
Males Females
Step 1 e Step 2
Proportion GNE p = 0,018* p = 0,432
Jitter p = 0,342 p = 0,330
Shimmer p = 0,066 p = 0,397 Ratio s/z p = 0,314 p = 0,638
Step 2 e Step 3
Proportion GNE p = 0,859 p = 0,157
Jitter p = 0,310 p = 0,135
Shimmer p = 0,110 p = 0,331 Ratio s/z p = 0,678 p = 0,363
Step 1 e Step 3
Proportion GNE p = 0,042* p = 0,059*
Jitter p = 0,097 p = 0,972
Shimmer p = 0,722 p = 0,198 Ratio s/z p = 0,859 p = 0,551
previous statements, although other research has found stability in this variable11.
Referring to auditory-perceptual assessment, in the 3 stages collected, most of the subjects received index 0 in the general level assessment, which represents no change. Some sporadic cases received assessment that matches one slight change. Statistical analysis did not get signiicant value. This shows a positive factor related to choral singing activity, which contributed to the mainte
-nance and improvement of the subjects’ voices. Relecting on the indings of this study, it is suggested that in the future the sample size is
greater than the current one. Even though the
authors point to beneits of choral singing practice for voice longevity4,24, a potentially larger sample could bring greater veriication signiicance of the results described in the literature.
CONCLUSION
This research concludes that it is not simply learning how to sing, but also developing new relationships within the context of the activity creating specialized informational webs for better results, like voice awareness and vocal care. Choral singing practice can develop, improve and restore the voice. From the observed changes, it also consolidates the practice of choral singing showing beneits to the subjects of this research in all evaluated parameters. Thus, the act of singing is an excellent exercise to improve longevity, health
and vocal plasticity.
ACKNOWLEDGEMENTS
To colleagues Tanise Cristaldo Anhaia, and Karoline Weber dos Santos for their collaboration, motivation and companionship throughout the
research process.
which are characteristic of dysphonia by muscu
-loskeletal tension. This dysphonia arises not by vocal folds pathology, but by tension in the extrinsic larynx muscles. The recurrence of these symptoms, combined with vocal exertion can lead to such
dysphonia1,17,18. Another important aspect is related to airways infection, which is common in southern Brazil due to constant climatic changes19,20. One of the most recurrent infections is rhinitis, which can afect up to 20% of the general population. During data collection, a lot of subjects presented airways deviation, which can be considered a bias in the survey, since this obstruction can cause impairment of vocal emission1,21,22.
In the acoustic parameters adopted for the survey, which can be observed in Tables 3, 4, 5 and 6, the mean results, for both sexes, they were within the normal range established in the literature1,2,5,23. In the vocal range parameter, there was agreement between the results found by the researcher and the vocal classiication made by the conductor. When we stratiied the sample by gender, it was observed that the variables of tables 3 and 4, fundamental frequency, maximum phonation time, vocal range and quantity of semitones, showed signiicant values only for females, and for a year worth of comparison. A research reported signiicant results with a shorter amount of time and work, but their proposal was an active intervention by the speech therapist, unlike
12. Roy N, Merril RM, Thibeault S, Gray SD, Smith EM. Voice Disorders in Teachers and the General Population: Efects in Work Performance,
Attendance, and Future Career Choices. J Speech Lang Hear Res. 2004;47(3):542-51.
13. Pinho SMR, Bastos PRJ. Quadro para avaliação vocal de correspondentes tonais. [Quadro em papel, auxiliar para a avaliação vocal] Barueri: Pró-Fono,
2003.
14. Behlau MS, Zambon F, Guerrieri AC, Roy N. Panorama epidemiológico sobre a voz do professor no Brasil. 17° Congresso Brasileiro de
Fonoaudiologia: 21-24 out 2009; Salvador-BA.
15. Ribeiro LR, Hanayama EM. Peril Vocal de Coralistas Amadores. Rev CEFAC.
2005;7(2):252-66.
16. Coelho ACC, Daroz IF, Silverio KCA,
Brasolotto AG. Coralistas amadores: auto-imagem, diiculdades e sintomas na voz cantada. Rev
CEFAC. 2013;15(2):436-43.
17. Cielo CA, Christmann MK, Ribeiro VV, Hofmann CF, Padilha JF, Steidl EMS et al. Síndrome de tensão musculoesquelética, musculatura laríngea extrínseca e postura corporal: considerações teóricas. Rev CEFAC. 2014;16(5):1639-49.
18. Boone DR, McFarlane SC, Von Berg SL, Zraick RI. The Voice and Voice Therapy. 8th ed. Pearson,
2009.
19. Estevão DB, Meirelles RC. Rinossinusite
crônica. Revista Hospital Universitário Pedro Ernesto. 2012;11(3):56-61.
20. Lague LG, Roithmann R, Augusto TAM.
Prevalência do uso de vasoconstritores nasais
em acadêmicos de uma universidade privada do Rio Grande do Sul. Revista da AMRIGS.
2013;57(1):39-43.
REFERENCES
1. Behlau M (Org. ). Voz: o livro do especialista. Rio
de Janeiro: Revinter, 2008.
2. Behlau M, Rehder IM. Higiene Vocal Para O Canto Coral. São Paulo: Revinter, 1997.
3. Rehder MIBC, Behlau MS. Peril vocal de regentes de coral do estado de São Paulo. Rev
CEFAC. 2008;10(2):206-17.
4. Loiola CM, Ferreira LP. Coral amador: efeitos de uma proposta de intervenção fonoaudiológica. Rev
CEFAC. 2010;12(5):831-41.
5. Behlau M (Org. ). Voz: o livro do especialista. 2
vol. Rio de Janeiro: Revinter, 2005.
6. Cruz TLB, Gama ACC, Hanayama EM. Análise da extensão e tessitura vocal do contratenor. Rev
CEFAC. 2004;6(4):423-8.
7. Oliveira RC, Teixeira LC, Gama ACC, Medeiros AM. Auditory-perceptive, acoustic and vocal self-perception analyses in children. J Soc Bras
Fonoaudiol. 2011;23(2):158-63.
8. Soares EB, Brito CMCP. Vocal proile of tourism
guide. Rev CEFAC. 2006;8(4):501-8.
9. Dejonckere PH, Remacle M, Fresnel-Elbaz E, Woisard V, Crevier-Buchman L, Millet B. Diferentiated perceptual evaluation of pathological voice quality: reliability and correlations with acoustic measurements. Rev Laryngol Otol Rhinol.
1996;117(3):219-24.
10. Behlau M. Consensus Auditory- Perceptual Evaluation of Voice (CAPE-V), ASHA 2003. Reletindo sobre o novo/New relexions. Rev soc bras fonoaudiol. 2004;9(3):187-9.
11. Beber BC, Cielo CA. Medidas acústicas de fonte glótica de vozes masculinas normais. Pró-Fono R
Atual Cient. 2010;22(3):299-304.
RESUMO
Objetivo: veriicar quais os benefícios do canto coral para o aprimoramento dos padrões de emissão
vocal pré e pós atividade de voz cantada. Métodos: em três diferentes etapas, no período de um ano,
foram coletados dados de sinais e sintomas vocais, registros de voz para análise perceptivo-auditiva e acústica, com os parâmetros de frequência fundamental, jitter, shimmer e ruído glótico, assim como a extensão vocal e o tempo máximo de fonação. A amostra foi composta por 23 cantores amadores de um coral universitário pertencente à Universidade Federal de Ciências da Saúde de Porto Alegre. A análise estatística consistiu de cruzar os dados em diferentes etapas de avaliação. Resultados:
observou-se que a maioria dos cantores não apresentou padrões inadequados de uso vocal. Houve melhora da consciência de uso e cuidados vocais e de parâmetros de análise acústica. Conclusão:
no período de um ano de mensuração, foi possível veriicar que a prática de canto coral trouxe bene
-fícios vocais aos sujeitos por meio do desenvolvimento e aprimoramento individual da emissão vocal.
23. Rocha TF, Amaral FP, Hanayama EM. Extensão vocal de idosos coralistas e não coralistas. Rev
CEFAC. 2007;9(2):248-54.
24. Cassol M. As Inluências do Canto na Prevencão do Envelhecimento vocal. In: Terra LN. (Org. ). Envelhecimento com Qualidade de Vida. Porto
Alegre: EDIPUC, 2001. p.105-7.
21. Takeshita TK, Aguiar-Ricz L, Isaac ML, Ricz H, Anselmo-Lima W. Comportamento Vocal de Crianças em Idade Pré-escolar. Intl. Arch.
Otorhinolaryngol. 2009;13(3):252-8.
22. Campanha SMA, Fontes MJF, Santos JLF. Dispnéia em indivíduos com asma, rinite alérgica e respiração oral. Rev CEFAC. 2012;14(2):268-73.
http://dx.doi.org/10.1590/1982-021620151761515 Received on: February 03, 2015
Accepted on: June 16, 2015
Mailing address:
Raquel Hochmuller Vieira
Rua André Rebouças, 91/301 - Centro São Leopoldo – RS – Brasil
CEP: 93010-110