Stability of beta-titanium T-loop springs
preactivated by gradual curvature
Sergei Godeiro Fernandes Rabelo Caldas1, Renato Parsekian Martins2,3, Marcela Emílio de Araújo1, Marília Regalado Galvão1, Roberto Soares da Silva Júnior2, Lídia Parsekian Martins4
1 Universidade Federal do Rio Grande do Norte, Departamento de Odontologia
(Natal/RN, Brazil).
2 Universidade Estadual Paulista, Faculdade de Odontologia de Araraquara,
Programa de Pós-graduação em Ciências Odontológicas – Ortodontia (Araraquara/SP, Brazil).
3 Private practice (Araraquara/SP, Brazil).
4 Universidade Estadual Paulista, Faculdade de Odontologia de Araraquara,
Departamento de Clínica Infantil (Araraquara/SP, Brazil).
Objective: Evaluate changes in the force system of T-Loop Springs (TLS) preactivated by curvature, due to stress relaxation. Meth-ods: Ninety TLSs measuring 6 x 10 mm, produced out with 0.017 x 0.025-in TMA® wire and preactived by gradual curvature, were randomly distributed into nine groups according to time point of evaluation. Group 1 was tested immediately after spring preactiva-tion and stress relief, by trial activapreactiva-tion. The other eight groups were tested after 24, 48 and 72 hours, 1, 2, 4, 8 and 12 weeks, respec-tively. Using a moment transducer coupled to a digital extensometer indicator adapted to a universal testing machine, the amount of horizontal force, moment and moment-to-force ratios were recorded at every 0.5 mm of deactivation from 5 mm of the initial activation, in an interbracket distance of 23 mm. Results: The horizontal forces decreased gradually among the groups (p < 0.001) and the moments showed a significant and slow decrease over time among the groups (p < 0.001). All groups produced similar M/F ratios (p = 0.532), with no influence of time. Conclusions: The TLSs preactivated by curvature suffered a gradual deformation over time, which affected the force system, specifically the moments, which affected the horizontal forces produced.
Keywords: Orthodontics. Tooth movement. Orthodontic wires.
DOI: https://doi.org/10.1590/2177-6709.22.6.061-067.oar
How to cite: Caldas SGFR, Martins RP, Araújo ME, Galvão MR, Silva Júnior RS, Martins LP. Stability of beta-titanium T-loop springs preacti-vated by gradual curvature. Dental Press J Orthod. 2017 Nov-Dec;22(6):61-7. DOI: https://doi.org/10.1590/2177-6709.22.6.061-067.oar
Submitted: May 04, 2017 - Revised and accepted: August 22, 2017
» The authors report no commercial, proprietary or financial interest in the products or companies described in this article.
Contact address: Sergei Godeiro Fernandes Rabelo Caldas Av. Senador Salgado Filho, 1787, Natal/RN – CEP: 59.056-000 E-mail: [email protected]
Objetivo: avaliar as mudanças no sistema de forças das molas T pré-ativadas por curvatura, devido ao alívio de tensão estrutural. Métodos: noventa molas em forma de “T”, medindo 6 mm x 10 mm, confeccionadas com fio de beta-titânio TMA® de 0,017” x 0,025” e pré-ativadas por curvatura gradual, foram distribuídas aleatoriamente em nove grupos, de acordo com o momento de avaliação. O Grupo 1 foi testado imediatamente após a pré-ativação da mola e liberação do estresse, por meio de simulação da ativa-ção. Os outros oito grupos foram divididos conforme o intervalo de tempo testado: após 24, 48 e 72 horas; 1, 2, 4, 8 e 12 semanas. Usando um transdutor de momentos acoplado a um indicador digital para extensometria e adaptado a uma máquina universal de ensaios, as magnitudes da força horizontal, do momento e da proporção momento/força (M/F) foram registradas a cada 0,5 mm de desativação a partir da ativação inicial de 5 mm, utilizando-se uma distância interbraquetes de 23 mm. Resultados: as forças horizontais reduziram-se gradualmente nos grupos (p < 0,001) e o momento apresentou uma queda lenta e significativa ao longo do tempo (p < 0,001). Todos os grupos tiveram proporções M/F semelhantes (p = 0,532), não influenciadas pelo período de tempo. Conclusões: as molas pré-ativadas por curvatura gradual sofreram deformação progressiva ao longo do tempo, o que afetou o sistema de forças — especificamente o momento —, alterando as forças horizontais produzidas.
INTRODUCTION
The β-Ti T-loop spring (TLS) has been used since the 80’s for space closure due to its alloy and design
ad-vantages.1,2 Even though the speciic design produces a
high moment of activation, this moment might not be enough to move teeth by translation. Thus, the addition of a residual moment is needed by increasing the an-gulation of the extremities of the loops, in a procedure
known as preactivation.3 Templates4 and other methods5
of preactivation have been developed to produce spe-ciic forces and enough moment-to-force (M/F) ratios, allowing diferent types of tooth movement.
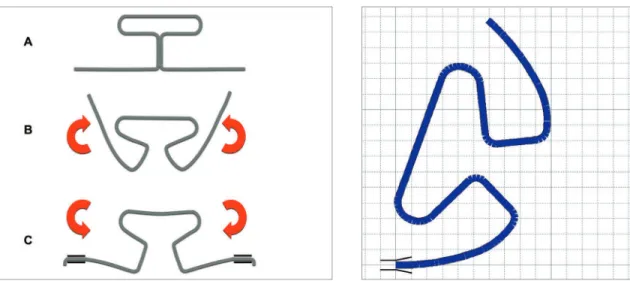
Upon engagement to the brackets, loops are normal-ly loaded in the opposite direction of the preactivation, which could over time cause progressive deformation
and force reduction (Fig 1).6,7 This time-dependent
ef-fect is called stress relaxation and has been thoroughly
studied in the alloys used in Orthodontics.8-13 Besides
the fact that this efect has only been supericially
evalu-ated for β-Ti,9,11,13-15 it has never been studied on TTLs
preactivated by gradual curvatures, which might be less sensitive to stress relaxation.
Thus, the aim of this study was to evaluate changes in the force system of TLSs preactivated by curvature due to stress relaxation.
Figure 1 - A) TLS in passive form. B) TLS preactivated by gradual curva-ture. C) TLS engaged to brackets (loaded in an opposite direction to the preactivation).
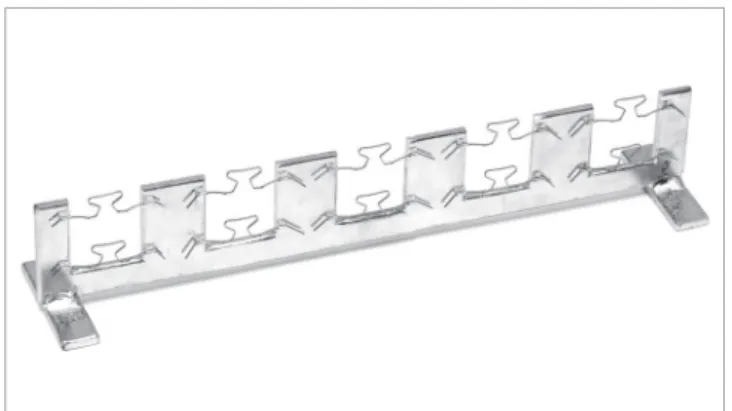
Figure 2 - Template developed in the Loop software (dHAL Orthodontic Soft-ware, Athens, Greece) used to preactivate the TLS. The software allows the template to be printed in 1:1 ratio (each square measures 1 mm2).
MATERIAL AND METHODS
Ninety TLSs measuring 6 x 10 mm were bent with a “Marcotte” plier (Hu-Friedy Dental Instruments,
Chi-cago, USA) using 0.017 x 0.025-in β-Ti (TMA®,
Orm-co Corporation, Glendora, USA) wires and preactivated by gradual curvature following a template (Fig 2).
The choice of symmetrical springs was made due to a specification of the test system used, as it only allows measurements of this type of spring, since the horizontal force is measured at the top of the device and the moment at the bottom. Asymmetric springs generate different forces and moments in both ends. In addition, the occurrence of a geometry change al-ters the force system.
Figure 3 - Custom-made device in order to keep the TLSs activated 5 mm.
An universal testing machine (EMIC, São José dos Pinhais, Brazil), equipped with a load cell of 0.1 kN, was coupled to a moment transducer and a dig-ital extensometer indicator (Transdutec, São Paulo, Brazil) for the tests. The speed used for the test was 5 mm/min and the digital extensomer’s excitation and
sensitivity was 5V and 0.5 mV/V, respectively.14,16,17
For the test, the TLSs were positioned symmetrically in an IBD of 23 mm.
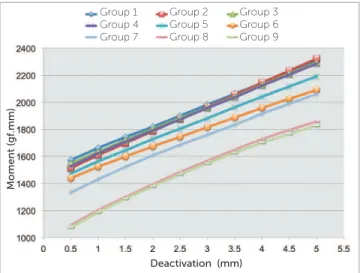
Horizontal force and moments were recorded for every 0.5 mm of deactivation at er 5mm of initial ac-tivation, and M/F ratios were calculated. The amount of horizontal overlap of the vertical extensions of the TLSs in “neutral position” was also calculated by linear interpolation. The load/del ection (L/D) ratio (the slope of the deactivation graph) was also obtained based in the graph (Fig 4).
SPSS v. 16.0 (SPSS Inc., Chicago, USA) statistical analysis sot ware was used in this study. The Kolmog-orov-Smirnov test indicated normal distributions and Levene’s test showed that all variables had similar vari-ances, except the M/F ratios.
The multivariate proi le analysis using the procedure for analysis of repeated measures was used in order to detect dif erences of forces, moments and M/F ratios
among the groups. This analysis compares the total pro-i le, or deactpro-ivatpro-ion pattern, of a whole group pro-in rela-tion to time and deactivarela-tion. In order to identify the dif erences among the groups, the post-hoc Tukey test was used with the averages generated by each time (total proi les average).
ANOVA was used, at level of 5%, to detect dif er-ences among the groups on L/D ratio and the amount of overlapping of the vertical extensions of the TLSs in “neutral position”. Post-hoc Tukey test, at level of 5%, was used to identify the groups’ dif erences.
RESULTS
There was a signii cant decrease of force over time among the groups when the total proi les of the TLSs
were compared (p < 0.001) (Table 1). The total
pro-i les horpro-izontal forces decreased gradually among the groups (Table 2 and Fig 4) with values of 228.4 gf, 197.3 gf, 191.4 gf, 184.5 gf, 185.9 gf, 189.9 gf, 167.8 gf, 161.4 gf and 143.7 gf for groups 1 through 9. Also, there was signii cant interaction of the time on the
rate of force decrease of the loops (p = 0.006) among
the groups (Table 1), meaning that the load-del ection rate of the loops also decreased with time. The values (Table 3) ranged from 78.1 to 72.1 gf per 0.5 mm and did not obey a linear decrease.
The amount of overlap of the vertical extensions of the TLSs (addressed as “neutral position” on Table 3) decreased gradually from group 1 (-0.18 mm) to group 9 (0,85 mm) (p < 0.001).
There was a significant and slow decrease of mo-ment over time among the groups when the total
profiles of the TLSs were compared (p < 0.001)
(Ta-ble 1). The total profile average moments produced throughout the deactivation were similar among group 1 (1941.0 gf.mm) to 7 (1713.3 gf.mm), being different only from group 8 (1506.8 gf.mm), which was similar to group 7 (1713.3 gf.mm), and group 9 (1486.4 gf.mm) (Table 2). There was also a significant interaction between evaluation time and deactivation (p < 0.048) (Table 1 and 2, Fig 5).
All groups produced similar total proi le average
M/F ratios (p = 0.532): 12.7 mm, -5.8 mm, 17.3 mm,
DISCUSSION
There was a gradual force decrease among the groups over time, critical in groups 4 (72 hours) and 9 (12 weeks), which can be explained by the stress relax-ation phenomenon. This decrease of force over time is in agreement to several other reports that have measured this efect on straight wires, showing it to be time-de-pendent.9,11,13 There were only two studies14,18 that looked upon this efect in more elaborate conigurations, eval-uating stress relaxation on TLSs preactivated by bends, in which a decrease of 15.5% on the force levels of TLSs was shown in the irst 24 hours. The present results also show a decrease over time, but with a diferent behavior that is probably due to the gradual curvature that was used for preactivation, distributing stress over the entire extent of curvature. The structural area of the TLS that was afected and responsible for relaxation was the angle between the vertical and horizontal extremities of the spring, which is a concentrated bend. This was found by scanning the TLSs of groups 1, 4 and 9 immediately before testing and measuring the TLS’s structural angles with the Screen Protractor 4.0 sotware (Iconico, New York, USA). Method error assessed through intraclass correlation coeicient (ICC) showed high reliabili-ty (0.996) (Table 4 and Fig 7).
Figure 7 - TLSs structural angles measured for finding the deformation loca-tion. The angle 7 is formed by the intersection of horizontal extremities of the TLS.
Figure 4 - Chart depicting the average forces produced during deactivation from 5 to 0.5 mm for the groups tested.
Group 1 Group 2 Group 3
Group 7 Group 8 Group 9 Group 4
For
ce (gf
)
Deactivation (mm) Group 5 Group 6
Figure 5 - Chart depicting the average moments produced during deactiva-tion from 5 to 0.5 mm for the groups tested.
Group 1 Group 2 Group 3
Group 7 Group 8 Group 9
Moment (gf
.mm)
Deactivation (mm) Group 4 Group 5 Group 6
Figure 6 - Chart depicting the average M/F ratios produced during deactiva-tion from 5 to 0.5 mm for the groups tested.
Group 1 Group 2 Group 3
Group 7 Group 8 Group 9
Deactivation (mm)
M/F (mm)
Variable Force Moment M/F
p value p value p value
Time < 0.001 < 0.001 0.532
Deactivation < 0.001 < 0.001 0.124
Deactivation x Time 0.006 0.048 0.159
Table 1 - Multivariate profiles test significance for force (F), moment (M) and M/F variables.
Table 2 - General profiles means and standard deviations for forces and moments within groups.
Different superscript letters indicate group differences.
Group Force Moment M/F
Mean SD Mean SD Mean SD
Group 1 228.4 A 115.1 1941.0 A 272.9 12.7 13.3
Group 2 197.3 AB 112.8 1919.9 A 336.8 -5.8 180.1
Group 3 191.4 AB 110.3 1922.0 A 301.9 17.3 42.3
Group 4 184.5 B 107.4 1912.9 A 317.5 3.7 100.2
Group 5 185.9 B 109.7 1840.7 A 286 20.9 61.7
Group 6 189.9 B 110.9 1775.4 A 288.9 24.8 90.8
Group 7 167.8 BC 112.9 1713.3 AB 286.7 13.3 40.2
Group 8 161.4 BC 110.1 1506.8 B 287.8 -3.5 245.3
Group 9 143.7 C 112.2 1486.4 B 256 18.8 49
Table 3 - Means and standard deviations for the overlapping of the vertical extensions of the TLSs and L/D ratio.
*p < 0.001. **p = 0.008. # in order to acquire the L/D per mm, multiply the values times 2. Different superscript letters indicate group differences.
Group Neutral Position* (mm) L/D** (gf/0.5mm)
#
Mean SD Mean SD
Group 1 -0.18 A 0.31 78.1 A 3.8
Group 2 0.11 AB 0.53 75.5 AB 4.4
Group 3 0.18 AB 0.29 74.3 AB 3.4
Group 4 0.19 AB 0.34 72.2 B 3.6
Group 5 0.17 AB 0.45 72.1 B 3.2
Group 6 0.23 AB 0.26 75.5 AB 3.4
Group 7 0.54 BC 0.32 76.1 AB 3.0
Group 8 0.59 BC 0.22 74.7 AB 2.9
Group 9 0.85 C 0.29 75.7 AB 3.9
Table 4 - ANOVA and post-hoc Tukey test to identify which angle (according to Fig 7) suffers a deformation due to time.
Different superscript letters indicate group differences.
Angle (Fig. 7)
Neutral Position Group 1 Post Period Group 4 Post Period Group 9
p
Mean SD Mean SD Mean SD
1 20.65 2.42 20.85 2.28 20.60 2.66 0.097
2 20.21 2.01 21.65 2.82 23.13 2.95 0.063
3 92.10 2.98 92.34 2.55 92.69 1.48 0.864
4 92.60 2.26 94.38 3.10 94.32 2.16 0.226
5 60.37 4.39 A 74.74 4.88 B 73.11 8.29 B <0.001
6 64.66 3.88 A 71.47 4.20 B 79.46 5.48 C <0.001
Time had a signiicant efect on L/D ratio, which was not constant throughout the evaluation, as demon-strated by the interaction between time and deactiva-tion (force variadeactiva-tion or L/D ratio) (Table 1). This ef-fect, although signiicant, shows very small diferences (6 gf/0.5mm) (Table 3), which may be clinically insig-niicant. Since the shape of a device can inluence L/D
ratio,19 this diferences could have happened due to
shape diferences in the TLS, as diferent places in its structure go through stress relaxation, causing slightly diferent L/D ratios overtime.
Moments were also afected by time, however, there was a signiicant decrease on the moments produced by the TLSs over time only in groups 8 and 9. It is known that an increase in the intensity of preactivation increas-es the moments produced, so a decrease in the preacti-vation due to stress relaxation of the gable could explain
a decrease in the moment values.3,20-23 In the present
re-sults, the behavior of overactivation caused by “neutral position”, due to the overlap of the vertical extensions of the TLSs, decreased over time and was consistent to the gradual decrease on the horizontal forces, since it has an efect on it. The clinician should be aware that when these changes occur in the shape of the TLS, this can decrease the horizontal force produced due to
a reduction of the overlap of vertical extensions,24 and
therefore this efect should be compensated.14
Regarding the horizontal force, there was a sig-niicant interaction of time on the rate of variation of
the moments with deactivation (p < 0.048). With time,
smaller decreases of moments are expected, since some relaxation of the TLS already took place. The moment levels during deactivation on the irst four weeks can be it on a relatively straight line, which over time, turns out to be a slight curvature (Fig 5). This efect has al-ready been shown on the literature and is explained by
deformations in speciic parts of the loop.14
The M/F ratios did not change and there was not interaction of time on the rate of the M/F ratios levels with deactivation. This was probably due to the fact that the stress relaxation in the wire happened slowly on mo-ments, causing a gradual decrease on the overlapping of the vertical extensions of the TLSs, which proportion-ally decreased the force levels.
Due to the laboratory characteristics of this study, the extrapolation of data to the clinical routine should be per-formed with caution. From the obtained results, it is sug-gested that the force system is more stable in the absence of concentrated bends, recommending that orthodontists should activate these devices by gradual curvatures.
CONCLUSIONS
The T-loop springs preactivated by curvature suf-fered a gradual deformation over time, which afected the force system, speciically the moments, which af-fected the horizontal forces produced.
Even though a gradual curvature distributes stress over the wire, the structure of the T-loop springs relax-es in an area of sharp bend, inherent to the “T” shape.
Author contributions
1. Burstone CJ. The segmented arch approach to space closure. Am J Orthod. 1982 Nov;82(5):361-78.
2. Burstone CJ, Goldberg AJ. Beta titanium: a new orthodontic alloy. Am J Orthod. 1980 Feb;77(2):121-32.
3. Burstone CJ, Koenig HA. Optimizing anterior and canine retraction. Am J Orthod. 1976 July;70(1):1-19.
4. Burstone CJ, van Steenbergen E, Hanley KJ. Modern Edgewise Mechanics & The Segmented Arch Technique. Glendora: Ormco; 1995.
5. Marcotte M. Biomechanics in Orthodontics. Philadelphia: BC Decker; 1990. 6. Earthman JC. Creep and stress-relaxation testing. In: Mechanical Testing and
Evaluation. Ohio: ASM Handbook; 2000. p. 359-424.
7. William D, Calllister J. Materials science and Engineering: an introduction. Hoboken, NJ: Wiley; 2006.
8. Burstone CJ, Qin B, Morton JY. Chinese NiTi wire: a new orthodontic alloy. Am J Orthod. 1985 June;87(6):445-52.
9. Hanyuda A, Nagasaka S, Yoshida T. Long-term time efect on load-delection characteristics of orthodontic wires. Orthod Waves. 2006;65:155-60. 10. Hazel RJ, Rohan GJ, West VC. Force relaxation in orthodontic arch wires. Am J
Orthod. 1984;86(5):396-402.
11. Hudgins JJ, Bagby MD, Erickson LC. The efect of long-term delection on permanent deformation of nickel-titanium archwires. Angle Orthod. 1990 Winter;60(4):283-8.
12. Lopez I, Goldberg J, Burstone CJ. Bending characteristics of nitinol wire. Am J Orthod. 1979 May;75(5):569-75.
13. Wong EK, Borland DW, West VC. Deformation of orthodontic archwires over time. Aust Orthod J. 1994 Oct;13(3):152-8.
14. Caldas SGFR, Martins RP, Viecilli RF, Galvao MR, Martins LP. Efects of stress relaxation in beta-titanium orthodontic loops. Am J Orthod Dentofacial Orthop. 2011 Aug;140(2):e85-92.
REFERENCES
15. Caldas SGFR, Ribeiro AA, Simplício H, Machado AW. Segmented arch or continuous arch technique? A rational approach. Dental Press J Orthod. 2014 Mar-Apr;19(2):126-41.
16. Caldas SGFR, Martins RP, Galvao MR, Vieira CIV, Martins LP. Force system evaluation of symmetrical beta-titanium T-loop springs preactivated by curvature and concentrated bends. Am J Orthod Dentofacial Orthop. 2011 Aug;140(2):e53-8.
17. Martins RP, Caldas SGFR, Ribeiro AA, Vaz LG, Shimizu RH, Martins LP. Diferences in the force system delivered by diferent beta-titanium wires in elaborate designs. Dental Press J. Orthod. 2015;20(6):89-96.
18. Silva Júnior R, Caldas SGFR, Martins LP, Martins RP. Efects of stress relaxation in beta-titanium orthodontic loops: Part II. Angle Orthod. 2016 May;86(3):386-90. 19. Dalstra M, Melsen B. Force systems developed by six diferent cantilever
conigurations. Clin Orthod Res. 1999 Feb;2(1):3-9.
20. Chen J, Markham DL, Katona TR. Efects of T-loop geometry on its forces and moments. Angle Orthod. 2000 Feb;70(1):48-51.
21. Faulkner MG, Fuchshuber P, Haberstock D, Mioduchowski A. A parametric study of the force/moment systems produced by T-loop retraction springs. J Biomech. 1989;22(6-7):637-47.
22. Lim Y, Quick A, Swain M, Herbison P. Temperature efects on the forces, moments and moment to force ratio of nickel-titanium and TMA symmetrical T-loops. Angle Orthod. 2008 Nov;78(6):1035-42.
23. Rose D, Quick A, Swain M, Herbison P. Moment-to-force characteristics of preactivated nickel-titanium and titanium-molybdenum alloy symmetrical T-loops. Am J Orthod Dentofacial Orthop. 2009 June;135(6):757-63