Facial height in Japanese-Brazilian descendants
with normal occlusion
Fabiano Paiva Vieira1, Arnaldo Pinzan2, Guilherme Janson3, Thais Maria Freire Fernandes4, Renata Carvalho Sathler5, Rafael Pinelli Henriques6
Objective: The aim of this study was to determine the standards of facial height in 30 young (14-year-old) Japanese-Brazilian descendants with normal occlusion, and assess whether sexual dimorphism is evident. Methods: The cepha-lometric measurements used followed the analyses by Wylie-Johnson, Siriwat-Jarabak, Gebeck, Merrifield and Horn. Results: Results showed dimorphism for total anterior facial height (TAFH), lower anterior facial height (LAFH), anterior facial height (AFH), total posterior facial height (TPFH) and upper posterior facial height (UPFH) mea-surements. Conclusions: The standards of facial heights in young Japanese-Brazilian descendants with normal occlu-sion were observed. Sexual dimorphism was identified in five out of thirteen evaluated variables at this age range.
Keywords:Orthodontics. Ethnic groups. Vertical dimension.
How to cite this article: Vieira FP, Pinzan A, Janson G, Fernandes TMF, Sath-ler RC, Henriques RP. Facial height in Japanese-Brazilian descendants with nor-mal occlusion. Dental Press J Orthod. 2014 Sept-Oct;19(5):54-66. DOI: http:// dx.doi.org/10.1590/2176-9451.19.5.054-066.oar
Submitted: May 13, 2009 - Revised and accepted: April 13, 2010
Contact address: Fabiano Paiva Vieira
Rua João XXIII, 600 – Jd. Dom Bosco – CEP: 86060-370, Londrina/PR — Brazil
E-mail: [email protected].
Financial support: CAPES - Coordination for the Improvement of Higher Educa-tion Personnel / Ministry of EducaEduca-tion (MEC).
1 Professor, Federal Institute of Paraná.
2 Associate professor, Department of Pediatric Dentistry, Orthodontics and
Collective Health, School of Dentistry — University of São Paulo/Bauru.
3 Full professor, Department of Pediatric Dentistry, Orthodontics and Collective
Health, School of Dentistry — University of São Paulo/Bauru.
4 Professor, University of Northern Paraná (UNOPAR).
5 Professor, Hospital for Rehabilitation of Craniofacial Anomalies/USP. 6 Professor, Central-West College Pinelli Henriques.
DOI: http://dx.doi.org/10.1590/2176-9451.19.5.054-066.oar
» The authors report no commercial, proprietary or financial interest in the products or companies described in this article.
» Patients displayed in this article previously approved the use of their facial and intraoral photographs.
Introdução: o objetivo desse estudo foi obter os valores médios de normalidade das alturas faciais anterior e posterior de 30 jovens mestiços nipo-brasileiros, descendentes de xantodermas e leucodermas, com oclusão normal, com idade média de 14 anos, e verificar a presença ou ausência de dimorfismo entre os sexos. Métodos: elaborou-se um estudo ce-falométrico com as mensurações advindas das análises de Wylie e Johnson, Siriwat e Jarabak, Gebeck, Merrifield e Horn. Resultados: os resultados revelaram a presença de dimorfismo entre os sexos para as variáveis AFAT, AFAI, AFA, AFPT e AFPS. Conclusões: um padrão cefalométrico específico, das alturas faciais anterior e posterior, para os jovens mestiços nipo-brasileiros com oclusão normal, descendentes de xantodermas e leucodermas, foi apresentado e um dimorfismo entre os sexos para cinco das treze variáveis avaliadas foi verificado nessa faixa etária média.
INTRODUCTION
Within the context of contemporary Orthodontics, making accurate diagnosis and prognosis determines whether a clinician can provide patients with the best cost-benefit treatment. Based on principles of effectiveness and efficiency, only one or two treat-ment alternatives best fit patient’s esthetic, functional
and psychological needs.1 Therefore, clinicians must
use all possible resources to achieve this ideal goal on orthodontic practice.
Cephalometry is a valuable auxiliary diagnostic tool as it allows the relationship among bone structures, dental tissue and sot tissue to be determined by means
of lateral radiographs,6 thereby facilitating complete
assessment of malocclusion in diferent space
dimen-sions, including anterior-posterior25 and vertical.30
Analyzing malocclusion this way allows understanding of how and in what direction and manner each ele-ment of the stomatognathic system contributes to its conformation. For this reason,the use of cephalometric analysis is rendered necessary in the anterior-posterior and vertical directions, and so it is to analyze the inlu-ence of vertical changes in the severity of malocclusion
in anterior-posterior direction.23
Vertical facial changes inluence mandibular posi-tion and rotaposi-tion, either clockwise or counterclockwise, thereby contributing to the development of deep or open bite. Thus, orthodontic treatment should induce
desir-able changes and minimize inevitdesir-able undesirdesir-able ones.22
To assess vertical facial changes, new
cephalomet-ric analyses were developed,24 and the present study
uses measurements employed by Wylie and
John-son,30 Siriwat and Jarabak,24 Gebeck,8 Merrifield17
as well as Horn,9 all of which assess anterior and
posterior facial height, facial ratios and facial height index, measurements which were used in previous
studies.5,26 In these studies, cephalometric standards
from different racial and ethnic groups and with mis-cegenation were determined and compared, showing the need for individualization, which has also been
reported in worldwide literature.5,7,13,18,26
The studies found in the literature were devoted to certain groups, such as Caucasians or Mongoloids, but not to the result of their miscegenation. For this reason, explaining the need for individualization and understanding of cephalometric characteristics of different miscegenation patterns is important.
To this end, the following were assessed: Specific cephalometric patterns of anterior and posterior
fa-cial heights; fafa-cial ratios and fafa-cial height index9 for
young Japanese-Brazilian descendants with normal occlusion using variables in the vertical direction of the face. The presence of sexual dimorphism was also assessed.
MATERIAL AND METHODS
A total of 30 lateral cephalometric radiographs of young Japanese-Brazilian descendants (15 males and 15 females with an average age of 14 years) with nor-mal occlusion, selected from elementary and high schools located in the city of Bauru, were assessed. The selected patients had the following characteris-tics: Japanese-Brazilian descendent of parents and/or grandparents from Japan, except for the island of Okinawa, and Caucasian Brazilian parents (Portu-guese, Spanish or Italian ancestry); aged between 11.91 to 16.61 years; with normal occlusion; and no history of previous orthodontic treatment.
All patients had permanent teeth in occlusion, except for third molars. Additionally, they had nor-mal molar relationship, mild or absent crowding, no crossbite, normal overbite and overjet, no differences between mandibular positions in centric relation and maximum intercuspation, and well-balanced faces.
Cephalometric radiographs were obtained accord-ing to the standards recommended by the Depart-ment of Radiology, School of Dentistry/University of São Paulo, Bauru. Radiographic image magnification (using a Siemens equipment) was of 9.8%, corrected during measurements of radiographs so as to increase accuracy of the method employed.
Preparation of cephalograms
Anatomical tracing was carried out according to
the recommendations described by Interlandi11 and
Vion;28 the average of anatomical structures was used
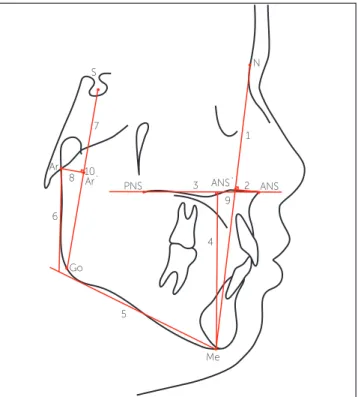
Figure 1 - Cephalometric landmarks, lines and planes.
After performing the anatomical tracing, land-marks were identified and then digitized by the digitizing tablet AccuGrid XNT, model A30TL.F (Numonics Corporation, Montgomeryville, PA, USA). Data were processed using Dentofacial Plan-ner Software, version 7.02 (Dentofacial PlanPlan-ner Software Inc.,Toronto, Ontario, Canada) installed in a PC with 700MHz Intel Pentium III processor.
Cephalometric landmarks, lines and planes
Ater the anatomical tracing was prepared, cephalo-metric landmarks were located according to
Miyashi-ta:19 S (Sella), N (Nasion), ANS (Anterior Nasal Spine),
PNS (Posterior Nasal Spine), Me (Menton), Go (Go-nion) and Ar (Articulare) (Fig 1). Ater locating the cephalometric landmarks that are independent of guid-ance tracing, plans and lines were drawn, and Ar’ and ANS’ points were constructed according to Wylie and
Johnson30 as well as Siriwat and Jarabak24 (Fig 1).
1) N - Me line: The line formed by the union of Nasion (N) and Menton (Me).
2) ANS perp. line: The perpendicular line formed by the union of Anterior Nasal Spine (ANS) and N - Me line.
3) Palatal Plane (PP): The line formed by the union of Anterior Nasal Spine (ANS) and Posterior Nasal Spine (PNS).
4) Me - PP line: The line perpendicular to the Palatal Plane (PP) connecting this plan to the Men-ton (Me).
5) Mandibular Plane (MP): A line which bisects the distance between the left and right mandibular lower borders and connects anteriorly with Men-ton (Me).
6) Ar - MP line: The line connecting the Articu-lare (Ar) point to the Mandibular Plane (MP), touch-ing the posterior border of the mandible branch.
7) S - Go line: The line formed by the union of Sella (S) and Gonion (Go).
8) Ar perp. line: The line formed by the pro-jection of the Articulare (Ar) and perpendicular to S - Go line.
9) ANS’ point (ANS projection point): Point formed by the intersection of ANS perp. line and N - Me line.
10) Ar’ point (Ar projection point): the point formed by the intersection of Ar perp. line and S - Go line.
Cephalometric measurements in vertical direction
The measures taken according to the analysis by
Wylie-Johnson30 are shown in Figure 2.
1) Total Anterior Facial Height (TAFH): Linear distance between Nasion (N) and Menton (Me).
2) Upper Anterior Facial Height (UAFH): Linear distance between points N and ANS’, measured in N - Me line.
3) Lower Anterior Facial Height (LAFH): Linear dis-tance between ANS’ and Me, measured in N - Me line.
4) Ratio of Upper Anterior Facial Height and Total Anterior Facial Height (UAFH/TAFH).
5) Ratio of Lower Anterior Facial Height and Total Anterior Facial Height (LAFH/TAFH).
The measures used according to the Siriwat and
Jarabak24 analysis are shown in Figure 3.
ANS
Me 5
6 8 10
7
3
4 9
2 1
ANS` PNS
S
Ar` Ar
Go
Figure 3 - Measurements assessed, according to Siriwat and Jarabak analysis.24
Figure 4 - Measurements assessed, according to Gebeck, Merrifield and Horn analysis.8,9,17
Figure 2 - Measurements assessed, according to Wylie and Johnson analysis.30
1) Total Posterior Facial Height (TPFH): Linear distance between Sella (S) and Gonion (Go).
2) Upper Posterior Facial Height (UPFH): Lin-ear distance between S and Ar’ (perpendicular pro-jection of Ar), measured in S-Go line.
3) Lower Posterior Facial Height (LPFH): Linear distance between Ar’ and Go, measured in S-Go line.
4) UPFH/TPFH — Ratio of Upper Posterior Fa-cial Height and Total Posterior FaFa-cial Height.
5) LPFH/TPFH — Ratio of Lower Posterior Fa-cial Height and Total Posterior FaFa-cial Height.
The measures used according to the Gebeck8 and
Merrifield17 analysis and also used to determine the
Facial Height Index of Horn9, are shown in Figure 4.
1) Anterior Facial Height (AFH): Perpendicular linear distance between Palatal Plane and Me, mea-sured in Me - PP line.
2) Posterior Facial Height (PFH): Linear distance between Ar and the Mandibular Plane (Go-Me), tangent to the mandibular ramus.
3) Facial Height Index (FHI): Ratio of PFH and AFH, multiplied by 100 (FHI = PFH/AFH x 100)
STATISTICAL METHOD
Descriptive and comparative analyses
Means and standard deviation were used to de-scribe the sample of Japanese-Brazilian descendants. To investigate the existence of sexual dimorphism, t-test with signiicance level set at 0.05 was ap-plied due to normal distribution of variables in the
Kolmogorov-Smirnov test. All statistical analyses were performed using Statistica sotware (Statistica for Win-dows 6.0, Statsot, Tulsa, OK).
Method error
Cephalometric tracings and measurements of 50% of the sample were remade by the same examiner a month after obtaining the initial cephalograms.
Systematic and casual errors were independently assessed for each cephalometric variable, as
recom-mended by Houston.10 Systematic error was
calcu-lated by dependent t-test for paired samples. Casual
error was calculated by Dahlberg’s formula4 using the
standard deviation of differences between repetitions.
RESULTS
Results are divided and presented in tables for didactics purposes and to favor visualization and un-derstanding.
CASUAL AND SYSTEMATIC ERROR
Casual error was determined by Dahlberg’s
for-mula,4 whereas systematic error was assessed by
de-pendent t-test.10 Statistical analysis carried out to
assess intra-examiner error revealed no systematic errors. Casual errors, however, were minimal, since measurements were linear and most of them had a value lower than 1 mm. Only two variables, TAFH and UAFH, yielded slightly higher causal error val-ues: 1.44 mm and 1.25 mm, respectively.
2 2
1
1
3
3 2
CHARACTERIZATION OF THE SAMPLE
The sample comprised 30 Japanese-Brazilian de-scendants, 15 males and 15 females, with mean age of 14 years old — 14.78 years for males and 13.22 years for females, representing an age difference of 1.56 years of which significance was tested and con-firmed by independent t-test set at 5% significance level. Characterization of vertical facial growth pat-tern by means of SN.GoGn variable showed an aver-age of 33.08 degrees (33.02 for males and 33.15 for females), with no statistically significant difference.
SAMPLE COMPARATIVE AND DESCRIPTIVE ANALYSES
Descriptive analysis determined the number of research subjects, means, standard deviations as well as minimum and maximum values of the population necessary for a confidence interval of 95% for each variable considered in the current study (Table 1).
Sexual dimorphism was assessed by means of in-dependent t-test set at 5% significance level. Aver-age male and female data with respective standard deviations and P-values are presented in Table 2.
DISCUSSION
Facial vertical pattern affects facial harmony and attractiveness. In this context, orthodontic treat-ment can favor or disfavor balance by impletreat-ment- implement-ing facial changes in the vertical direction of which
even lay people are aware of.21 Therefore, clinicians
should have an individualized reference20 to conduct
orthodontic treatment in order to induce the desired
changes and minimize undesirable, inevitable ones.2
This study should be viewed as primarily descrip-tive. It aims at demonstrating how the values of young Japanese-Brazilian descendants are incomparable to values previously established for Caucasian and Mongoloid subjects. It also aims at analyzing sexual dimorphism for each variable. Thus, the values de-termined for the variables analyzed herein should be compared to other results previously reported in the literature with a view to further investigate this topic.
This discussion of results is divided into anterior facial height and its ratios, posterior facial height and
its ratios, and Facial Height Index (Horn9). Each of
these sections was divided into sub-sections so as to favor interpretation of results.
ANTERIOR FACIAL HEIGHTS
TAFH — Total anterior facial height
TAFH for Japanese-Brazilian descendants had an average value of 125.90 mm for males and 119.74 mm for females. Statistically significant difference, with significance level set at 5%, was identified between these values, thereby indicating sexual dimorphism with greater vertical development for males.
Variable n Mean ± SD
Min-Max values for a Confidence Interval
of 95%
TAFH 30 122.82 ± 7.54 120.00 – 125.63 UAFH 30 52.52 ± 4.08 50.99 – 54.04 LAFH 30 70.29 ± 4.81 68.49 – 72.09 UAFH/TAFH 30 42.76 ± 1.90 42.05 – 43.47 LAFH/TAFH 30 57.23 ± 1.90 56.52 – 57.94 TPFH 30 81.60 ± 5.47 79.56 – 83.64 UPFH 30 34.47 ± 3.58 33.13 – 35.81 LPFH 30 47.13 ± 3.89 45.67 – 48.58 UPFH/TPFH 30 42.23 ± 3.08 41.07 – 43.48 LPFH/TPFH 30 57.77 ± 3.08 56.61 – 58.92 AFH 30 69.45 ± 4.81 67.65 – 71.24 PFH 30 50.33 ± 4.03 48.83 – 51.84 FHI 30 72.65 ± 6.20 70.33 – 74.97 Table 1 - Descriptive analysis of Japanese-Brazilian descendent sample.
Table 2 - Comparative analysis of male and female Japanese-Brazilian de-scendents.
Variable Mean ± SD Female (n = 15)
Mean ± SD Male
(n = 15) P
TAFH 119.74 ± 4.20 125.90 ± 8.93 0.022* UAFH 51.64 ± 3.66 53.40 ± 4.41 0.243 LAFH 68.10 ± 2.86 72.49 ± 5.42 0.009* UAFH/TAFH 43.10 ± 2.15 42.42 ± 1.62 0.337 LAFH/TAFH 56.89 ± 2.15 57.57 ± 1.62 0.337 TPFH 78.85 ± 3.91 84.36 ± 5.51 0.003* UPFH 32.70 ± 2.45 36.24 ± 3.71 0.004* LPFH 46.14 ± 3.00 48.12 ± 4.50 0.168 UPFH/TPFH 41.48 ± 2.35 42.98 ± 3.60 0.190 LPFH/TPFH 58.51 ± 2.35 57.02 ± 3.61 0.192 AFH 67.38 ± 2.75 71.52 ± 5.58 0.015* PFH 49.51 ± 3.29 51.16 ± 4.62 0.270 FHI 73.48 ± 4.28 71.82 ± 7.74 0.473
This may have been caused by age difference be-tween males and females. However, there is a chrono-logical gap between growth and development of males and females in the phase of adolescence, including the vertical development of the face. Additionally, fe-males in general have their pubertal growth spurt at an earlier age than males. Therefore, growth will likely be more balanced between males and females in this condition, with a mean age difference of 1.56 years during adolescence, particularly because females rep-resented the group with the lower average age.
Simi-lar findings were also reported in other studies.14,26
The values determined for Japanese-Brazilian descendants are close to the highest values found in the literature for Caucasians, but were even closer to
values found for Mongoloids. Ishii et al12 conducted
a study in which significant differences were found between Japanese Mongoloid and British Caucasian groups for both males and females, with the
Mongol-oid group presenting the highest values. Takahashi26
also found significant differences between Caucasian and Mongoloid racial groups, particularly for males, with the largest values found in the Mongoloid group. However, for females, no significant differences were found among racial groups. Additionally, the female Mongoloid group had higher values of TAFH.
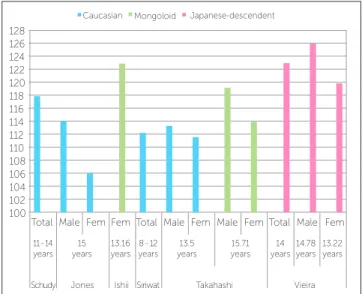
Although the values found in the literature showed great variability for the TAFH variable, in general, the values reported in this study were very close to those found in the literature for
Japa-nese12 and their descendents26 within a similar age
range. Disagreement among some values found in
the literature12,14,23,24,26 explains the large variation
among them (Fig 5).
UAFH — Upper anterior facial height
Young Japanese-Brazilian descendants showed an average UAFH value of 52.52 mm (53.40 mm for males and 51.64 mm for females) with no statisti-cally significant difference at 0.05 significance level between them. Thus, sexual dimorphism was not evident, thereby implying that upper facial height does not contribute to dimorphism found in TAFH.
Results showed no differences between males and
females, confirming the findings by Domiti et al5 and
Locks.15 However, other authors, such as Jones and
Meredith14 as well as Ursi et al27 found a higher value
for the upper anterior facial height for males.
Ad-ditionally, Takahashi26 found a higher value for the
Mongoloid group, but not for the Caucasian one. The values for young Japanese-Brazilian descen-dants are between those found in the literature for
Caucasians,6,27 but once more are closer to those
re-ported by Takahashi26 for the Mongoloid group.
Ishii et al13 showed that the upper anterior facial
height was significantly higher in the Japanese Mon-goloid group in comparison to the British Caucasian
group. Takahashi26 found a significant difference
comparing Caucasian and Mongoloid racial groups for males, but not for females. He also observed higher values for the Mongoloid group when com-paring males and females of both races.
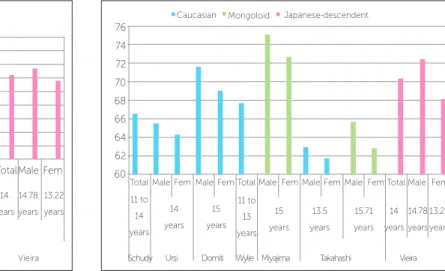
Figure 6 shows the values found in the literature
for UAFH.5,14,23,26,27,29
LAFH — Lower anterior facial height
The mean LAFH values for young Japanese-Brazilian descendants are 70.29 mm, 72.49 mm for males and 68.1 mm for females. Values were statis-tically different for males and females, thereby fea-turing sexual dimorphism and confirming the
find-ings by other authors such as Lock15 and Miyajima.18
However, Domiti et al5 and Takahashi26 found no
differences between males and females for either one
of the two racial groups. Ursi et al27 identified
differ-ences between males and females older than 16 years
Figure 5 - TAFH means. 128
126 124 122 120 118 116 114 112 110 108 106 104 102 100
Total
11 - 14 years
8 - 12 years
13.22 years
Vieira Siriwat
Ishii Jones
Schudy Takahashi
14.78 years 13.5
years
15.71 years
14 years 15
years 13.16 years
Total Total
Male FemFem Male Fem Male Fem Male Fem
with LAFH values higher for males at this age. Sexual dimorphism in the Japanese-Brazilian descendent sample leads us to the conclusion that lower anterior facial height contributed significantly to the dimor-phism found in TAFH.
The values determined for the young Japanese-Brazilian descendants are closely related to the
high-est values found in the literature for Caucasians6
and Mongoloids.18
Ishii et al13 reported that Japanese Mongoloid
individuals have LAFH values significantly higher than British Caucasian individuals, although
Taka-hashi26 found significant differences between
Cau-casian and Mongoloid racial groups, only for males, thereby demonstrating greater LAFH values in the Mongoloid group for both males and females.
Figure 7 shows the values found in the
litera-ture5,18,23,26,27,29 with a large variation for LAFH values.
UAFH/TAFH ratio
Young Japanese-Brazilian descendants showed an average UAFH/TAFH ratio of 42.76%, being 43.10% for females and 42.42% for males, with no statistically significant difference between these values, at 0.05 significance level. Consequently, no sexual dimorphism was evident, corroborating the
findings by Wylie and Johnson,30 as well as
Taka-hashi26 — who did not find a statistically significant
difference between males and females for both study groups at 0.05 significance level.
The values determined for young Japanese-Brazilian descendants are closer to the minimum
value found by Locks16 for Caucasians (42%).
Takahashi26 also found no signiicant diferences
when comparing Caucasian and Mongoloid males and females, thus showing a balance in this ratio.
Figure 8 shows the comparison among values
found in the literature.3,14,16,26,30
LAFH/TAFH ratio
Young Japanese-Brazilian descendents showed an average UAFH/TAFH ratio of 57.23%, being 56.89% for females and 57.57% for males, with no statistically signiicant diference between these values, at a 0.05 signiicance level. Consequently, no sexual dimorphism
was evident, corroborating the indings by Takahashi26
who found no statistically signiicant diference between males and females for both study groups.
The values determined for young Japanese-Brazilian descendants are close to the highest values
found in the literature for Caucasians.16,23
Takahashi26 also found no signiicant diferences
when comparing Caucasian and Mongoloid males and females, thus showing a balance in this ratio.
Figure 9 shows the values found in the literature
for LAFH/TAFH.3,14,16,23,26,30
Figure 6 - Means of UAFH. Figure 7 - Means of LAFH. 58
56 54 52 50 48 46 44 42 40
Caucasian Mongoloid Japanese-descendent
14.78
years 13.22
years 13.22
years 11 to
13 years
15 years
15.71
years 13.5
years
14
years 14 years 11 to 15 years
14 years
Total Total Total Total MaleFem MaleFem MaleFemMaleFem Male Fem
74 76
72 70 68 66 64 62 60
14.78 years 11 to
13
years 15 years
15.71 years 13.5 years
14 years 14
years 15 years 11 to
14 years
TotalMaleFemMaleFemTotalMaleFemMaleFemMaleFemTotalMale Fem Caucasian Mongoloid Japanese-descendent
Vieira Domiti Wylie Jones
Schudy
POSTERIOR FACIAL HEIGHTS TPFH — Total posterior facial height
Young Japanese-Brazilian descendants showed an average TPFH of 81.60 mm, being 84.36 mm for males and 78.85 mm for females, with a statistically significant difference at a 0.05 level, thereby indicat-ing sexual dimorphism with greater development of male posterior facial height. As discussed regarding TAFH dimorphism, it can be inferred that this is not a simple reflection of age difference between males and females. In addition, a similar condition was
re-ported by Takahashi26 for the Mongoloid group,
al-though Chang et al3 did not find this difference.
The values determined for young Japanese-Brazilian descendants are closer to the values found by
Takahashi26 for the Mongoloid group. This author also
found signiicant diferences when comparing Cauca-sian and Mongoloid males and females, and reported
that the Mongoloid group had higher values26.
The values reported in the literature for
TPFH23,24,26 are shown in Figure 10.
UPFH — Upper posterior facial height
The mean UPFH value of young Japanese-Brazilian descendants was 34.47 mm, being 36.24 mm for males and 32.70 mm for females. Values were statistically different for males and females with sig-nificance level set at 0.05. Thus, sexual dimorphism
was characterized with high values for male posterior facial height. The upper portion of the posterior fa-cial height can be inferred to contribute significantly
to the dimorphism found in TPFH. Takahashi26 also
reported the presence of sexual dimorphism for both Caucasian and Mongoloid groups, in addition to a greater vertical development of male upper posterior facial height for both groups.
Takahashi26 also identified significant differences
when comparing Caucasian and Mongoloid racial groups, for males and females, with higher values for Mongoloids. These findings differed from those by
Ishii et al13 who found no difference between
Japa-nese Mongoloid and British Caucasian.
Comparison between values found in this study
and by Takahashi26 indicate greater proximity
be-tween the values of young Japanese-Brazilian de-scendants and Mongoloids, with higher values for the first group, as presented in Figure 11. This find-ing can neither be attributed to differences in meth-odology, which was the same, nor to mean age dif-ference, since the mean age of the Mongoloid group
was greater (15.71 years) in Takahashi’s study26.
However, this finding may be due to the use of a dif-ferent sample, with a slightly more vertical pattern of young Japanese-Brazilian descendants, or because of race miscegenation that generates a new biological and genetic conformation.
Figure 8 - Means of UAFH - TAFH. Figure 9 - Means of LAFH - TAFH. 46
44 45
43 42 41 40
13.22 years
Vieira Wylie Chang
Jones
Locks Takahashi
14.78 years 11 to 13
years 11.1 to
12.8
years
15.71 years 13.5
years
14 years 15
years 8 to 11
years
Total Male Fem Total TotalMaleFem Male Fem Total Male Fem
Vieira WylieSchudyLocksJonesChang Takahashi
11 to 13
years 54 55 56 57 58 59
11 to 14
years 8 to 11
years 15
years
13.5
years
15.71
years 14
years 14.78
years 13.22
years
Total Total Total Total Total Male Male Total
Male Female
Fem Fem
11.1 to
12.8 years
LPFH — Lower posterior facial height
Young Japanese-Brazilian descendants showed an average LPFH value of 47.13 mm, being 48.12 mm for males and 46.14 mm for females. No sexual di-morphism was evident, thereby corroborating the
results by Takahashi26 f r both groups.
Lack of dimorphism in LPFH values of young Japanese-Brazilian descendants inferred that LPFH does not contribute to the dimorphism found in TPFH.
Takahashi26 identified significant differences
when comparing Mongoloid and Caucasian males and females, with the Mongoloid group show-ing higher values. The values of young Japanese-Brazilian descendants are closer to the maximum
values obtained with Caucasians,23 and even closer
to the values reported for Mongoloids.12,26 This
con-dition is well characterized in F igure 12.
UPFH/TPFH ratio
Young Japanese-Brazilian descendants showed an average UPFH/TPFH ratio of 42.23%, being 42.98% for males and 41.48% for females, with no statisti-cally significant difference at a 0.05 significance level. Therefore, no sexual dimorphism was observed. This
result corroborates the findings by Takahashi26 for
the Mongoloid group, although this author reported sexual dimorphism with higher UPFH/TPFH ratios for males in the Caucasian group.
Takahashi26 found no significant difference when
comparing Caucasian and Mongoloid males and fe-males. The values for young Japanese-Brazilian
de-scendants are close to those reported by Takahashi,26
as shown in Figure 13, despite age difference and the use of a different sample with its own racial misce-genation. The cause may be stability of values for this variable after a certain age and a small variation between different races and their miscegenations.
LPFH/TPFH ratio
Young Japanese-Brazilian descendants showed an average LPFH/TPFH value of 57.77%, being 57.02% for males and 58.51% for females. The lack of
dimor-phism in these results corroborates Takahashi26 for
the Mongoloid group, although this author report-ed sexual dimorphism in the Caucasian group with higher LPFH/TPFH values for females.
Takahashi26 found no significant differences when
comparing Mongoloid and Caucasian males and females. The values for young Japanese-Brazilian descendants are close to those reported by
Taka-hashi26 for the two groups, as shown in Figure 14.
Determining the facial height index (FHI)
Horn9 proposed a variable to track patient’s
ver-tical dimension during treatment. The proposed index is calculated by dividing the posterior facial height (PFH, the distance in millimeters from point
Figure 10 - Means of TPFH. Figure 11 - Means of UPFH. 77
79 81 83 85 87
73 75 71 69 67 65
13.22
years
Vieira Schudy Takahashi
14.78
years 11 to 14
years
15.71
years 13.5
years
14
years 8 to 12
years
Siriwat
Total Total
Male Fem Male Fem Male Fem Male Fem
37
33 35
31 29 27 25
13.22
years
Vieira Takahashi
14.78
years 15.71
years 13.5
years
14 years
Total
Male Fem Male Fem Male Fem
Figure 12 - Means of LPFH. Figure 13 - Means of UPFH - TPFH.
Ar to the mandibular plane) and the anterior facial height (AFH) (the distance in millimeters from the palatal plane to the point Me). According to the
author, the use of the facial height index9 is an
ad-ditional aid in the diagnosis of excess or reduced vertical dimension, allowing observation of vertical dimension during treatment and adjustment of orth-odontic mechanics to offset any unfavorable trend.
AFH — Anterior facial height
The mean AFH value of young Japanese-Brazilian descendants was 69.45 mm, being 71.52 mm for males and 67.38 mm for females. Sexual dimorphism
38 40 42 44 46 48 50
36
13.22 years
Vieira Schudy Takahashi
14.78 years 14 years 11 to 14
years years13.16 years13.5 years15.71
Ishii
Total Fem Male Fem Male Fem Total Male Fem
44 45
43 42 41 40
13.5 years
Takahashi Viera
15.71 years
14 years
14.78 years
13.22 years
Total
Male Fem Male Fem Male Fem
Caucasian Mongoloid Japanese-descendent
Caucasian Mongoloid Japanese-descendent
Figure 14 - Means of LPFH - TPFH. Figure 15 - Means of AFH. 59
60
58 57 56 55 54
13.5 years
Takahashi Viera
15.71 years 14 years 14.78 years 13.22 years
Total
Male Fem Male Fem Male Fem
11
years
12 to 15
years
13.5
years
Viera Takahashi
Merriield Horn
55 60 65 70 75 80
15.71
years 14
years 14.78
years 13.22
years
Total Total Male Fem Male Fem Male Fem Total Male Fem
Caucasian Mongoloid Japanese-descendent
Caucasian Mongoloid Japanese-descendent
was identified, with larger vertical development of the male group. This result appears to be consistent with LAFH and TAFH values and also corroborates
the findings by Takahashi26 in the Mongoloid group,
with more vertical development of the anterior facial height of males, although the same author reported the absence of dimorphism in the Caucasian group.
The values determined for young Japanese-Bra-zilian descendants are closer to the maximum values
found in the literature for Caucasians,9,17 and closer
to the values reported by Takahashi26 for the
Figure 16 - Means of PFH. Figure 17 - Means of FHI.
Takahashi26 identified significant differences
when comparing Caucasian and Mongoloid males, and found no significant differences among racial groups for females. The same author also reported that, with regard to both males and females, Mon-goloids had higher values than Caucasians.
PFH — Posterior facial height
The mean PFH value of young Japanese-Brazilian descendants was 50.33 mm, being 51.16 mm for males and 49.51 mm for females. No sexual dimor-phism was found with these results, similar to what
was observed in Takahashi’s26 study for both
Mon-goloid and Caucasian groups.
The values determined for young Japanese-Brazilian descendants are close to those found in the literature for
Caucasians17 and even closer to those reported for the
Mongoloid group.26 Takahashi26 also reported
signii-cant diference when comparing Caucasian and Mon-goloid males and females. The variation in PFH values
found in the literature9,17 is shown in Figure 16.
FHI — Facial Height Index (Horn9)
The mean FHI value for Japanese-Brazilian
descendants (Horn9) was 72.65%, being 71.82% for
males and 73.48% for females. No sexual dimor-phism was found, thereby corroborating the results by
Takahashi26 for the Mongoloid group, although this
au-thor reported sexual dimorphism in the Caucasian group. A small variation in FHI values was observed in the
literature,9,23,26 as shown in Figure 17. For this variable,
the results of the present study were similar to those
reported by Takahashi26 for Caucasians and
Mongol-oids. He also reported signiicant diferences between Caucasian males, but not for females.
Results for young Japanese-Brazilian descen-dants showed, in general, that the values of variables and the analysis of sexual dimorphism — particu-larly when compared with those reported by
Taka-hashi26 — suggested a closer relationship between
the values of Japanese-Brazilian descendants and the Mongoloid group for all variables except for the ratios UAFH / TAFH, LAFH / TAFH, UPFH / TPFH, and LPFH / TPFH as well as FHI. Thus, further compari-son between young Japanese-Brazilian descendants, Caucasians and Mongoloids should be performed in a study with the specific objective of precisely estab-lishing the relationship between these groups.
Moreover, the analysis of sexual dimorphism of young Japanese-Brazilian descendants suggests a more vertical pattern for males, characterized by higher values in the variables TAFH, LAFH, AFH, TPFH and UPFH. However, the variables denoting vertical facial ratio do not show the same trend.
50 52
48 46 44 42 40
12 to 15 years
Takahashi Merriield
Horn Viera
13.5 years 11
years
15.71 years 14.78 years 14 years 13.22
years
Total
Total Total Male Fem Male Fem Male Fem
74 76
72 70 68 66 64
11 to 14
years
Takahashi Schudy
Horn Viera
13.5 years 11
years
15.71 years 14.78
years 14 years 13.22
years
Total
Total Total Male Fem Male Fem Male Fem
CLINICAL CONSIDERATIONS
Vertical facial changes inluence mandibular posi-tion and rotaposi-tion, either clockwise or
counterclock-wise,22,23 thereby contributing to the development
of deep bite or open bite, and potentially increas-ing the severity of anterior-posterior malocclusion. Thus, orthodontic treatment should induce desirable alterations and minimize the undesirable ones when
the latter are inevitable.2
Therefore, malocclusion should be analyzed com-pletely and in all diferent dimensions of space so as to favor understanding of how and in what direction each element of the stomatognathic system contributes to the conformation of malocclusion, which is necessary for cephalometric analysis of anterior-posterior and vertical directions, as well as analysis of the inluence of vertical
changes in the severity of antero-posterior malocclusion.23
However, the literature indicates that malocclusion analysis requires full assessment so as to individualize cephalometric norms regarding patient’s sex, age and
race.20 Thus, cephalometric standards from diferent
ethnic and racial groups and miscegenations were deter-mined and compared, and the need for individualization
for each speciic group was demonstrated5,7,18,20,26 to
better understand and assess the cephalometric char-acteristics of diferent groups and miscegenations with respect to orthodontic diagnosis and planning. Thus, the present study provides the clinician with a more speciic reference in the vertical direction of the face, particularly for young Japanese-Brazilian descendants with normal occlusion.
Moreover, as a topic for future research, the val-ues of Japanese-Brazilian descendants should be compared with those of other subjects, particularly Mongoloid and Caucasian Brazilians.
CONCLUSIONS
Based on the sample and methods employed herein, values are presented to establish a cepha-lometric pattern of anterior and posterior facial heights and its ratios, as well as the facial height
index (Horn9) for young Japanese-Brazilian
1. Ackerman M. Evidence-based orthodontics for the 21st century. J Am Dent Assoc. 2004;135(2):162-7.
2. Ahn JG, Schneider BJ. Cephalometric appraisal of posttreatment vertical changes in adult orthodontic patients. Am J Orthod Dentofacial Orthop. 2000;118(4):378-84.
3. Chang HP, Kinoshita Z, Kawamoto T. A study of the growth changes in facial coniguration. Eur J Orthod. 1993;15(6):493-501.
4. Dahlberg G. Statistical methods for medical and biological students. New York: Interscience; 1940.
5. Domiti SS, Daruge E, Cruz VF. Variability of the nasion-subnasal, subnasal-gnathion, and bizygomatic distances of individuals of 6, 7, 11, and 15 years of age and their importance in the determination of the vertical dimension. Aust Dent J. 1976;21(3):269-71.
6. Downs WB. The role of cephalometrics in orthodontic case analysis and diagnosis. Am J Orthod. 1952;38(3):162-82.
7. Freitas LM, Pinzan A, Janson G, Freitas KM, Freitas MR, Henriques JF. Facial height comparison in young white and black Brazilian subjects with normal occlusion. Am J Orthod Dentofacial Orthop. 2007;131(6):706.e1-6.
8. Gebeck TR. Analysis: concepts and values. Part I. J Charles H Tweed Int Found. 1989;17:19-48.
9. Horn AJ. Facial height index. Am J Orthod Dentofacial Orthop. 1992;102(2):180-6.
10. Houston WJB. The analysis of errors in orthodontic measurements. Am J Orthod. 1983;83(5):382-90.
11. Interlandi S. O cefalograma padrão do curso de pós-graduação de Ortodontia da Faculdade de Odontologia da USP. Rev Fac Odont Bauru. 1968;6(1):63-74. 12. Ishii N, Deguchi T, Hunt NP. Craniofacial morphology of Japanese girls with
Class II division 1 malocclusion. J Orthod. 2001;28(3):211-5.
13. Ishii N, Deguchi T, Hunt NP. Morphological diferences in the craniofacial structure between Japanese and Caucasian girls with Class II division 1 malocclusions. Eur J Orthod. 2002;24(1):61-7.
14. Jones BH, Meredith HV. Vertical change in osseous and odontic portions of human face height between the ages of 5 and 15 years. Am J Orthod. 1966;52(12):902-21.
15. Locks A. Análise das proporções verticais anteriores da face de indivíduos brasileiros, portadores de oclusão excelente e peril agradável [mestrado]. Rio de Janeiro (RJ): Universidade Federal do Rio de Janeiro; 1981.
REFERENCES
16. Locks A. Estudo cefalométrico das alturas faciais anterior e posterior, em crianças brasileiras, portadoras de má-oclusão Classe I de Angle, na fase de dentadura mista [tese]. Araraquara (SP): Universidade Estadual Paulista; 1996. 17. Merriield LL. Analysis: concepts and values. Part II. J Charles H Tweed Int Found.
1989;17:49-64.
18. Miyajima K, McNamara JA Jr, Kimura T, Murata S, Iizuka T. Craniofacial structure of Japanese and European-American adults with normal occlusions and well-balanced faces. Am J Orthod Dentofacial Orthop. 1996;110(4):431-8. 19. Miyashita K. Contemporary cephalometric radiography. Tokyo: Quintessence;
1996.
20. Pinzan A. “Upgrade” nos conceitos da interpretação das medidas cefalométricas. In: Dominguez GC, organizador. Nova visão em ortodontia, ortopedia funcional dos maxilares. 1a ed. São Paulo: Ed. Santos; 2006. v. 1, p. 41-9.
21. Romani KL, Agahi F, Nanda R, Zernik JH. Evaluation of horizontal and vertical diferences in facial proiles by orthodontists and lay people. Angle Orthod. 1993;63(3):175-82.
22. Schudy FF. Vertical versus anteroposterior growth as related to function and treatment. Angle Orthod. 1964;34(2):75-93.
23. Schudy FF. The rotation of the mandible resulting from growth: its implications in orthodontic treatment. Angle Orthod. 1965;35(1):36-50.
24. Siriwat PP, Jarabak JR. Malocclusion and facial morphology: is there a relationship? An epidemiologic study. Angle Orthod. 1985;55(2):127-38. 25. Steiner C. Cephalometrics in clinical practice. Angle Orthod. 1959;29(1):8-29. 26. Takahashi R. Determinação cefalométrica das alturas faciais anterior e posterior,
em jovens brasileiros, descendentes de xandodermas e leucodermas, com oclusão normal [tese]. Bauru (SP): Universidade de São Paulo; 2002. 27. Ursi WJ, Trotman CA, McNamara JA Jr, Behrents RG. Sexual dimorphism in
normal craniofacial growth. Angle Orthod. 1993;63(1):47-56. 28. Vion PE. Anatomia cefalométrica. São Paulo: Ed. Santos; 1994.
29. Wylie WL. The relationship between ramus height, dental height and overbite. Am J Orthod. 1946;32(2):57-67.