Rapid maxillary expansion effects: An alternative
assessment method by means of cone-beam tomography
Camilo Aquino Melgaço1, José Columbano Neto2, Estela Maris Jurach3,
Matilde da Cunha Gonçalves Nojima4, Eduardo Franzotti Sant’Anna4, Lincoln Issamu Nojima4
Introduction: This study aims to develop a method to assess the changes in palatal and lingual cross-sectional areas in patients submitted to rapid maxillary expansion (RME). Methods: The sample comprised 31 Class I malocclusion individuals submitted to RME and divided into two groups treated with Haas (17 patients) and Hyrax (14 patients) ex-panders. Cone-beam computed tomography scans were acquired at T0 (before expansion ) and T1 (six months after screw stabilization). Maxillary and mandibular cross-sectional areas were assessed at first permanent molars and first premolars regions and compared at T0 and T1. Mandibular occlusal area was also analyzed. Results: Maxillary cross-sectional areas increased in 56.18 mm2 and 44.32 mm2 for the posterior and anterior regions. These values were smaller for the mandible,
representing augmentation of 40.32 mm2 and 39.91 mm2 for posterior and anterior sections. No differences were found
when comparing both expanders. Mandibular occlusal area increased 43.99mm2 and mandibular incisors proclined.
In-crements of 1.74 mm and 1.7 mm occurred in mandibular intermolar and interpremolar distances. These same distances presented increments of 5.5 mm and 5.57 mm for the maxillary arch. Conclusion: Occlusal and cross-sectional areas increased significantly after RME. The method described seems to be reliable and precise to assess intraoral area changes.
Keywords:Orthodontics. Malocclusion. Palatal expander.
How to cite this article: Melgaço CA, Columbano Neto J, Jurach EM, Nojima MCG, Sant’Anna EF, Nojima LI. Rapid maxillary expansion effects: An alternative as-sessment method by means of cone-beam tomography. Dental Press J Orthod. 2014 Sept-Oct;19(5):88-96. DOI: http://dx.doi.org/10.1590/2176-9451.19.5.088-096.oar
» Patients displayed in this article previously approved the use of their facial and in-traoral photographs.
Contact address: Camilo Aquino Melgaço
Rua Espírito Santo, 1111 ‒ Centro ‒ Belo Horizonte/MG — Brazil CEP: 30160-031 ‒ E-mail: [email protected]
» The authors report no commercial, proprietary or financial interest in the products or companies described in this article.
Submitted: June 14, 2013 - Revised and accepted: October 01, 2013 1 Professor, Rio Verde Valley University (UNINCOR).
2 Assistant professor, São José College.
3 Assistant professor, Federal University of Santa Maria (UFSM).
4 Adjunct professor, Federal University of Rio de Janeiro (UFRJ).
Introdução: o presente estudo teve como objetivo desenvolver um método para avaliar as mudanças nas áreas transversais palatinas e linguais em pacientes submetidos à expansão rápida da maxila (ERM). Métodos: a amostra foi composta por 31 indivíduos com má oclusão Classe I de Angle, submetidos a ERM e divididos em dois grupos, tratados com expanso-res tipo Haas (17 pacientes) e de Hyrax (14 pacientes). Tomografias computadorizadas de feixe cônico foram adquiridas em T0 e T1 (antes da expansão e seis meses após a estabilização do parafuso). Áreas transversais da maxila e mandíbula foram avaliadas nas regiões de primeiros molares permanentes e pré-molares e comparadas entre T0 e T1. A área oclusal mandibular também foi analisada. Resultados: as áreas transversais maxilares aumentaram 56,18mm2 e 44,32mm2 para
regiões posterior e anterior, respectivamente. Esses valores foram menores para mandíbula, representando aumentos de 40,32mm2 e de 39,91mm2 para as seções anterior e posterior. Não foram encontradas diferenças quando se comparam
os dois expansores. A área oclusal mandibular aumentou 43,99mm2 e incisivos inferiores vestibularizaram. Incrementos
de 1,74mm e 1,7mm ocorreram entre as distâncias intermolares e interpré-molares inferiores. Essas mesmas distâncias apresentaram incrementos de 5,5mm e de 5,57mm para maxila. Conclusão: as áreas transversais avaliadas e oclusal de mandíbula aumentaram significativamente após a ERM. O processo descrito parece ser um método confiável e preciso para avaliar as mudanças das área intrabucais propostas.
INTRODUCTION
Midpalatal suture in the maxilla might be split by rapid maxillary expansion (RME), a method irst de-scribed in 1860.2 Many studies based on linear and
an-gular analyses conirm the dentoalveolar and skeletal changes induced by this procedure.10,11,24,34 Increased
maxillary transverse dimension is key not only to achieve space gain for teeth alignment, but also to improve sto-matognathic functions, such as nasal cavity enlarge-ment, and favor better tongue position.1,11,12,13,24 When
compared to normal arches, patients with maxillary constriction have their tongue in a lower position.11
Ex-pansion of mandibular arch widths is also observed ater
RME.1,11,13 In these cases, altered dental contacts could
incline posterior mandibular teeth buccally.10,13,15,16
Long-term outcomes indicate spontaneous mandibular arch response in Class I malocclusion patients treated with RME only, thereby showing clinical stability and signiicant augmentation of mandibular intermolar and intercanine widths.24,27,28,32
Two types of expanders are most commonly used. Because the tooth-tissue borne expander (Haas) has an acrylic pad in contact with the palate, it distrib-utes expanding forces along posterior teeth and the palatal vault. Conversely, the tooth-borne expand-er (Hyrax) does not have this acrylic pad and, for this reason, it only presumably delivers forces to the maxilla by means of appliance-supporting teeth.6
Some authors reported similar effects for both Haas and Hyrax expanders; however, other studies sug-gest less teeth inclination when tooth-tissue borne expander is used.6,7,14,29,30,35 Nowadays, highly
devel-oped techniques based on tomographic images and 3D models are available and used to assess morpho-logical changes of the dentofacial complex.9,20,30,33
However, the impact of RME treatment on intraoral space gain has not been fully explored.30,33
This study aimed at developing a method to as-sess palatal and lingual cross-sectional changes in Class I malocclusion patients submitted to RME.
MATERIAL AND METHODS
A total of 467 adolescents from ive high schools of Belo Horizonte/Brazil were examined for potential RME treatment. In selecting the sample, the follow-ing inclusion criteria were applied: Angle Class I mal-occlusion; clinical need for rapid maxillary expansion
visually determined by excessive palatal crown inclina-tion of posterior maxillary teeth; no posterior or an-terior crossbite; good oral health conditions (no peri-odontal disease or tooth decay); clinically healthy tem-poromandibular joints with normal range of motion; and no functional deviations. The exclusion criteria were: Congenitally missing teeth; craniofacial defor-mity; systemic diseases; history or evidence of disk dis-placement, pain or joint noises. Permanent dentition without previous orthodontic treatment was required for both arches (except for third molars).
Initial sample comprised 58 individuals; howev-er, only 34 patients with average age of 12 years and 10 months for girls and 13 years for boys, with active facial growth (posteriorly conirmed by cervical verte-bral maturation method24), started the treatment. The
sample was randomly and equally divided into Group I (Haas) and Group II (Hyrax). Cone-beam computed tomography (CBCT) was taken before adaptation of expanders (T0) and 6 months ater screw stabilization (T1). During the retention period, three patients were eliminated from the study due to premature appliance removal; therefore, 17 patients remained in Group I while 14 patients remained in Group II with a total sample comprising 31 individuals. This project was approved by the Federal University of Rio de Janeiro Institutional Review Board (no. 35/2010 process no.
62/2009). An informed consent form was signed by all patients’ parents or guardians.
The same laboratory manufactured all appliances using 11-mm screws (Dental Morelli, São Paulo, Brazil). All first premolars and first molars were banded and received 1.0-mm stainless steel wires welded to the palatal and buccal surfaces of bands. During the first activation phase, the screws were opened 0.8 mm (a complete turn). Subsequently, activations were based on the same protocol adopted by several authors12,18,25,31 and consisted of a quarter
of a turn (0.2 mm) in the morning and a quarter of a turn in the evening. The screws were stabilized when the tip of the palatal cusps of the maxillary permanent first molars contacted the tip of buccal cusps of the mandibular permanent first molars, as determined by clinical observation.
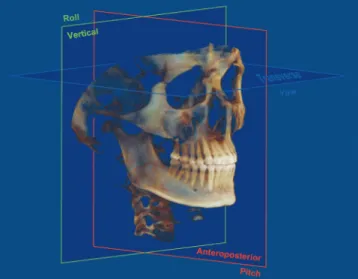
Figure 1 - Head orientation based on axial, coronal and sagittal planes.
and mid-sagittal planes were oriented parallel and perpendicular to the floor, respectively. The same equipment (i-CAT, Imaging Sciences International, Hatfield, PA, USA) was used according to a stan-dard protocol (120 KVp, 5 mA, FOV = 13 x 17, voxel = 0.4 mm and scan time = 20 sec). Data were export-ed in DICOM (Digital Imaging and Communication in Medicine) format and imported into Dolphin Im-aging software® (version 11.0 - Dolphin Imaging &
Management Solutions, Charsworth, CA, USA) so as to reconstruct 3D images for further analysis.
Ater images were obtained, the following land-marks were established: Maxilla — tip of irst premolars palatal cusps and irst permanent molars mesio-palatal cusps. Mandible — the center mesio-distal width of the incisal border of four incisors, tips of both canines, buccal cusps of all premolars, tips of irst permanent molars mesio-buccal and middle cusps.
In order to enable comparison at different times, all images were equally positioned at T0 and T1. The palatal plane (line connecting posterior nasal spine and anterior nasal spine) and mandibular plane (line tangent to the right inferior border of the mandible) were used as basis for all maxillary and mandibular measurements. Head roll orientation was based on the transverse plane intersecting the right and left frontozygomatic sutures. Head yaw orientation was based on vertical plane tangent to the posterior bor-der of both external acoustic meatus (Fig 1).
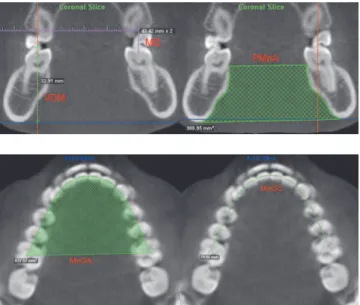
To determine the following maxillary mea-sures, head pitch orientation was based on palatal plane horizontally oriented: (1) intermolar dis-tance (MD), linear distance between right and left tips of first permanent molars mesio-palatal cusps; (2) vertical displacement of molars (VDM), vertical distance between the tips of first permanent molars mesio-palatal cusps and the palatal plane; (3) inter-premolar distance (PMD), linear distance between right and left tips of first premolars palatal cusps; (4) vertical displacement of premolars (VDPM), vertical distance between the tips of first premo-lars palatal cusps and the palatal plane; (5) posterior maxillary cross-sectional area (PMA), obtained at first molars region. Coronal image slice showing the tips of mesio-palatal cusps was used. The area was delimited by a line connecting right and left pala-tal alveolar crests contouring the palapala-tal vault; (6)
anterior maxillary cross-sectional area (AMA), the region of first premolars, the same method described for PMA was used.
Figure 3 - A) Mandibular measures: (MD) intermolar distance; (VDM) vertical displacement of molars and (PMnA) posterior mandibular cross-sectional area. The same measures were performed for premolars. B) Mandibular oc-clusal area (MnOA) and mandibular ococ-clusal contour (MnOC).
Figure 2 - Maxillary measures: (MD) intermolar distance; (VDM) vertical displacement of molars and (PMA) posterior maxillary cross-sectional area. The same measures were performed for premolars.
connecting all lower dental landmarks; (14) mandibu-lar occlusal contour (MnOC), linear connection of all mandibular dental landmarks, using the same axial im-age slice described for MnOA; (15) incisor mandibular plane angle (IMPA), the angle formed by long axis of the right mandibular central incisor and the mandibu-lar plane (Figs 3A and B).
All measures were compared at T0 and T1. In order to determine reliability and reproducibility, the same examiner used the same protocol to measure three patients, three times with a one-week interval in be-tween. Intraclass correlation coefficient (ICC) was used to determine measurement consistency. Un-paired Student’s t-test was used to compare the dif-ferences between both expanders (Haas and Hyrax) while paired Student’s t-test was used to compare the results at T0 and T1. Significance level was set at 5%.
RESULTS
A high ICC value of 0.963 was found, thereby in-dicating great measurement precision and reliability. Comparison between Group I and Group II at T0 and T1 is shown in Table 1. No statistically significant dif-ferences were found when comparing the main effects of Haas and Hyrax expanders. Thus, the rest of the analysis considered the total sample of 31 individuals.
Maxillary intermolar and interpremolar distances increased 5.5 mm and 5.57 mm, respectively. Similar-ly, mandibular intermolar and interpremolar distances
increased 1.74 mm and 1.7 mm. Although these varia-tions were smaller for lower teeth, they were statisti-cally signiicant. All irst molars and irst premolars underwent extrusion movements with average values of 0.15 mm (upper teeth) and 0.78 mm (lower teeth). However, these movements were statistically signii-cant only for mandibular teeth.
All areas augmented signiicantly. PMA and AMA increased 56.18 mm2 and 44.32 mm2, respectively.
40.32 mm2 and 39.91 mm2. MnOA and MnOC
in-creased 43.99 mm2 and 1.35 mm. On average,
man-dibular incisors proclined 1.23o. The mean values,
standard deviations, diferences and signiicances for all maxillary and mandibular measures are shown in Tables 2 and 3.
DISCUSSION
Intraclass correlation coeicient can be used to de-termine consistency, reliability and reproducibility of
quantitative measurements performed by the same or diferent observers. ICC values greater than 0.75 indi-cate excellent reproducibility.19,21,25 The high value of
ICC (0.963) found in this study indicates great mea-surement reliability and precision. Similar values were described by other authors,17,22,23 thereby indicating
in-traoperator reliability. The high precision of the sot-ware measurement tools used, associated with image quality, examiner experience and absence of blurring of anatomic structures21 justify these indings.
T1 T0
Group I Group II Group I Group II
Mean ± SD Mean ± SD Sig. P
value Mean ± SD Mean ± SD
Sig. P value
Mandible
MD1 45.32 ± 2.99 44.45 ± 2.87 0.33 46.86 ± 3.13 46.46 ± 2.98 0.19
PMnA2 931.47 ± 97.94 919.75 ± 97.36 0.26 971.31 ± 142.95 961.12 ± 87.70 0.22
PMD1 33.27 ± 1.67 33.65 ± 3.45 0.12 35.72 ± 3.12 34.71 ± 2.72 0.11
AMnA2 746.66 ± 123.80 738.81 ± 117.25 0.30 787.05 ± 145.28 776.59 ± 100.33 0.27
MnOA2 1006.42 ± 83.95 991.37 ± 62.18 0.29 1045.94 ± 103.80 1033.76 ± 91.21 0.37
MnOC1 83.62 ± 4.36 82.92 ± 4.15 0.65 84.79 ± 4.32 84.52 ± 4.28 0.86
IMPA3 92.88 ± 4.72 91.97 ± 5.77 0.87 93.43 ± 4.55 94.38 ± 5.40 0.75
Maxilla
MD1 39.80 ± 2.89 39.79 ± 1.99 0.61 45.41 ± 2.66 45.13 ± 2.10 0.58
PMA2 344.14 ± 57.91 341.12 ± 46.14 0.13 400.14 ± 58.86 397.74 ± 53.35 0.12
PMD1 29.61 ± 2.43 28.95 ± 2.84 0.16 34.91 ± 2.40 35.30 ± 2.65 0.17
AMA2 221.77 ± 59.11 223.39 ± 41.86 0.63 267.13 ± 63.49 265.82 ± 67.82 0.69
Table 1 - Comparison of the main measures of Group I and Group II. Mean values, standard deviations and significances at T0 and T1.
S.D. – standard deviation. Sig. – significance P≤ 0.05. 1 – values in millimeters. 2 – values in square millimeters. 3– values in degrees.
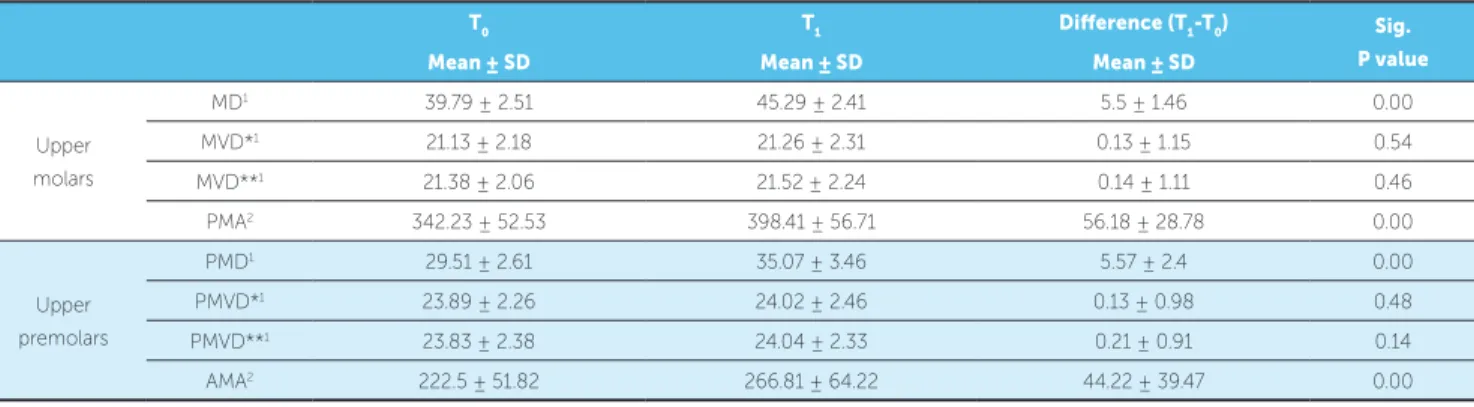
Table 2 - Mean values, standard deviations, differences and significances for all maxillary measures at T0 and T1.
S.D. = standard deviation. Sig. = significance P ≤ 0.05. * right side / ** left side. 1 – values in millimeters. 2 – values in square millimeters.
T0 T1 Diference (T1-T0) Sig.
P value
Mean ± SD Mean ± SD Mean ± SD
Upper molars
MD1 39.79 ± 2.51 45.29 ± 2.41 5.5 ± 1.46 0.00
MVD*1 21.13 ± 2.18 21.26 ± 2.31 0.13 ± 1.15 0.54
MVD**1 21.38 ± 2.06 21.52 ± 2.24 0.14 ± 1.11 0.46
PMA2 342.23 ± 52.53 398.41 ± 56.71 56.18 ± 28.78 0.00
Upper premolars
PMD1 29.51 ± 2.61 35.07 ± 3.46 5.57 ± 2.4 0.00
PMVD*1 23.89 ± 2.26 24.02 ± 2.46 0.13 ± 0.98 0.48
PMVD**1 23.83 ± 2.38 24.04 ± 2.33 0.21 ± 0.91 0.14
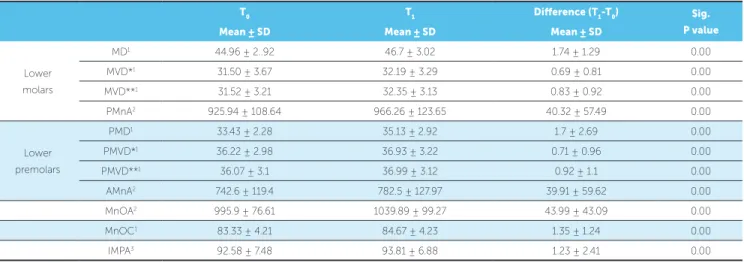
Table 3 - Mean values, standard deviations, differences and significances for all mandibular measures at T0 and T1.
S.D. = standard deviation. Sig. = significance P≤ 0.05. * right side \ ** left side. 1 – values in millimeters. 2– values in square millimeters. 3– values in degrees.
T0 T1 Diference (T1-T0) Sig.
P value
Mean ± SD Mean ± SD Mean ± SD
Lower molars
MD1 44.96 ± 2..92 46.7 ± 3.02 1.74 ± 1.29 0.00
MVD*1 31.50 ± 3.67 32.19 ± 3.29 0.69 ± 0.81 0.00
MVD**1 31.52 ± 3.21 32.35 ± 3.13 0.83 ± 0.92 0.00
PMnA2 925.94 ± 108.64 966.26 ± 123.65 40.32 ± 57.49 0.00
Lower premolars
PMD1 33.43 ± 2.28 35.13 ± 2.92 1.7 ± 2.69 0.00
PMVD*1 36.22 ± 2.98 36.93 ± 3.22 0.71 ± 0.96 0.00
PMVD**1 36.07 ± 3.1 36.99 ± 3.12 0.92 ± 1.1 0.00
AMnA2 742.6 ± 119.4 782.5 ± 127.97 39.91 ± 59.62 0.00
MnOA2 995.9 ± 76.61 1039.89 ± 99.27 43.99 ± 43.09 0.00
MnOC1 83.33 ± 4.21 84.67 ± 4.23 1.35 ± 1.24 0.00
IMPA3 92.58 ± 7.48 93.81 ± 6.88 1.23 ± 2.41 0.00
In the present study, Haas and Hyrax expanders yielded similar results. The effects of RME seems to be similar regardless of the expansion appliance.4,26
The skeletal and dentoalveolar effects produced by these appliances have been the main focus of many studies;4,6,7,11-14,19,26,29,30,32,35 however, when compared
to Hyrax, it is assumed that Haas produces more skel-etal effects with less teeth inclination.6,7,14 This fact is
possibly explained by the presence of the acrylic pad that distributes force through the maxilla, inducing orthopedic modification and remodeling the alveolar processes.7,14,11,29 The main purpose of this study was
not simply compare expanders, but investigate intra-oral space gains after RME. However, no statistically significant differences were observed when Haas and Hyrax linear measures and cross-sectional space gains were assessed, as shown in Table 1. Nevertheless, these results are based only on quantitative analyses. Qualitative assessments could probably reveal differ-ent results based on the superimpositions of Haas and Hyrax cross-sectional images.
Some linear measurements were taken to fa-vor interpretation and understanding of alterations. Intermolar and interpremolar distances increased in both the maxilla and mandible. However, maxilla presented the highest values: 5.5 mm for molars and 5.57 mm for premolars. Expander rigidity assures no lexion or deformation during activation or retention.31
Consequently, more signiicant movement would be
expected in anchorage teeth, as stated by other au-thors.6,14,30 As for the mandible, increases of 1.74 mm
and 1.7 mm were observed for intermolar and interpre-molar distances. These values are in accordance with those found in other studies24,28 and could be explained
by the changes in occlusal contacts ater RME. These contacts induce additional loading of the buccal cusps of mandibular teeth, causing expansion and uprighting movements.10,13,15,16,24 Another plausible explanation is
associated with oral muscles. During RME, the buc-cinator is laterally dislocated and the internal presence and function of the tongue could buccally tip posterior teeth, thereby contributing to mandibular interdental distances augmentation.12
Maxillary dental extrusion is a common effect related to RME.5,12,13,35 In this study, all first
mo-lars and first premomo-lars underwent extrusion move-ments, as observed in Tables 2 and 3. However, the amount of maxillary teeth extrusion was not statisti-cally significant and expanders rigidity could again explain this effect.31 This result is in accordance
with Garib et al7 who compared 3 groups of patients
(Group 1, treated with Haas and Hyrax expanders followed by edgewise therapy; Group 2, treated only with edgewise therapy; Group 3, control group) and found no vertical differences in facial height, max-illary first molars extrusion and overbite. Lione Franchi and Cozza26 conducted a systematic review
and concluded that the vertical changes observed af-ter treatment are small and probably transitory. In contrast, mandibular first molars and first premolars presented significantly extrusion. As most patients were in cervical vertebral stage 3 (CVS3),3
indicat-ing that active growth was in progress, molars and premolars uprighting movements and dentoalveolar vertical growth could have influenced these results.
A statistically significant increase in maxillary and mandibular cross-sectional areas was observed after RME. With regard to the maxilla, the gain obtained for PMA and AMA was 16.42% and 19.92%, respec-tively (Table 2). In this study, maxillary separation occurred in all patients, since a gap between maxil-lary central incisors appeared in all cases. Therefore, these maxillary variations reflect not only alveolar changes resulting from bone remodeling and teeth movement, but also represent orthopedic gains. Pha-touros and Goonewardene33 found similar results in
maxillary cross-sectional areas of patients submitted to RME. In the present study, the authors adopted palatal alveolar crests as reference points to determine the occlusal limits. Since no significant dental extru-sion was observed in maxillary molars and premo-lars, augmentation does not seem to be derived from vertical remodeling of alveolar crests. The type of expander used is another important issue to be con-sidered. As previously stated, some studies assert that the acrylic pad of the tooth-tissue borne expander distributes expanding forces along posterior teeth and the palatal vault, promoting less teeth inclination and more alveolar bone remodeling.7,30 Thus, more space
gain would be expected in patients treated with Haas expanders; however, no differences were observed when both appliances were compared. Results are based on quantitative analysis, for this reason, further qualitative assessment including overlap of Haas and Hyrax cross-sectional images could reveal whether space gains are related to specific anatomic regions of the palate or not, thereby promoting better visual understanding of treatment outcomes.30 Although
space gains were similar for both appliances, differ-ences in shape could reveal the influence of the type of expander used.
As for the mandible, increase was found for pos-terior (4.35%) and anpos-terior (5.37%) cross-sectional areas, probably as a result of lingual bone remodeling,
a consequence of dental uprighting movement, ex-trusion and vertical growth.3,26,30,37 As previously
de-scribed, the occlusal limits of mandibular areas were determined by a line connecting the lingual alveolar crests. Since teeth extrusion occurred, vertical bone remodeling of these crests as well as vertical growth could justify these findings. Thus, it seems reason-able to assume that these areas are more relireason-able to describe alveolar and basal bone changes occurring in the mandible after RME.
On average, MnOA and MnOC increased 43.99 mm2 and 1.35 mm. As demonstrated in Table 3,
increases in mandibular intermolar and interpremolar distances contributed to yield such results. Other au-thors confirm uprighting movements of mandibular molars and premolars after RME.12,24,28
Mandibu-lar incisors proclined significantly, as confirmed by IMPA variation, thereby contributing to MnOA and MnOC alterations. However, Tai et al34 also found
IMPA and intermolar distance increases in untreated patients. Although these changes were not statistically significant, the authors identified a natural tendency towards incisor proclination and molar uprighting.
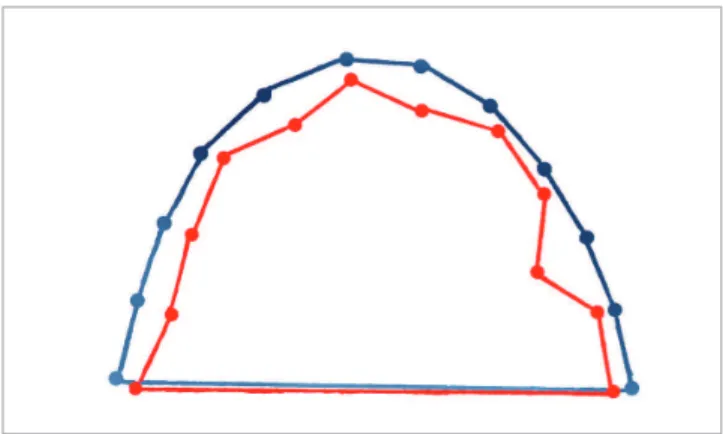
Even though changes in MnOA and MnOC were statistically signiicant, the clinical relevance of results found for MnOC is questionable. Based on the meth-odology adopted herein, minor alterations in MnOC could lead to great diferences in MnOA, as demon-strated in Figure 4 which shows two examples of man-dibular occlusal images represented by blue and red landmarks. These landmarks are 1 cm apart with the total occlusal contour being the same in both examples. Nevertheless, there is great disparity in size, which rep-resents the real diference between them. As a result, the
occlusal area seems to represent the occlusal changes in a more reliable manner. It is worth noting that area analy-sis is not reliable in determining the amount of teeth movement, but it may be a precise tool used to assess intraoral space gains.
The results yielded by the present study are based on two groups treated with RME by means of two dif-ferent expanders and without a control group. As stat-ed by other authors, the advantage of a control group to compare the results is unquestionable in scientiic investigation.4,26,34 However, recent systematic reviews
highlighted that most studies based on RME presented some methodological problems including small sample size and absence of a control group.4,26 This is also a
limitation of the present study. The methodology ad-opted herein consists of a longitudinal research based on successive tomographic images. Thus, the con-trol group would be submitted to radiation doses that would not bring any beneits to the individuals, thereby causing potential problems to their health and arising serious questioning in terms of ethical approval. Due to these facts, there were changes during RME and the retention period. The efects of the post-retention
period were not observed, once it would implicate in new tomographic images and further radiation doses. Nevertheless, these efects are important and help us understand the stability of this kind of treatment and should be explored in future studies.
CONCLUSION
Based on the studied sample and on the method-ology adopted herein it is reasonable to conclude:
» Maxillary and mandibular cross-sectional areas increased significantly after RME. Mandibular oc-clusal area also increased.
» No statistically significant differences were found when comparing the effects of Haas and Hyrax expanders.
» Maxillary and mandibular intermolar and inter-premolar distances increased after RME.
» Cross-sectional and occlusal analyses seem to be alternative methods to assess intraoral changes af-ter RME.
» Studies in different populations with similar methodology and the presence of a control group would be important to confirm the present results.
1. Adkins MD, Nanda RS, Currier GF. Arch perimeter changes on rapid
palatal expansion. Am J Orthod Dentofacial Orthop. 1990;97(2):194-9. 2. Angell EC. Treatment of irregularities of the permanent or adult teeth.
Dent Cosmos. 1860;1:540-4.
3. Baccetti T, Franchi L, McNamara JA Jr. The cervical vertebral maturation
(CVM) method for the assessment of optimal treatment timing in dentofacial orthopedic. Semin Orthod. 2005;11(3):119-29.
4. Bazargani F, Feldmann I, Bondemark L. Three-dimensional analysis of
effects of rapid maxillary expansion on facial sutures and bones. Angle Orthod. 2013;83(6):1074-82.
5. Chung C-H, Font B. Skeletal and dental changes in the sagittal, vertical, and transverse dimensions after rapid palatal expansion. Am J Orthod Dentofacial Orthop. 2004;126(4):569-75.
6. Garib DG, Henriques JFC, Janson G, Freitas MR, Coelho RA.
Rapid maxillary expansion: tooth-tissue-borne vs. tooth-borne expanders: A CT evaluation of dentoskeletal effects. Angle Orthod. 2005;75(4):548-57.
REFERENCES
7. Garib DG, Henriques JFC, Janson G, Freitas MR, Fernandes AY. Periodontal efects of rapid maxillary expansion with tooth-tissue-borne and tooth-borne expanders: a computed tomography evaluation. Am J Orthod Dentofacial Orthop. 2006;129(2):749-58.
8. Garib DG, Henriques JFC, Carvalho PEGC, Gomes SC. Longitudinal efects of rapid maxillary expansion a retrospective cephalometric study. Angle Orthod. 2007;77(3):442-8.
9. Gracco A, Malaguti A, Lombardo L, Mazzoli A, Rafaeli R. Palatal volume following rapid maxillary expansion in mixed dentition. Angle Orthod. 2010;80(2):153-9. 10. Gryson JA. Changes in mandibular interdental distance concurrent with rapid
maxillary expansion. Angle Orthod. 1977;47(1):186-92.
11. Haas AJ. Palatal expansion: just the beginning of dentofacial orthopedics. Angle Orthod. 1970;57(3):219-54.
12. Haas AJ. Rapid expansion of the maxillary dental arch and nasal cavity by opening the midpalatal suture. Angle Orthod. 1961;3(1):73-90.
14. Huynh T, Kennedy DB, Joondeph DR, Bollen AM. Treatment response and stability of slow maxillary expansion using Haas, hyrax, and quad-helix appliances: a retrospective study. Am J Orthod Dentofacial Orthop. 2009;136(3):331-9.
15. Iseri H, Tekkaya E, Oztan O, Bilgic S. The biomechanical efects of rapid maxillary expansion on the craniofacial skeleton studied by inite element method. Eur J Orthod.1998;20(2):347-56.
16. Jafari A, Shetty KS, Kumor M. Study of stress distribution and displacement of various craniofacial structures following application of transverse orthopedic forces. A three dimensional FEM study. Angle Orthod. 2003;73(1):12-20. 17. Kartalian A, Gohl E, Adamian M, Enciso R. Cone-beam computerized
tomography evaluation of the maxillary dentoskeletal complex after rapid palatal expansion. Am J Orthod Dentofacial Orthop. 2010;138(4):486-92.
18. Kiliç N, Kiki A, Oktay H. Condylar asymmetry in unilateral posterior crossbite patients. Am J Orthod Dentofacial Orthop. 2008;133(4):382-7.
19. Koch GG. “Intraclass correlation coeicient”. In: Kotz S, Johnson NL. Encyclopedia of Statistical Sciences. 4th ed. New York: John Wiley & Sons; 1982. p 213-7.
20. Kusnoto B, Evans C. Reliability of a 3D surface laser scanner for orthodontic applications. Am J Orthod Dentofacial Orthop. 2002;122(4): 342-8. 21. Lachin JM. The role of measurement reliability in clinical trials. Clinical Trials.
2004;1(1): 553-66.
22. Lagravère MO, Low C, Flores-Mir C, Chung R, Carey JP, Heo G, Major PW. Intraexaminer and interexaminer reliabilities of landmark identiication on digitized lateral cephalograms and formatted 3-dimensional cone-beam computerized tomography images. Am J Orthod Dentofacial Orthop. 2010;137(4):598-604.
23. Leung CC, Palomo L, Griith R, Hans MG. Accuracy and reliability of cone-beam computed tomography for measuring alveolar bone height and detecting bony dehiscences and fenestrations. Am J Orthod Dentofacial Orthop. 2010;137(1):109-19.
24. Lima AC, Lima AL, Lima Filho RMA, Oyen OJ. Spontaneous mandibular arch response after rapid palatal expansion: a long-term study on Class I malocclusion. Am J Orthod Dentofacial Orthop. 2004;126(5):576-82.
25. Lima Filho RMA, Ruellas ACO. Long-term anteroposterior and vertical maxillary changes in skeletal class II patients treated with slow and rapid maxillary expansion. Angle Orthod. 2007;77(5):870-4.
26. Lionea R, Franchib L, Cozzac P. Does rapid maxillary expansion induce adverse efects in growing subjects? Angle Orthod. 2013;83(1):172-82.
27. Motoyoshi M, Shirai S, Yano S, Nakanishi K, Shimizu N. Permissible limit for mandibular expansion. Eur J Orthod. 2005;27(1):115-20.
28. O’Grady PW, McNamara JA Jr, Baccetti T, Franchid L. A long-term evaluation of the mandibular Schwarz appliance and the acrylic splint expander in early mixed dentition patients. Am J Orthod Dentofacial Orthop. 2006;130(2):202-13. 29. Odenrick L, Karlander EL, Pierce A, Kretschmar U. Surface resorption following
two forms of rapid maxillary expansion. Eur J Orthod.1991;13(2):264-70. 30. Oliveira NL, Silveira AC, Kusnoto B, Viana G. Three-dimensional assessment
of morphologic changes of the maxilla: a comparison of 2 kinds of palatal expanders. Am J Orthod Dentofacial Orthop. 2004;126(3):354-62. 31. Ölmez H, Akin E, Karaçay S. Multitomographic evaluation of the dental
efects of two diferent rapid palatal expansion appliances. Eur J Orthod. 2007;29(3):379-85.
32. Petrén S, Bondemark L. Correction of unilateral posterior crossbite in the mixed dentition: a randomized controlled trial. Am J Orthod Dentofacial Orthop. 2008;133(2):790.e7-13.
33. Phatouros A, Goonewardene MS. Morphologic changes of the palate after rapid maxillary expansion: a 3-dimensional computed tomography evaluation. Am J Orthod Dentofacial Orthop. 2008;134(1):117-24.
34. Tai K, Hotokezaka H, Park JH, Tai H, Miyajima K, Choi M, Kai LM, Mishima K. Preliminary cone-beam computed tomography study evaluating dental and skeletal changes after treatment with a mandibular Schwarz appliance. Am J Orthod Dentofacial Orthop. 2010;138(2):262.e1-11.
35. Velázquez P, Benito E, Bravo LA. Rapid maxillary expansion: a study of the long-term efects. Am J Orthod Dentofac Orthop. 1996;109(1):361-7.
36. Wertz RA. Skeletal and dental changes accompanying rapid midpalatal suture opening. Am J Orthod.1970;58(1):41-66.