Introduction
Physical inactivity (PI) is a major risk factor for many diseases, particularly cardiovascular diseases1, 2. Currently, about 14% of the Brazilian adult population does not practice any physical activity, in the work environment, in transportation, in domestic work or in their leisure time3. Insuficiently active individuals are those who perform physical activities, but in quantity and intensity not enough to be classiied as active as they do not meet the recommendations of at least 150 minutes/week of moderate-to-vigorous physical activity in daily life (PADL)1, 2.
The simplest way to assess the PADL is using questionnaires. This tool has been widely used in population-based samples
due to its low cost and its ability to collect detailed information on the type of activity4. Among these questionnaires, the most widely used are the International Physical Activity Questionnaire (IPAQ)5. However, the self-report may generate biases of inter-pretation and accuracy of the information provided, particularly in individuals with lower educational level6,7. Accordingly, to address the main limitations of questionnaires, the PADL has been assessed in the last few years through motion sensors. Among then, triaxial accelerometers are the most accurate and reliable method compared to the doubly labeled water and has been recommended for routine strategy in epidemiological studies8.
Recent studies have shown conlicting results between the IPAQ and accelerometers6,9,10. The questionnaire may Original article (short paper)
Use of combined method, accelerometer and
international physical activity questionnaire, to
determinate occurence of physical inactivity in adults
Rodrigo Pereira da Silva
Universidade Metropolitana de Santos, Santos, SP, Brazil
Evandro Forneas Sperandio
Universidade Federal de São Paulo, Santos, SP, Brazil
Agatha Caveda Matheus Vinicius Tonon Lauria
Faculdade Praia Grande, Praia Grande, SP, Brazil
Flavio Rossi de Almeida Vitor Rossi de Almeida
Universidade Federal de São Paulo, Santos, SP, Brazil
Antonio Ricardo Gagliardi Rodolfo Leite Arantes
Marcelo Romiti
Angiocorpore, Medicina Cardiovascular, Santos, SP, Brazil
Victor Zuniga Dourado
Universidade Federal de São Paulo, Santos, SP, Brazil
Abstract — Aim: Evaluate and compare the proportion of Physical inactivity (PI) and associated factors by IPAQ questionnaire, triaxial accelerometry and the combination of both. Adults aged 18 years were enrolled (n = 250).
Methods: We considered PI as < 600 MET-min/wk in the IPAQ total score, < 150 min/wk of moderate-to-vigorous physical activity in 7 days accelerometry, and the combination of both criteria. Clinical assessment, spirometry, cardiopulmonary exercise test, bioelectrical impedance, isokinetic dynamometry, postural balance, and six-minute walk test were also performed. For participants practicing aquatic, martial arts or cycling, only the IPAQ criterion was considered. Results: Proportions of PI were signiicantly different among methods (IPAQ, 10%; accelerometry,
overestimate7 the PADL compared to accelerometers. However, motion sensors are not able to measure water activities, martial arts, strength training, upper body activities and cycling, under-estimating the PADL of the practitioners of these modalities11. Although the assessment of the physical activity patterns and energy expenditure in epidemiological studies is essential, few studies have assessed the PADL combining the results of the instruments mentioned above12,13. Instead, one of these instruments is often chosen and, more recently, the accelerom-eter has been prioritized. It would be reasonable to state that the questionnaire could supplement the information obtained by accelerometry, maximizing the assessment of the PADL in adults. Using only the questionnaire, especially for individuals who routinely perform water activities like swimming, com-bat sports, and cycling, could also improve the assessment of PADL. There are limitations in these environments and are not adequately captured by accelerometers, and may underestimate measurement estimate14,15.
We hypothesized that the combination of the IPAQ questionnaire and triaxial accelerometer is the best strategy to assess the proportion of physically inactive adults. This combined method could be more valid, associating with several recognized important predictors of PI in the general population. Accordingly, we aimed to evaluate and compare the proportion of PI in adults assessed by the IPAQ questionnaire, triaxial accelerometer and the combination of both. Also, we investigated associated factors of PI assessed by the combined method proposed here.
Methods
We evaluated 251 participants with a mean of 44±15 years, of which 150 were women and 101 men, with a weight of 74.7±17,4 kg and a height of 1.64±0.10 in a cross-sectional design. Participants were selected from the EPIMOV Study (Epidemiological Study of Human Movement and Hypokinetic Diseases). Briely, the EPIMOV Study is a cohort study with the main objective of investigating the longitudinal association between sedentary behavior (which is the term for activities that are performed in the lying or sitting position and do not increase energy expenditure above resting levels, ≤ 1.5 metabolic equivalents (METs)16, and PI with the occurrence of hypokinetic diseases, especially cardiorespiratory diseases. All participants underwent a general health screening supervised by a physician. First, they answered the physical activity readiness questionnaire (PAR-Q)17. Second, we assessed self-reported cardiovascular risk factors. Participants were inquired about the familiar history of cardiovascular disease and the presence of hypertension, diabe-tes, dyslipidemia, smoking and PI18. We investigated smoking by self-report and smoking load was calculated in pack-years. Third, Body weight and height were measured, and body mass index (BMI) was calculated. Participants with (BMI) ≥ 30 kg/ m2 were considered obese. The following demographic variables were analyzed: age, sex, race, place of residence and schooling. We included only participants free of cardiac, respiratory and locomotor diseases.
After selection, all participants signed an informed consent. The local Ethics Committee on Human Research approved the present study.
Design
The assessments proposed by the present study were carried out in two days, seven days apart. In the irst visit, participants underwent general health screening, anthropometrics, spirometry and cardiopulmonary exercise test (CPET). At the end of the assessment, participants were informed how to use the triaxial accelerometer for the subsequent seven days. In the second visit, they returned the accelerometer, answered the IPAQ, then conducted an assessment of body composition by bioelectrical impedance, isometric and isokinetic muscle function and postural balance. At the end of the second visit, participants underwent the six-minute walk test (6MWT).
Spirometry
The forced vital capacity maneuver was carried out using a properly calibrated spirometer (Quark PFT, COSMED, Pavonadi Albano, Italy) according to the criteria established by the American Thoracic Society19. Forced expiratory volume in one second (FEV1), forced vital capacity (FVC) and the FEV1/FVC ratio were measured in absolute and predicted values20. The restrictive spirometric21
pat-tern was identiied as previous described (i.e., FEV1/FVC > 0.70 and FVC < 80% of predicted)12.
Cardiopulmonary exercise test
The CPET was performed on a treadmill (ATL, Inbrasport, Curitiba, Brazil) under a ramp protocol established according to the estimated maximum oxygen uptake (V’O2) of each partici-pant. Heart rate was monitored throughout the test by a 12-lead electrocardiogram (C12x, COSMED, Pavonadi Albano, Italy). Gas exchange and ventilatory variables were analyzed breath by breath, using periodically calibrated gas analyzer (Quark PFT, COSMED, Pavonadi Albano, Italy). The following criteria were used for determining the maximum effort: maximum heart rate (HR max) of at least 85% of predicted for age (220 - age) or rate of gas exchange (R) ≥ 1.0 or V’O2 plateau. Oxygen uptake, carbon dioxide production (V’CO2); and minute ventilation (V’E) were obtained. The data were iltered every 15 s by arithmetic average, and the average of the V’O2 values in the last 15 s at peak incremental exercise was used as representative of peak V’O2. The anaerobic threshold (AT) was obtained by the v-slope method as previous described23.
Body composition
temperature. Resistance and reactance were determined with the participant in the supine position as previous described(24). We calculated lean body mass (LBM) and body fat using group-speciic equations for healthy individuals24.
International Physical Activity Questionnaire
The PADL was quantiied using the long version of the IPAQ questionnaire validated for local culture and language25. Total energy expenditure in high, moderate and low-intensity physi-cal activities as well as in labor, transportation, recreation and leisure physical activities were quantiied in MET/min.week-1. We considered physically inactive those who performed less than 600 MET/min.week-1 in the total score of the questionnaire26.
Postural balance
We evaluated postural balance by the measure of the center of pressure bipedal (COP) on a force platform (BIOMEC 400, EMGSystem, Brazil). The frequency of the data acquisition was set at 100 Hz. Participants were instructed to remain as static as possible in the following situations: Bipedal support with open eyes; bipedal support with eyes closed; semi-tandem support with eyes open; and semi-tandem support with eyes closed. Each position was held for 30 seconds. In the case of situations with open eyes, participants were instructed to look at a target of 4.5 cm in diameter, positioned at the eye level.
Peripheral muscle function
We assessed muscle function on an isokinetic dynamometer (Biodex, Lumex, Inc., Ronkonkoma, NY). The gravity was properly corrected throughout all tests. Peak torque (PT) in Nm was assessed by two tests of ive movements at 60o/s. After a
rest period of at least ive minutes, participants underwent tests at 300o/s to register the total work (TT), in kJ, after 30 repeti-tions. We considered the highest value for analysis in all the tests mentioned above. These tests were applied to the dominant lower and upper limbs. Participants were strongly encouraged during all the tasks.
Six-minute walk test
The 6MWT was performed according to the standards of the American Thoracic Society27. The distance traveled on the test (6MWD) was recorded in meters and in the percentage of predicted values28.
Accelerometry
We used triaxial accelerometers to assess PADL (ActiGraph, GTX 3, MTI, Pensacola, FL). The software used for analysis
was actilife 6.11.9. The accelerometry was performed during seven consecutive days. We instructed all the participants on how the accelerometer should be positioned at the waist above the dominant hip. Participants completed a checklist to assess whether your day was representative. We consid-ered only valid days with at least 12 hours of monitoring, starting at the moment of awakening. The time spent in each physical activity intensity and the energy expenditure were obtained and therefore the average of at least four valid days was calculated. The time of use was identiied by asking the volunteer to remove the accelerometer from the hip region at the time of going to sleep, since we did not evaluate the sleep period in this study. We considered physically inactive those who did not perform at least 150 min/week of moderate-to-vigorous physical activity. The valid data were the use of ac-celerometers at least four days, one being a weekend. The day was considered valid when they were recorded for at least 10 hours of recording. Data were collected at a frequency of 30 Hz and analyzed in epochs of 60 s. For the calculation of the minutes spent in moderate and vigorous activities per week, the sum of all valid days was adjusted by the number of valid days and multiplied by seven, thus obtaining the individual weekly average. For the classiication of physical activity in the different intensities, the cut-off point was the one proposed by Freedson et al.29, being considered as moderate activity counts between 1,952 and 5,724, and above 5,725 counts as vigorous activities.
Combined method for assessing PADL
We inquired participants about the realization of aquatic physical activities (e.g., swimming) and martial arts/body contact activi-ties, upper body physical activiactivi-ties, and cycling. For those who met these criteria, we considered only the results of the IPAQ for identifying PI (i.e., < 600 MET/min.week-1). For these individuals
were not using the accelerometer at the moments of the practices of the swimming pool (because it is not water resistant) and
ights, and also by the limitations in the use of cycling30. Also, in
the combined method proposed here, we considered physically inactive all participants who showed total score of the IPAQ < 600 MET/min.week-1 and/or quantity and intensity of PADL < 150
min/week of moderate-to-vigorous physical activity obtained by triaxial accelerometry.
Statistical analysis
The proportion of physically inactive participants was cal-culated and compared between the methods of evaluation. Also, the agreement between IPAQ and accelerometry was evaluated by Kappa test. The kappa values, equal to or greater than 0.80, were considered adequate.
The numbers of variables and as co-variables in the logistic regression statistical models to 1/10 were evaluated from the number of participants or at least ten observations for each variable included in the model. The variables of interest were included in the model the following groups: demographic, anthropometric, body
composition, clinics, cardiorespiratory itness, and postural balance. Energy expenditure, the number of steps performed and the intensity of daily physical activity were evaluated descriptively and the average daily time spent standing, lying and sitting were evaluated as well.
We performed multivariate logistic regressions using PI as the outcome. The objective was to obtain the best model, dis-carding non-signiicant variables with almost no contribution to the setting. The processing was performing through simple logistic regression for each independent variable. In the case of categorical variables, the transformation was performed using dummy variables in the categories as a reference. The variables that presented p values ≤ 0.20 were selected. The likelihood ratio test veriied the overall it of the model. Age and BMI were initially analyzed as continuous variables and in the case of lack of signiicance they were transformed into categorical variables. Age was stratiied into 20-39, 40-59 and ≥ 60 years and BMI in 18 to 24.9, 30 to 34.9 and 25-29.9, and ≥ 35 kg/ m2, respectively representative of young adults, middle-aged and older adults and normal weighted, overweighed and obese participants. Three regression models were constructed using PI as the outcome obtained by the combined method. Values of odds ratio and its 95% conidence limits were calculated. One of the goals was to quantify the number of signiicant predictors in each of the PI identiication methods. The probability of an alpha error was set at 5%.
Results
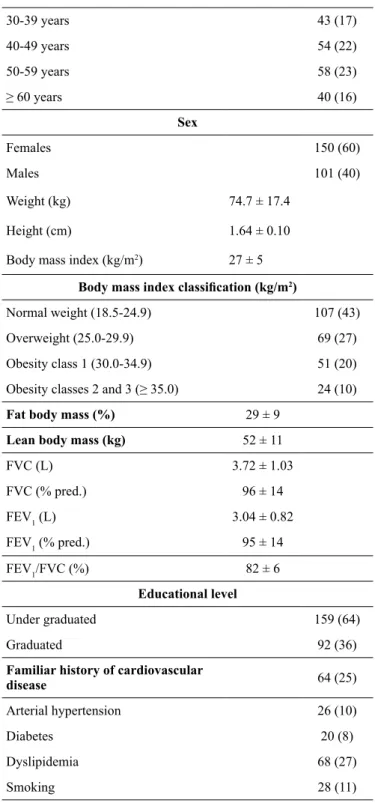
There was evenly distributed mean values of BMI were represen-tative of overweight (Table 1). Spirometric indices showed that participants were free of lung obstruction. Twenty-ive participants (10%) presented restrictive spirometric pattern. Participants were predominantly white. Considering the cardiovascular risk assessment, almost half of our participants had a moderate car-diovascular risk with two or more carcar-diovascular risk factors.
Table 1. General characteristics of the 251 participants
Mean ± SD Count (%)
Age (years) 44 ± 15
Age groups
20-29 years 56 (22)
30-39 years 43 (17)
40-49 years 54 (22)
50-59 years 58 (23)
≥ 60 years 40 (16)
Sex
Females 150 (60)
Males 101 (40)
Weight (kg) 74.7 ± 17.4
Height (cm) 1.64 ± 0.10
Body mass index (kg/m2) 27 ± 5
Body mass index classiication (kg/m2)
Normal weight (18.5-24.9) 107 (43)
Overweight (25.0-29.9) 69 (27)
Obesity class 1 (30.0-34.9) 51 (20)
Obesity classes 2 and 3 (≥ 35.0) 24 (10)
Fat body mass (%) 29 ± 9
Lean body mass (kg) 52 ± 11
FVC (L) 3.72 ± 1.03
FVC (% pred.) 96 ± 14
FEV1 (L) 3.04 ± 0.82
FEV1 (% pred.) 95 ± 14
FEV1/FVC (%) 82 ± 6
Educational level
Under graduated 159 (64)
Graduated 92 (36)
Familiar history of cardiovascular
disease 64 (25)
Arterial hypertension 26 (10)
Diabetes 20 (8)
Dyslipidemia 68 (27)
Smoking 28 (11)
FVC = forced vital capacity; FEV1 = forced expiratory volume in the 1 s.
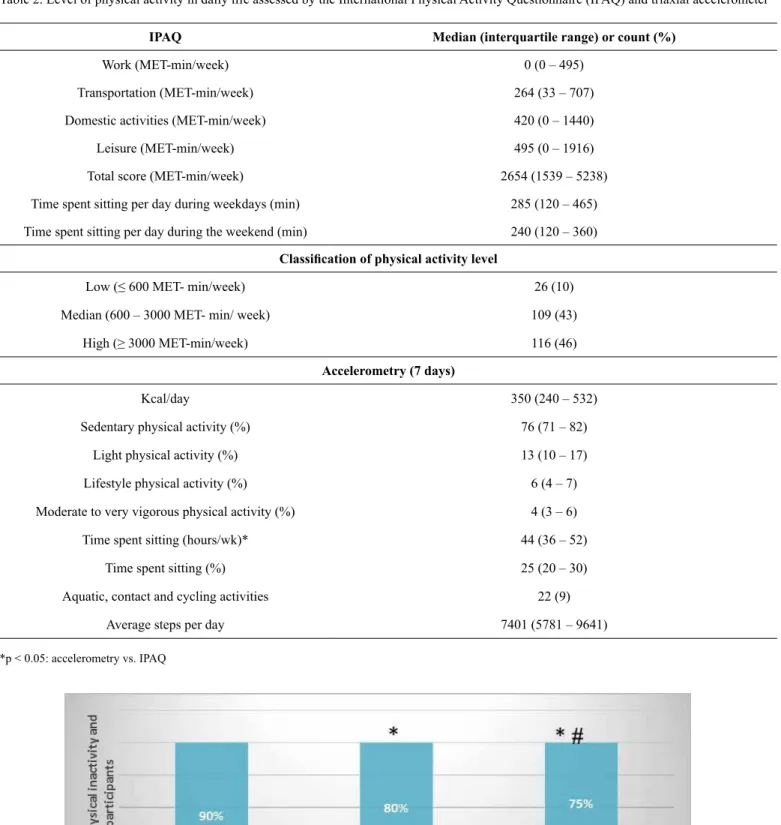
According to the IPAQ results, 89% of participants had a median-to-high level of physical activity (Table 2), that is, the volunteers performed between more than 600 METs/min/week to less than 3000 METs / min / week. Participants reported 240-285 minutes spent sitting. About 10% of the participants reported practicing aquatic physical activities and martial arts/body contact, upper body and cycling activities (Table 2).
Table 2. Level of physical activity in daily life assessed by the International Physical Activity Questionnaire (IPAQ) and triaxial accelerometer
IPAQ Median (interquartile range) or count (%)
Work (MET-min/week) 0 (0 – 495)
Transportation (MET-min/week) 264 (33 – 707)
Domestic activities (MET-min/week) 420 (0 – 1440)
Leisure (MET-min/week) 495 (0 – 1916)
Total score (MET-min/week) 2654 (1539 – 5238)
Time spent sitting per day during weekdays (min) 285 (120 – 465)
Time spent sitting per day during the weekend (min) 240 (120 – 360)
Classiication of physical activity level
Low (≤ 600 MET- min/week) 26 (10)
Median (600 – 3000 MET- min/ week) 109 (43)
High (≥ 3000 MET-min/week) 116 (46)
Accelerometry (7 days)
Kcal/day 350 (240 – 532)
Sedentary physical activity (%) 76 (71 – 82)
Light physical activity (%) 13 (10 – 17)
Lifestyle physical activity (%) 6 (4 – 7)
Moderate to very vigorous physical activity (%) 4 (3 – 6)
Time spent sitting (hours/wk)* 44 (36 – 52)
Time spent sitting (%) 25 (20 – 30)
Aquatic, contact and cycling activities 22 (9)
Average steps per day 7401 (5781 – 9641)
*p < 0.05: accelerometry vs. IPAQ
Figure 1. The proportion of physically inactivity and activity participants according to the evaluation method: International Physical Activity
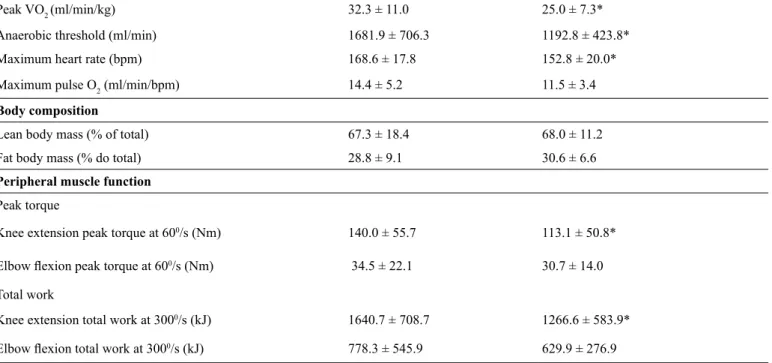
Table 4. Physical itness variables in the studied sample according to the evaluation method utilized for assessing physical activity in daily life.
Physical inactivity
Combined method
No Yes
Cardiopulmonary exercise testing
Peak VO2 (ml/min) 2415.0 ± 873.9 1781.9 ± 624.8*
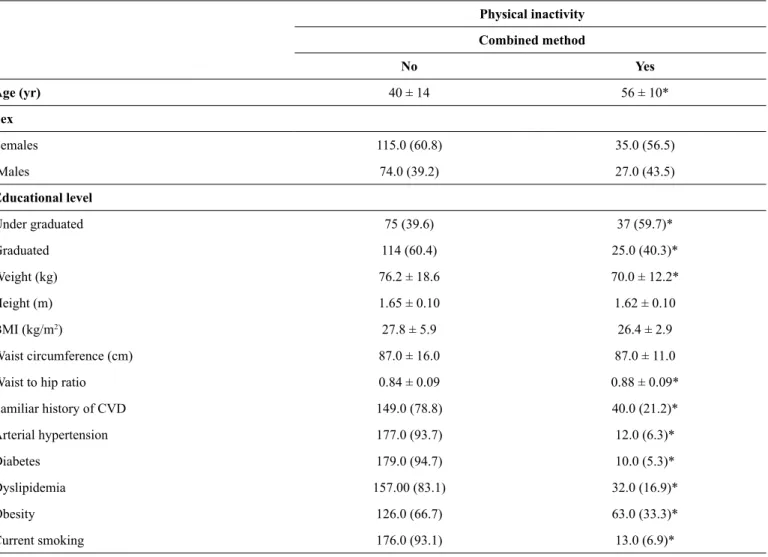
Tables 3 and 4 show the main variables associated with PI according to the combined method. Demographic factors such
as age and education level were signiicantly different between physically active and inactive participants (Table 3).
Table 3. Demographics. anthropometrics and cardiovascular risk factors in the studied sample according to the method utilized for assessing physical activity in daily life.
Physical inactivity
Combined method
No Yes
Age (yr) 40 ± 14 56 ± 10*
Sex
Females 115.0 (60.8) 35.0 (56.5)
Males 74.0 (39.2) 27.0 (43.5)
Educational level
Under graduated 75 (39.6) 37 (59.7)*
Graduated 114 (60.4) 25.0 (40.3)*
Weight (kg) 76.2 ± 18.6 70.0 ± 12.2*
Height (m) 1.65 ± 0.10 1.62 ± 0.10
BMI (kg/m2) 27.8 ± 5.9 26.4 ± 2.9
Waist circumference (cm) 87.0 ± 16.0 87.0 ± 11.0
Waist to hip ratio 0.84 ± 0.09 0.88 ± 0.09*
Familiar history of CVD 149.0 (78.8) 40.0 (21.2)*
Arterial hypertension 177.0 (93.7) 12.0 (6.3)*
Diabetes 179.0 (94.7) 10.0 (5.3)*
Dyslipidemia 157.00 (83.1) 32.0 (16.9)*
Obesity 126.0 (66.7) 63.0 (33.3)*
Current smoking 176.0 (93.1) 13.0 (6.9)*
Data presented as mean ± SD (continuous variables) and as count (%) for categorical variables. IPAQ = International Physical Activity Questionnaire; IMC = body mass index; *p < 0.05: physically active vs. physically inactive participants
Considering cardiovascular risk factors, we found that famil-iar history of cardiovascular disease, dyslipidemia, and current smoking, were signiicantly different between physically active and inactive participants. PI showed signiicant association with some of the risk factors for cardiovascular disease (Table 3). The low level of physical itness was signiicantly associated with PI
After multivariate logistic regression analyses, the main pre-dictors of PI determined by combined method were age, female
sex, lean body mass, familiar history of cardiovascular disease, dyslipidemia, obesity, smoking, peak V’O2 and COP (Table 5).
Table 5. Results of the multivariate logistic regressions for assessing predictors of physical inactivity (n = 251)
Predictors
Physical inactivity
Combined method
95% conidence interval
Odds ratio Lower limit Upper limit
Age (yr) 1.104* 1.024 1.190
Sex 9.935* 4.511 18.578
Education level (graduated) 0.688 0.467 1.013
Fat body mass (% of total) 0.911 0.780 1.064
Familiar history of CVD 8.230* 1.985 34.117
Arterial hypertension 7.438ǂ 0.888 62.283
Diabetes 1.162 0.161 8.367
Dyslipidemia 12.740* 2.874 56.465
Obesity 1.982* 1.845 1.998
Smoking 10.739* 1.656 69.641
Peak V’O2 (ml/min/kg) 0.837* 0.739 0.948
COP bipedal (cm2) 1.343* 1.013 1.780
PT of knee extension at 600/s(Nm) 1.015 0.992 1.039
TW knee extension at 3000/s (kj) 0 .999 0.997 1.001
6MWD (m) 1.005 0.995 1.016
V’O2 = oxygen uptake; COP = center of pressure; PT = peak torque; TW = total work; 6MWD = six- minute walk; distance; *p < 0.05: signiicance for odds ratio
Peak VO2 (ml/min/kg) 32.3 ± 11.0 25.0 ± 7.3*
Anaerobic threshold (ml/min) 1681.9 ± 706.3 1192.8 ± 423.8*
Maximum heart rate (bpm) 168.6 ± 17.8 152.8 ± 20.0*
Maximum pulse O2 (ml/min/bpm) 14.4 ± 5.2 11.5 ± 3.4
Body composition
Lean body mass (% of total) 67.3 ± 18.4 68.0 ± 11.2
Fat body mass (% do total) 28.8 ± 9.1 30.6 ± 6.6
Peripheral muscle function
Peak torque
Knee extension peak torque at 600/s (Nm) 140.0 ± 55.7 113.1 ± 50.8*
Elbow lexion peak torque at 600/s (Nm) 34.5 ± 22.1 30.7 ± 14.0
Total work
Knee extension total work at 3000/s (kJ) 1640.7 ± 708.7 1266.6 ± 583.9*
Elbow lexion total work at 3000/s (kJ) 778.3 ± 545.9 629.9 ± 276.9
Discussion
We assessed the proportion of PI among asymptomatic adults using the IPAQ and triaxial accelerometers. The IPAQ sig-niicantly underestimated the proportion of physically inactive individuals. However, in spite of the scarce studies showing the eficacy agreement between IPAQ and accelerometry, we sug -gest the combination of the two methods may be more valid and provided signiicantly higher prevalence of physical inactivity. The main inding of the present study was that the combina -tion of ques-tionnaire and triaxial accelerometry resulted in the signiicantly higher proportion of PI compared to IPAQ and accelerometry separately. We also observed after multivariate logistic regressions that PI assessed by the combined method proposed in the present study was signiicantly associated with a larger number of relevant attributes.
Previous indings in the literature are very conlicting. This fact can primarily be attributed to the complexity of evaluation of PADL. Select the most suitable tool is challenging, especially in the general population. Moreover, the various dimensions of physical activity require different assessment tools31.
Several studies have compared accelerometers with ques-tionnaires for assessing PADL32-34. However, few have proposed to assess the combination of the two methods32. Since the gold standard for evaluating PADL is not determined yet in large-scale epidemiological studies, questionnaires and accelerometers have been the instruments most commonly used8. Accelerometers provide information about the frequency, duration, intensity and pattern of physical activity and are capable of storing in-formation for a long period. Unfortunately, they underestimate the energy expenditure of some activities of daily life and are unable to accurately assess physical activities with arms, water activities, cycling and walking in a steep climb, among others. Questionnaires, in turn, represent the most frequently used method in epidemiological studies focusing mainly on its advan-tage of low cost. It also presents as one of its main strengths the ability to discern some dimensions of daily physical activity, such as occupational activities, transport and leisure time. Although the questionnaires are accurate to assess physical activity of moderate-to-vigorous physical activity, they present dificulties in quantifying low-intensity physical activities, especially in some speciic groups (e.g., older adults and women). Therefore, it is reasonable to assert that the combination of questionnaire and accelerometers may be the best strategy for more accurate assessment of PADL8.
The proportion of PI observed in the combined method proposed here was 25%. Our results are in agreement with lit-erature. In a large study involving 212,021 participants from 51 countries, the average prevalence of PI were 18%, 15% for men and 20% for women, with wide variation between 2 and 72%35. In every country involved, women and older adults were more likely to be physically inactive35. Brazil was involved in this study35 including 4,458 individuals. The results showed 26% of PI, very similar to the 25% found in the present study combining the two instruments. Several Brazilian studies have investigated the prevalence of PI, mostly using questionnaires. However, as the present study, the vast majority was held involving only one
city. Unfortunately, multicenter studies are scarce and surely involve few cities. These national data using the short version of the IPAQ indicate a prevalence of PI between 29 and 31%36. We found in the present study lower prevalence through the long version of the IPAQ (10%). This fact can be attributed primarily to the different questionnaires used and the feature conducive to physical activity in the city in which the present study was conducted (Santos, São Paulo, Brazil). This city is mostly lat, coastal and located in the southeast region. In fact, Brazilian multicenter studies showed that the prevalence of PI is lower in the South and Southeast regions (about 24%)37,38. We were
unable to ind Brazilian studies that assessed the prevalence of PI among adults through triaxial accelerometry.
Our study showed inconsistent agreement between acceler-ometry and IPAQ (Kappa = 0.152; p = 0.01). This inding is in agreement with previous studies. Chastin et al.39 observed a weak correlation between accelerometry and IPAQ. The agreement between then was also weak considering the wide conidence interval39. Oyeyemi et al.40 evaluated 144 participants underwent triaxial accelerometry and IPAQ. The correlation between the times in moderate-to-vigorous physical activity obtained by the two instruments was moderate, and the limit of agreement was wide. Again, the questionnaire underestimated the amount of sedentary physical activity40. Men and women reported time spent in sedentary physical activity, on average, 131 min/day less than the amount obtained by accelerometry and the correla-tion between the two methods was weak41. The IPAQ presented limitations to classify adults in low ranges and high intensity of physical activity, with the difference increasing progressively with the increasing amount and intensity of physical activity42,43.
Our results showed greater validity when we combine the two methods of assessing PADL. Harris et al.44 observed
differ-ences in concurrent validity when compared a speciic physical activity questionnaire and triaxial accelerometry. The results of accelerometry were correlated consistently with general health, anthropometric and psychological variables while the question-naire was associated only with the psychological variables. Sabia et al.45 observed stronger correlations between the results of accelerometry and anthropometric and body composition variables compared to the physical activity questionnaire. The results mentioned above suggest that the validity of the accel-erometer is more consistent compared to questionnaires. Our results suggest that the combination of these two methods might be even better. For reliability when using the two instruments is greater for subjects practicing aquatic activities, cycling, ights (accelerometry is not reliable), and individuals with little schooling and the elderly (overestimate the PADL).
After multivariate logistic regressions, we found a great number of signiicant predictors using the combined method, especially considering physical itness variables (e.g., peak V’O2 and COP). This fact may be attributed irst to the over -estimation of the quantity of PADL and lower precision for low-intensity related to questionnaires. On the other hand, the triaxial accelerometry may result in spurious interpretations of PADL regarding water, upper body, and cycling activities, etc.
for example, a higher proportion of women and higher education level. However, our results showed a proportion of PI as well as other demographic and anthropometric characteristics very compatible with the previously described in the literature for our metropolitan area. Moreover, the sample was statistically suficient, especially for the construction of multivariate logistic regression models. To be used as a criterion of comparison and such as the cut-point utilized for moderate-vigorous physi-cal activity.
We may conclude that the combined method proposed here resulted in the more reliable proportion of PI and was valid, be-ing predicted by several demographic, clinical and physiological variables. Our indings have practical implications. They suggest that the main PADL assessment methods commonly used in epidemiological studies are complementary and should always be used in combination as a routine strategy.
References
1. Chodzko-Zajko WJ, Proctor DN, Fiatarone Singh MA, Minson CT, Nigg CR, Salem GJ, et al. American College of Sports Medicine position stand. Exercise and physical activity for older
adults. Med Sci Sports Exerc. 2009;41(7):1510-30.
2. American College of Sports Medicine position stand. Progression models in resistance training for healthy adults. Med Sci Sports
Exerc. 2009;41(3):687-708.
3. Ministério da Saúde. Vigilância de fatores de risco e proteção para doenças crônicas por inquérito telefônico. In: Saúde SdVe, editor. Brasília, 2012.
4. Ainsworth BE, Caspersen CJ, Matthews CE, Masse LC, Baranowski T, Zhu W. Recommendations to improve the accuracy of estimates of physical activity derived from self report. J Phys
Act Health. 2012;9 Suppl 1:S76-84.
5. Barros MVG, Nahas MV. Reprodutibilidade (teste-reteste) do Questionário Internacional de Atividades Físicas (QIAF-Versão 6): um estudo-piloto com adultos no Brasil. Rev Bras Ciênc Mov.
2000;18(2):23-6.
6. Dyrstad SM, Hansen BH, Holme IM, Anderssen SA. Comparison of self-reported versus accelerometer-measured physical activity.
Medicine and science in sports and exercise. 2014;46(1):99-106.
7. Garcia LMT, Barros MVG, Silva KS, Del Duca GF, Costa FFd, Oliveira ESA, et al. Socio-demographic factors associated with three sedentary behaviors in Brazilian workers. Cadernos de Saúde
Pública. 2015;31(5):1015-24.
8. Lee I-M, Blair S, MaNSON J, Paffenbaerger Jr. RS. Epidemiologic methods in physical activity studies. Lee I-M, editor. New York:
Oxford University Press; 2009. 328 p.
9. Fuentes Bravo M, Zuniga Paredes F, Rodriguez-Rodriguez FJ, Cristi-Montero C. [Occupational physical activity and body
composition in adult women; pilot study]. Nutricion hospitalaria. 2013;28(4):1060-4.
10. Umstattd Meyer MR, Baller SL, Mitchell SM, Trost SG. Comparison of 3 accelerometer data reduction approaches, step counts, and 2 self-report measures for estimating physical
activ-ity in free-living adults. J Phys Act Health. 2013;10(7):1068-74.
11. Medina C, Barquera S, Janssen I. Validity and reliability of the International Physical Activity Questionnaire among adults in
Mexico. Rev Panam Salud Publica. 2013;34(1):21-8.
12. Duncan MJ, Arbour-Nicitopoulos K, Subramanieapillai M, Remington G, Faulkner G. Revisiting the International Physical Activity Questionnaire (IPAQ): Assessing physical activity among individuals with schizophrenia. Schizophrenia research. 2016. 13. Wanner M, Probst-Hensch N, Kriemler S, Meier F, Autenrieth C,
Martin BW. Validation of the long international physical activity
questionnaire: Inluence of age and language region. Preventive medicine reports. 2016;3:250-6.
14. Strath SJ, Kaminsky LA, Ainsworth BE, Ekelund U, Freedson PS, Gary RA, et al. Guide to the assessment of physical activity:
Clinical and research applications: a scientiic statement from the American Heart Association. Circulation. 2013;128(20):2259-79.
15. Pedisic Z, Bauman A. Accelerometer-based measures in physical activity surveillance: current practices and issues. British journal
of sports medicine. 2015;49(4):219-23.
16. Owen N, Healy GN, Matthews CE, Dunstan DW. Too much sit-ting: the population health science of sedentary behavior. Exercise
and sport sciences reviews. 2010;38(3):105-13.
17. Standardization of Spirometry, 1994 Update. American Thoracic
Society. Am J Respir Crit Care Med. 1995;152(3):1107-36.
18. American College of Sports Medicine. ACSM’s guidelines of exercise testing and prescription. 8th ed. Philadelphia: Lippincott
Wiliams & Wilkins; 2009. 265 p.
19. Miller MR, Hankinson J, Brusasco V, Burgos F, Casaburi R, Coates A, et al. Standardisation of spirometry. Eur Respir J.
2005;26(2):319-38.
20. Pereira CA, Sato T, Rodrigues SC. New reference values for forced spirometry in white adults in Brazil. J Bras Pneumol.
2007;33(4):397-406.
21. Pellegrino R, Viegi G, Brusasco V, Crapo R, Burgos F, Casaburi Rea, et al. Interpretative strategies for lung function tests.
European Respiratory Journal. 2005;26(5):948-68.
22. Pereira C, Neder J. Diretrizes para testes de função pulmonar. J
Bras Pneumol. 2002;28(Supl 3):s1-s238.
23. Wasserman K, Hansen J, Sue DY, Whipp BJ, Casaburi R. Principles of exercise testing and interpretation. 4th ed.
Philadelphia: Lippincott Wiliams & Wilkins; 2005. 576 p.
24. Kyle UG, Genton L, Karsegard L, Slosman DO, Pichard C. Single prediction equation for bioelectrical impedance analysis in adults
aged 20--94 years. Nutrition. 2001;17(3):248-53.
25. Matsudo S, Araújo T, Marsudo V, Andrade D, Andrade E, Braggion G. Questinário internacional de atividade f1sica (IPAQ): estudo de validade e reprodutibilidade no Brasil. Rev bras ativ fís
saúde. 2001;6(2):05-18.
26. Hallal PC, Gomez LF, Parra DC, Lobelo F, Mosquera J, Florindo AA, et al. Lições aprendidas depois de 10 anos de uso do IPAQ no Brasil e Colômbia. Journal of Physical Activity and Health.
2010;7((suppl 2)):S259-S64.
27. Laboratories ACoPSfCPF. ATS statement: guidelines for the six-minute walk test. American journal of respiratory and critical care
medicine. 2002;166(1):111.
28. Dourado VZ, Vidotto MC, Guerra RLF. Reference equations for
29. Freedson PS, Melanson E, Sirard J. Calibration of the Computer Science and Applications, Inc. accelerometer. Med Sci Sports
Exerc. 1998;30(5):777-81.
30. Jakicic JM, Winters C, Lagally K, Ho J, Robertson RJ, Wing RR. The accuracy of the TriTrac-R3D accelerometer to estimate
energy expenditure. Med Sci Sports Exerc.1999;31(5):747-54.
31. Caspersen CJ, Powell KE, Christenson GM. Physical activity,
exercise, and physical itness: deinitions and distinctions for health-related research. Public Health Rep. 1985;100(2):126-31.
32. Torquato E, Gerage A, Meurer S, Borges R, Silva M, Benedetti T. Comparação do nível de atividade física medido por acelerô-metro e questionário IPAQ em idosos. Rev. bras. ativ. fís. saúde.
2016;21(2):144-53.
33. Oguma Y, Osawa Y, Takayama M, Abe Y, Tanaka S, Lee IM, et al. Validation of Questionnaire-Assessed Physical Activity in Comparison with Objective Measures Using Accelerometers and Physical Performance Measures Among Community-Dwelling
Adults Aged >/=85 Years in Tokyo, Japan. J Phys Act Health.
2016:1-28.
34. Chandonnet N, Saey D, Almeras N, Marc I. French Pregnancy Physical Activity Questionnaire compared with an accelerometer cut point to classify physical activity among pregnant obese
women. PloS one. 2012;7(6):e38818.
35. Guthold R, Ono T, Strong KL, Chatterji S, Morabia A. Worldwide variability in physical inactivity a 51-country survey. Am J Prev
Med. 2008;34(6):486-94.
36. Florindo AA, Hallal PC. Epidemiologia da atividade física.
Florindo AA, editor. São Paulo: Atheneu; 2011. 210 p.
37. Monteiro CA, Conde WL, Matsudo SM, Matsudo VR, Bonsenor IM, Lotufo PA. A descriptive epidemiology of leisure-time physical activity in Brazil, 1996-1997. Rev Panam Salud Publica.
2003;14(4):246-54.
38. Siqueira FV, Facchini LA, Piccini RX, Tomasi E, Thume E, Silveira DS, et al. [Physical activity in young adults and the elderly in areas covered by primary health care units in
munici-palities in the South and Northeast of Brazil]. Cad Saude Publica. 2008;24(1):39-54.
39. Chastin SF, Culhane B, Dall PM. Comparison of self-reported measure of sitting time (IPAQ) with objective measurement
(activPAL). Physiol Meas. 2014;35(11):2319-28.
40. Oyeyemi AL, Umar M, Oguche F, Aliyu SU, Oyeyemi AY. Accelerometer-determined physical activity and its comparison with the International Physical Activity Questionnaire in a sample
of Nigerian adults. PLoS One. 2014;9(1):e87233.
41. Ottevaere C, Huybrechts I, De Bourdeaudhuij I, Sjostrom M, Ruiz JR, Ortega FB, et al. Comparison of the IPAQ-A and actigraph in
relation to VO2max among European adolescents: the HELENA
study. J Sci Med Sport. 2011;14(4):317-24.
42. Hagstromer M, Ainsworth BE, Oja P, Sjostrom M. Comparison of a subjective and an objective measure of physical activity in a
population sample. J Phys Act Health. 2010;7(4):541-50.
43. Boyle T, Lynch BM, Courneya KS, Vallance JK. Agreement between accelerometer-assessed and self-reported physical activ-ity and sedentary time in colon cancer survivors. Support Care
Cancer. 2015;23(4):1121-6.
44. Harris TJ, Owen CG, Victor CR, Adams R, Ekelund U, Cook DG. A comparison of questionnaire, accelerometer, and pe-dometer: measures in older people. Med Sci Sports Exerc.
2009;41(7):1392-402.
45. Sabia S, Cogranne P, van Hees VT, Bell JA, Elbaz A, Kivimaki M, et al. Physical Activity and Adiposity Markers at Older Ages: Accelerometer Vs Questionnaire Data. J Am Med Dir Assoc. 2015.
Acknowledgements
The authors would like to thank the Angiocorpore Institute of Cardiovascular Medi-cine for providing support for clinical assessment and cardiopulmonary exercise tests. We also would like to thank Dr. Philipe Rachas Saccab for supervising a
signiicant number of cardiopulmonary exercise tests.
Funding Resources
São Paulo Research Foundation (FAPESP), grant no. 2011/07282-6 supported this study.
Corresponding author
Rodrigo Pereira da Silva
Universidade Metropolitana de Santos, Conselheiro Nébias Avenue, 536, Encruz-ilhada, Santos, SP. Brasil.
Email: [email protected]
Manuscript received on September 26, 2016 Manuscript accepted on March 12, 2017