Printed in Brazil - ©2002 Sociedade Brasileira de Química 0103 - 5053 $6.00+0.00
Article
* e-mail: [email protected]
Collision-Induced Effects on the Dielectric Properties of Liquid Dimethylsulfoxide
Sérgio M. Vechi and Munir S. Skaf *
Instituto de Química, Universidade Estadual de Campinas, CP 6154, 13083-970 Campinas - SP, Brazil
É apresentado um estudo por simulação de dinâmica molecular das propriedades dielétricas do dimetil sulfóxido líquido, onde são incluídos efeitos de indução devido à polarizabilidade molecular através de perturbação em primeira ordem. Neste formalismo, os dipolos induzidos são computados a partir de trajetórias geradas pelos potenciais intermoleculares isentos de forças indutivas. Propriedades dielétricas estáticas e dinâmicas são computadas para as versões polarizável e não-polarizável da densidade dipolar. As análises indicam que o principal papel das componentes de indução nesta abordagem é o de renormalizar o valor das flutuações estáticas dos dipolos permanentes, sendo apenas marginal a influência sobre as propriedades de relaxação no regime de difusão rotacional que caracteriza o espectro na região de micro-ondas. Entretanto, para maiores frequências, onde a absorção dielétrica é predominantemente determinada por movimentos intermoleculares libracionais, os efeitos dinâmicos da polarizabilidade molecular são mais aparentes. Na presença de contribuições indutivas, o máximo do espectro infravermelho obtido das simulações está em melhor concordância com recentes medidas espectroscópicas da dinâmica intermolecular deste líquido.
We present a molecular dynamics (MD) simulation study of the dielectric properties of liquid dimethyl sulfoxide that includes interaction-induced effects due to molecular polarizability using a perturbative scheme in which the induced dipoles are computed a posteriori from the MD trajectories generated without explicit inductive forces. Static and dynamical quantities of relevance to the dielectric characterization of the liquid are reported for both polarizable and nonpolarizable versions of the system’s collective dipolar densities. Our analysis within this scheme indicates that the role of the interaction induced contributions is predominantly to renormalize the magnitude of the permanent dipole fluctuations, with marginal effects upon the system’s dielectric relaxation in the rotational-diffusion, microwave region of the spectrum. At higher frequencies, however, where the dielectric absorption is dominated by fast intermolecular librational motions, the dynamical effects of the molecular polarizability are more pronounced. In the presence of interaction induced contributions, the location of the peak in the MD far infrared absorption coefficient is in much better agreement with recent spectroscopic measurements of the intermolecular dynamics of this liquid.
Keywords: dielectric relaxation, molecular dynamics of liquids, dimethyl sulfoxide
Introduction
Dimethyl sulfoxide (DMSO) is a highly polar (µ≈4.3D) aprotic solvent which has broad practical applications in chemical, biochemical, and pharmaceutical sciences.1-3 It
has been widely used as crioprotectant agent of biological tissues because it prevents water from freezing within cells, and as a coadjuvant drug carrier because of its high permeability across biomembranes.3 It is also one of the
most popular protein-dissolving organic solvents. The behavior of DMSO aqueous solutions has also attracted a great deal of interest because of the large deviations from
ideal mixing found in several physicochemical properties.4-13 The prevailing view is that most of these
effects are associated with DMSO’s strong hydrophilic nature, which leads to the formation of stoichiometrically well-defined DMSO-water aggregates and pronounced structural microheterogeneities.10,14-17 Hydrophobic
hydration effects may also play a role in the structural properties of these mixtures.18
The wealth of interesting experimental data on DMSO systems has prompted several theoretical and computer simulation studies seeking to better understand this liquid from a microscopic perspective.14-17,19 In the last ten years
mixtures.15,20-23 Some of these interaction potential models
have also been subject to extensive molecular dynamics (MD) simulations specially aimed at characterizing their dielectric behavior.24-25 It is found that the dielectric
constant of all simulated models are in good agreement with the experimental estimates for DMSO at room temperature. The dipole-dipole spatial correlations as measured by the Kirkwood g-factors and the dipolar symmetry projetions,26h11R (R = 0.2), are consistent with the
physical picture portrayd by several experimental measurements which suggest that DMSO molecules form head-to-tail dipole chains such that adjacent chains have dipoles pointing in opposite directions.24 This local
structure, reminiscent of the solid phase,4 is predominantly
due to dipolar interactions.
The keen interest in the dielectric behavior of polar liquids is largely due to the fact that these properties are essential to characterize the liquid as a reactional medium for chemical processes involving ionic or polar species.27
Dielectric properties such as dielectric constants, dielectric relaxation times, frequency dependent far infrared (FIR) absorption coefficients, and longitudinal dielectric relaxation times are key ingredients to the description of a variety of physicochemical phenomena, specially solvation dynamics and charge transfer reactions.28 Unlike the static
(i.e., zero frequency) dielectric behavior of DMSO, which
has been well described by MD simulations,24 the
dynamical or relaxation properties still need further studies. In particular, we mention that the main relaxation time obtained from our previous MD simulations25 using
the nonpolarizable P2 model (~16 ps) is roughly 30% too low compared with experimental values. Although, discrepancies like these between simulated and experimental estimates are not uncommon for dielectric properties in view of their complexity from a molecular standpoint, it is highly desirable to explore alternative routes that might lead to improvements in the modelling of such properties.
The force fields for liquid DMSO available in the literature consist of nonpolarizable interaction potentials. Therefore, a feature common to previous simulations of these systems is the lack of collision-induced effects that are present in the real liquid due to the molecular polarizability. In other polar liquids such as acetonitrile, methanol, water, and carbonyl sulfide (OCS), for instance, polarizability effects have been shown to be an important component of their dynamic dielectric behavior, including the line shape of the FIR absorption spectra.29-32 The
question then arises as to what extent induced dipoles contribute to the dielectric properties of DMSO. In order to address this problem, we have carried out lengthy (5 ns)
MD simulations in which the effects of molecular polarizability upon the liquid dielectric properties are taken into account within the context of a first order perturbation theory, analogous to that implemented for acetonitrile,29 metanol,30 and water.31 In this approach, the
MD trajectories are generated exclusively under the original nonpolarizable Hamiltonian. At each timestep, the electric field set up by the permanent interaction-site charges is used to evaluate the induced dipoles assuming a model polarizability tensor. Our primary goal is to investigate on general grounds the effects of the induced dipoles upon the simulated dielectric relaxation and the FIR spectrum of DMSO.
Computational Details
Interaction potentials and simulations
We have used the P2 interaction model for liquid DMSO developed by Luzar and Chandler,15 which consists of four
interaction sites representing the oxygen atom (O), sulfur (S), and the methyl groups (C) treated as united atoms centered at the carbons. The molecular geometry is kept fixed with bond lengths OS=1.53Å and SC=1.80Å, and bond angles OSC=107.75° and CSC=97.4°. This model has been used in previous simulations and reproduces well several physicochemical properties of DMSO.15,24 The
potential energy between molecules i and j is a sum of site-site pair interactions involving standard (6-12) Lennard-Jones plus Coulombic terms
∑
− + −=
αγ αγ α γ αγ α γ
j i coul j i
lj v
v ) j , i (
v r r r r (1)
− =
6 12
4
r r
vlj αγ αγ
αγ αγ
σ σ
ε (2)
r e q q ) r ( vcoul
0 2
4πε γ α
αγ = (3)
In these equations, rαi denotes the position of the α-th
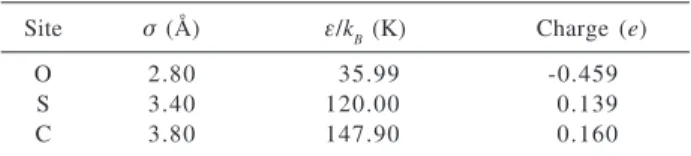
site in the i-th molecule, and qα identifies the site charge in units of the electron charge, e. Additional details of the intermolecular potential parameters are given in Table 1. The simulations were performed in the NVE ensemble with N=500 DMSO molecules placed in a periodically replicated cubic box whose dimensions are such as to reproduce the liquid density at an average temperature of 298 K.5 Lennard-Jones forces were cut-off at half the box
with conducting boundaries to ensure proper treatment of the dielectric properties within the formalism used here.33
The equations of motion were integrated with SHAKE34
leap-frog algorithms35 with a timestep of 6 fs. Total energy
conservation is achieved within 0.2% during unperturbed 24 ps runs. Approximately 200 of such runs were used for data analysis, each separated by smaller runs (4 ps) during which the velocities were rescaled to the desired temperature of 298 K. The trajectories were discarded during velocity rescaling.
Molecular polarizability model
Ideally, in the simulation of dielectric properties of liquids, one would like employ model potentials that fully embody the fluctuating nature of the molecular charge distribution due to interparticle interactions. However, the intrinsic many-body nature of polarizable Hamiltonians renders such simulations quite demanding computationally, which explains the scarcety of simulation studies of dielectric properties using polarizable potentials. In contrast, nonpolarizable force fields, such as the P2 potential for DMSO, in which the magnitude of the electric multipole moments are held fixed, are widely used because of their pairwise additivity. The success of nonpolarizable models in describing dielectric properties reasonably well relies in the enhancement of the molecular dipole moment with respect to the gas phase value, which is typical of most models. For the P2 model specifically, one has µ = 4.48 D, while the gas phase value for DMSO is estimated at 3.93 D. This dipole enhancement takes into account some of the interaction induced effects present in real condensed phases. Nevertheless, potentially important dynamical effects may be entirely left out.
In order to gain better understanding of the role of induced dipoles on the dielectric properties of the P2 model, we treat induction effects more explicitly by considering the contributions from induced dipoles to the collective polarization of the system but without considering the forces due to induction in the equations of motion.29-30 In this scheme, the electric field on each
molecule along the MD trajectory generated by the nonpolarizable P2 potential is used to compute the induced dipole according to
µiI = α
i• Ei (4)
Here, αi is the polarizability tensor of molecule i rotated into the lab frame of reference and Ei is the electric field at the center of molecule i created by all the other molecules in the system. The molecular induced dipoles µiI, therefore, fluctuate with time. The molecular polarizability tensor expressed in the body-fixed coordinate axes has been obtained from Thole’s model36 and is given by:
α
=
676 8 000 0 000 0
000 0 006 7 705 0
000 0 705 0 601 7
. . .
. . .
. . .
Å3. (5)
The molecular coordinate axes are defined with the z axis along the SO bond while the xy plane bisects the CSC angle. Diagonalization of this tensor yields α1 = 8.07, α2 -8.86, and α3 = 6.54 Å3 for the principal polarizabilities.
The molecular polarizability, α– = 1/3Trα = 7.76 Å3, is in
good agreement with the experimental values of Miller37
(7.97 Å3) and Pacak38 (8.00 Å3).
Theoretical Background
Within linear response theory, the frequency dependent macroscopic dielectric permittivity of an infinite system (albeit an infinitely periodic one) is given by:39
ε(ω) – ε∞ = 9y[Ψ(0) + iω∫0∞dtΨ(t)eiwt], (6) where y = Nµ2/9Vk
BTε0 is the usual dipolar strength of the system and
Ψ(t) = 〈M(t) . M(0)〉/(3Nµ2) (7)
is the unnormalized time-correlation function (TCF) of the system’s (collective) dipole density
N
M(t) = Σ {µi0(t) + µ
i
I(t)} = M0(t) + MI(t), (8) i
which has contributions from permanent, µi0(t), and induced, µiI(t), molecular dipole moments. Accordingly,
Ψ(t) has contributions from permanent and induced
autocorrelations as well as from cross-correlations between permanent and induced components:
Ψ(t) = Ψ00(t) + Ψ0I(t) + ΨII(t), (9)
Table 1. Potential energy parameters for the P2 model of liquid
DMSO
Site σ (Å) ε/kB (K) Charge (e)
O 2.80 35.99 -0.459
S 3.40 120.00 0.139
C 3.80 147.90 0.160
with
Ψ00(t) = 〈M0(t) . M0(0)〉/(3Nµ2) (10) Ψ0I(t) = 2〈M0(t) . MI(0)〉/(3Nµ2) (11) ΨII(t) = 〈MI(t) . MI(0)〉/(3Nµ2) (12)
In a highly polar fluid such as DMSO, the µiI(t) dipole moments are predominantly induced by the collection of permanent molecular dipoles µi0(t). The dynamics of the
total induced dipole MI(t) is then expected to be strongly influenced by its permanent counterpart M0(t). The distinct
relaxation mechanisms due to interaction-induced dipoles can be conveniently investigated by projecting out of MI(t) the part that relaxes as M0. According to the projection scheme of Madden and Kivelson,39,40 the induced collective
dipole is separated into “local field” and “collision-induced” contributions:
MI(t) = GM0(t) + ∆MI(t), (13)
where
G = 〈M0(0) . MI(0)〉/〈|M0(0)|2〉 (14) is the static projection of the induced collective dipole over the permanent one (it is, therefore, a measure of the extent of static correlation between permanent and induced dipoles). The quantity
∆M(t) = MI(t) – GM0(t) (15) represents the fluctuations of the induced moments around the permanent collective dipole renormalized by the induced effects. Notice that unlike MI(t), the vector ∆M(t) is orthogonal to M0(t) at any given time (i.e., 〈∆M(t) . M0(t)〉 = 0). In terms of projected variables, the total time-correlation function, equation 9, can be separated into a purely “reorientational” (R), a “collision-induced” contribution (∆), and their cross correlation (X):
Ψ(t) = ΨR(t) + ΨX(t) + Ψ∆(t), (16)
with
ΨR(t) = (1 + G)2Ψ00(t) (17)
and
ΨX(t) = 2(1 + G) 〈∆M(t) . M0(0)〉/(3Nµ2) (18)
Ψ∆(t) = 〈∆M(t) . ∆M(0)〉/(3Nµ2). (19)
In these equations, Ψ∆(t) is the collision-induced
collective dipole autocorrelation, and ΨX(t) is the cross-correlation between collision-induced and renormalized permanent collective dipole. Notice that ΨX(0) = 0.
Results and Discussion
Static Properties
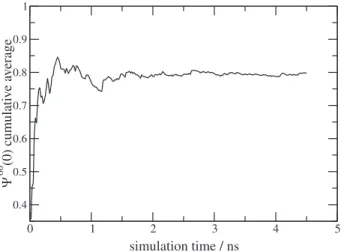
We begin discussing our data by providing some quantitative assessment on the how the computed quantities vary with the length of the simulation run. This is specially important in view of the notoriously slow convergence of static dielectric properties calculated from computer simulations.41,42 For that purpose, we display in
Figure1 the cumulative average of Ψ00(0) as a function of the simulation time (in units of ns). The values of Ψ0I(t) and ΨII(t) converge a little faster than the purely permanent dipole contribution and, therefore, are not shown. As clearly shown, the computed static correlations are well-converged within the length of our simulations.
Results for the static dielectric constant of the simulated model and its various contributions are collected in Table 2. By considering only the permanent dipoles, the value of ε(0) - ε∞ is 41.7, in reasonable agreement with the experimental data, (ε(0) - ε∞)exp = 42.7,12 as noted earlier.24
When induced effects are taken into account, ε(0) - ε∞, which by virtue of Eqs. (6), (9)-(12) equals 9y[Ψ00(0) +
Ψ0I(0) + ΨII(0)], jumps to 68.5. This value is roughly 50% too large compared to experiments and should not be unexpected since some of the induced effects were already
Figure 1. Cummulative average of the mean squared permanent
implicitly incorporated into the intermolecular potencial model in order to reproduce thermodynamic and structural features of DMSO without explicit induction forces.15 A
smaller value, ε(0) - ε∞ = 57.5, is obtained if the gas phase dipole moment is used to compute the collective dipoles. This is equivalent to scaling the quantity Ψ00(0) by [µgas/
µP2]2 and Ψ0I(0) by µgas/µP2 (see Eqs. (6)-(12)).43 This value
for the dielectric constant is still substantially larger than the experimental data, but again, the situation is unescapable within the present formalism since the structure of the simulated liquid itself results from a molecular model whose dipole moment corresponds to the condensed phase value. Similar observations have been made in previous studies.29-31
Further inspection of Table 2 shows that induced dipoles autocorrelation (ΨII) corresponds to less than 10% of the permanent counterpart, Ψ00, while the cross-correlations between permanent and induced dipoles, Ψ0I, is nearly 50% of Ψ00. This indicates that a large portion of the induced dipoles does follow the permanent ones. In terms of projected variables, one can see clearly through the magnitudes of ΨR and Ψ∆, that the main effect of the
induced dipoles upon the static dielectric properties is to enhance the value of the purely permanent dipole autocorrelation through a local field factor L = (1 + G)2 =
1.656 (cf. equation 17). Similar observations have been made in simulation studies of induction effects in acetonitrile29 and methanol.30
The results reported above can be used to test molecular theories of dielectric properties of polarizable polar fluids. In the celebrated theory of Madden and Kivelson, 39 the
local field factor is given by
2
3 2
+
= ε∞
L (20)
when one neglects anisotropies in the molecular polarizability tensor, which in our case is a justified approximation (cf. equation 5). Using the experimental value ε∞ = 2.008 for DMSO, taken as the square of the optical index of refraction (n=1.417), we obtain from the equation above L=1.785. The results for L obtained from our simulations and from the Madden and Kivelson theory are in good agreement with each other. One of the
implications of this result, along with the finding that Ψ∆
<< Ψ00 (see Table 2), is that the Kirkwood-Fröhlich
formula,39
K B
Lg T Vk
N
0 2
) 0 (
)] 0 ( 2 ][ ) 0 ( [
ε ε
ε ε ε
ε − ∞ ∞+ = µ
, (21)
frequently used by experimentalists to estimate the reorientational Kirkwood g-factor gk, is justified for liquid DMSO. We note in passing that using the experimental data reported by Kaatze12 in this equation, yields g
k = 1.04, which compares roughly with the simulated value of 1.60, as discussed elsewhere.24
Dynamical Behavior. Time Domain
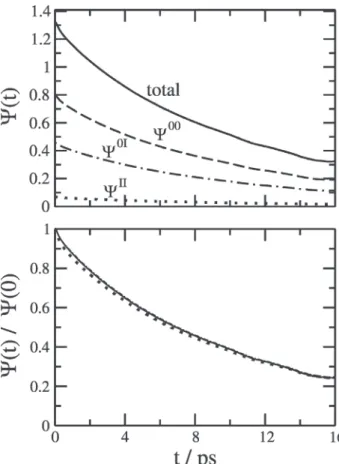
In Figure 2 we present the corresponding contributions of permanent and induced dipoles to the relaxation of M(t) over the time interval 0-16 ps. The contributions from
Ψ00(t) are the largest, followed by the cross-correlation
between permanent and induced dipoles, Ψ0I(t), and the
Table 2. Static dielectric properties obtained from the MD
simula-tions. The dipolar strength for the simulated system is y = 5.79
ε(0) - ε∞ Ψ00(0) Ψ0
I(0) ΨII(0) ΨR(0) Ψ∆(0)
68.5 0.800 0.457 0.069 1.328 0.0035
Figure 2. a) MD results for the time correlation functions of total
collective dipole, Ψ00(0) (solid line), permanent dipoles contribu-tions, Ψ00(t) (dashed line), induced dipoles autocorrelation, ΨII(t)
(dotted line), and the cross-correlation between permanent and in-duced dipoles, Ψ0I(t) (dashed-dotted line). b) The time correlation
induced dipoles autocorrelation, ΨII(t). At early times,
Ψ0I(t) and ΨII(t) contribute roughly 50% and 10% of Ψ00(t),
and the relaxation of induced dipole dependent TCFs follow closely that of the permanent dipole TCF. In order to show this more clearly we have displayed the TCFs normalized by their respective initial values Ψ00(0), Ψ0I(0), and ΨII(0) in the lower panel of Figure 2. The data shows that a major portion of MI(t) projects along M0(t), and thus
relaxes at similar rates.
The collective dipolar relaxation described in terms of projected variables is depicted in Figure 3, where the reorientational, ΨR(t), collision-induced, Ψ∆(t), and cross, ΨX(t), contribuitons are shown by solid, dashed, and dotted lines, respectively. Because of their small t=0 values (cf. Table 2), Ψ∆(t) and ΨX(t) had to be greatly enhanced in order to fit the same scale as the reorientational TCF. The scale factors in Figure 3 are 400 and 100, respectively. This is another indication of the fact that the role of induced dipoles is mainly to rescale the permanent dipoles which provide the dominant relaxation mechanism in DMSO. The projected variables TCFs behave very differently over distinct timescales. Like Ψ00(t), ΨR(t) is a slowly decaying function due to the predominant role of rotational-diffusion mechanism in the collective dipole reorientational relaxation. Unlike hydrogen-bonding
liquids such as water and methanol,42 librational
oscillations at short-times are not apparent in ΨR(t). The collision-induced dipole (i.e., the remainder of MI(t) after projection, (cf. equation 15) relaxes at a much faster rate than the permanent or reorientational components. The collision-induced autocorrelation Ψ∆(t) exhibits a
remarkably fast decay, losing about 80% of its initial value within approximately 1.5 ps. The cross-correlation between collision-induced and reorientational components, ΨX(t), exhibits a fast and small transient decrease up to ~0.15 ps, and then rises rapidly to a maximum value within 2-3 ps. For larger times, ΨX(t) decays slowly, on a timescale comparable to rotational relaxation.
The main dielectric relaxation time of the simulated model is obtained from the characteristic decay of the collective dipole TCFs in the rotational-diffusion regime. Polar liquids, specially of low molecular symmetry, may present multiple time scales in their dielectric relaxation, which is often well described by a sum of exponentials with different time constants and sometimes by stretched exponential functions. In the case considered here, the normalized collective dipole TCF can be well fitted by a biexponential for t > 0.8ps, i.e.,
Ψ(t)/Ψ(0) ~ a1 exp(–t/τ1) + a2 exp(–t/τ2) t> 0.8ps. (22) Following the notation of our previous works, we shall denote Φ(t) ≡ Ψ(t)/Ψ(0) the normalized collective TCFs. We have fitted equation (22) to our Φ00(t), Φ0I(t), and ΦII(t) data (cf. Figure 2, lower panel). Our best fitting parameters are listed in Table 3. The characteristic decay times, τ1 and
τ2, are quite different, indicating the presence of more than one time scale in the collective dipole relaxation. The magnitude of the a1 and a2 factors suggest that the slowest exponential component dominates somewhat the decay, but by no means the dielectric relaxation can be considered Debye-like,44 except perhaps for times considerably longer
than τ1 (i.e., t >> 5ps). Comparison with available experimental data can be established through the long time asymptotic decay of the TCFs, that is, τ2, or through the overall dielectric relaxation time, τD, obtained from the time integral of the normalized TCFs. The values of τD computed from the permanent dipoles normalized TCF (Φ00(t) ≡ Ψ00(t)/Ψ00(0)) and from the total normalized TCF (Φ(t) ≡ Ψ(t)/Ψ(0), cf. equation 9) are τD = 13 ps and τD = 14 ps, respectively. These values are roughly 30% too low compared to the experimental main dielectric relaxation time (~ 21 ps).12,13 In addition, we see that including
Table 3. Biexponential fits to the normalized time correlation
func-tions for t>0.8 ps
a1 τ1/ps a2 τ2/ps
Φ(t) 0.160 3.63 0.812 12.94
Φ00(t) 0.290 4.69 0.682 16.75
Φ0I(t) 0.101 2.39 0.884 12.15
ΦII(t) 0.473 6.39 0.473 18.69
Figure 3. Time correlation functions of the projected variables. The
reorientational and collision-induced autocorrelations, ΨR(t) and
Ψ∆(t), are depicted by dashed and dotted lines, respectively. The cross-correlation between projected variables, ΨX(t), is shown by a
dashed-dotted line. The Ψ∆(t) and ΨX(t) functions have been
contributions from induced dipoles has very little impact upon the dielectric relaxation of the model DMSO considered here. Obviously, this result does not preclude the possibility of improving the simulated dielectric relaxation with respect to experiments by considering induced forces a priori within the MD simulations. This approach, however, would require a complete reparametrization of the intermolecular potential and is beyond the purpose of the present work.
Frequency Dependence
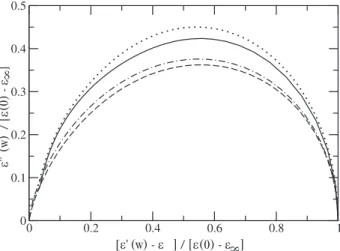
Further comparision with experimental dielectric relaxation can be made through the frequency dependence of the complex permittivity ε(ω). The real and imaginary parts of the Fourier-Laplace transforms (equation 6) of the collective dipole TCFs can be readily obtained by standard numerical integration using the long-time bi-exponential fits described in the last section. The real, ε’(ω), and imaginary, ε”(ω), parts of the permittivity are represented in the complex plane44 in Figure 4. Simulation results are
shown for the nonpolarizable model (i.e., permanent dipoles only) and also in the presence of induced effects, along with the experimental data of Refs. [12] and [13]. The experimental permittivity at the highest frequency considered by Kaatze and co-workers, ε∞ = 4.3, is used when interaction induced effects are considered and ε∞ = 1 for the nonpolarizable case. Notice that this ε∞ differs from the true optical value of 2.008 which applies to frequencies much higher than the ones we consider in Figure 4. The data depicted in Figure 4 emphasizes largely
the dielectric spectra in the microwave region, whereas high frequency components (>10 cm-1) are seen only near
the origin. The overall shapes of the simulated data in the microwave region resemble closely the experimental curves, indicating that radiation dispersion and absorption mechanisms in this frequency range are essentially captured by the simulated models. By including induced dipoles, the simulated curve shifts towards the experimental ones. Although the effects are small, it suggests that interaction induced contributions decrease the dielectric relaxation rate.
The high-frequency librational motions of polar liquids can be experimentally detected through a variety of spectroscopic techniques, of which the far infrared (FIR) absorption spectra is the most widely used. The frequency dependent FIR absorption coefficient is related to the imaginary part of the permittivity according to: 44
) ( c ) ( n
) ( )
( ε" ω
ω ω ε ε ω
α = 0 − ∞
, (23)
where n(ω) is the frequency dependent refractive index and c the speed of light in vacuum. The simulated FIR spectrum is more conveniently computed as the function
∫
∞∞ = − =
0 2
0) (t)cos( )dt
( ) ( n ) ( ) (
F ω ω
ε ε
ω ω α
ω Φ . (24)
The F(ω) spectra were calculated for the total dipoles TCF, Φ(t), permanent dipoles, Φ00(t), induced dipoles, ΦII(t), and cross-correlation, Φ0I(t). The results are shown in Figure 5, where the bi-exponential fits have been used to obtain smooth spectra. Spectra for the projected variables TCFs (cf. equation 17-19) turned out very noisy because of the non-exponential decay of the ΨX(t) component and are, therefore, not shown. The spectrum for the permanent plus induced dipoles TCF (solid line) peaks at 45 cm-1 with width at half-height of approximately
100 cm-1. The peak position of the librational band is
considerably red shifted with respect to ealier experimental data on DMSO, which quote band maxima near 85 cm-1.45-47
However, very recent experimental studies48 of the
intra-and intermolecular dynamics of DMSO using optical heterodyne Kerr spectroscopy indicate a librational band peaked at 50 cm-1, which agrees very well with our
simulations. By considering only the permanent dipoles (dotted line), the band peaks at 40 cm-1, while the spectra
for the induced dipoles (dashed line) is peaked at 60 cm-1.
The bandshape and widths of all the spectra shown are very similar, which is another indication of the fact that the induced dipoles tend to follow the permanent ones.
Figure 4. Dispersion between the real (ε’) and imaginary (ε”) parts
Nevertheless, the characteristic frequency of librational relaxation is higher (faster) for the induced components. Therefore, the data shows that induced dipoles play an important role in the absorption coefficient in the frequency region dominated by intermolecular librational dynamics, and that interaction induced effects brings the simulated FIR spectral peak in closer agreement with the most recent experimental data available.
Closing Remarks
In this work we report an MD simulation study of the dielectric relaxation and FIR spectra of DMSO in which interaction induced effects are taken into account by means of a first order perturbation scheme that has been used previously in liquids of similar polarity such as acetonitrile and methanol. The approach requires a molecular polarizability tensor which has been modeled via Thole’s modified dipole-dipole tensor, yielding an average molecular polarizability in good agreement with experimental data and quantum chemical calculations. The MD trajectories were generated using the nonpolarizable P2 model of DMSO, whose thermodynamics, structure and dynamic properties had been previously studied by us and others. The electric fields created by the sites’ partial charges at each MD timestep are then used in conjunction with the polarizability tensor to compute the induced dipole on each molecule. Permanent and induced collective dipoles at each timestep are calculated and stored for analysis of the static dielectric properties, dielectric relaxation, and FIR absorption spectra.
We find that the collective induced dipoles are largely projected along the permanent counterpart, such that the leading effect of the interaction induced contributions is to renormalize the collective permanent dipole fluctuations through the local field factor. The dielectric constant calculated in the presence of induced dipoles is considerably larger than the experimental value as expected, since some of the static effects of molecular polarizability were already taken into account in the original parametrization of the P2 intermolecular potential. Moreover, the local field factor obtained from our simulation is in good agreement with the Madden-Kivelson theory and indicates that the Kirkwood-Fröhlich formula is a bona fide approximation to experimentally estimate the reorientational Kirkwood g-factor of liquid DMSO given that ε(0) and ε∞ are directly measured.
In terms of the dynamics, we find that the dipolar relaxation is predominantly dominated by reorientational motions of the permanent dipoles with small contributions from interaction induced effects. In the rotational-diffusion regime that characterizes the main dielectric loss in the microwave region of the spectrum, we find that the relaxation is well described by a bi-exponential decay. The overall dielectric relaxation time obtained from permanent dipoles (13 ps) is slightly increased when polarizability effects are considered (14 ps), but the experimental value (~ 21 ps) is still significantly larger. In the higher frequency end of the dielectric spectrum, characterized by the FIR absorption coefficient, we find that the interaction induced contributions are considerably more pronounced. By including polarizability effects, the band maximum in the FIR absorption spectrum shifts to higher frequencies, promoting better agreement between the simulated spectrum and recent spectroscopic measurements of the librational dynamics of liquid DMSO.
Acknowledgments
The authors gratefully acknowledge financial support from FAPESP, FAEP-UNICAMP, and CNPq. We also thank Ed Castner for sending us their experimental data [Ref. 48] prior to publication.
References
1. Martin, D.; Hanthal, H. Dimethyl Sulfoxide; Wiley: New York, 1975.
2. De la Torre, J. C.; Ann. N. Y. Acad. Sci.1983, 411, 1. 3. Jacob, S. W.; Herschler, R. eds.; Biological Actions of
Dimethyl Sulfoxide; New York Academy of Science: New York, 1975, Vol. 243.
0 20 40 60 80 100 120 140 160
w(cm-1)
0 0.1 0.2 0.3 0.4
F(
w
)
induced
total
permanent cross
Figure 5. Frequency dependent far infrared absorption coefficient
4. Safford, G. J; Schaffer, P. C.; Leung, P. S.; Doebbler, G. F.; Brady, G. W.; Lyden, E. F. X.; J. Chem. Phys. 1969, 50, 2140.
5. Cowie, M. G.; Toporowski, P. M.; Can. J. Chem.1964, 39, 224.
6. Fox, F.; Whittingham, K. P.; J. Chem. Soc., Faraday Trans.
1974, 75, 1407.
7. Tommila, E.; Pajunen, A.; Suomen Kemistil. B. 1969, 41, 172. 8. Gordalla, B. C.; Zeidler, M. D.; Mol. Phys. 1986, 59, 817;
Mol. Phys.1991, 74, 975.
9. Packer, K. J.; Tomlinson, D. J.; Trans. Faraday Soc. 1971, 67, 1302.
10. Tokuhiro, T.; Menafra, L.; Szmant, H. H.; J. Chem. Phys.
1974, 61, 2275.
11. Baker, E. S.; Jonas, J.; J. Phys. Chem. 1985, 89, 1730. 12. Kaatze, U.; Pottel, R.; Schäfer, M.; J. Phys. Chem. 1989, 93,
5623.
13. Puranik, S. M.; Kumbharkhane, A. C.; Mehrotra, S. C.; J. Chem. Soc., Faraday Trans. 1992, 88, 433.
14. Vaisman, I. I.; Berkowitz, M. L.; J. Am. Chem. Soc. 1992, 114, 7889.
15. Luzar, A.; Chandler, D.; J. Chem. Phys. 1993, 98, 8160. 16. Soper, A. K.; Luzar, A.; J. Phys. Chem. 1996, 100, 1357; J.
Chem. Phys. 1992, 97, 1320.
17. Borin, I. A.; Skaf, M. S.; Chem. Phys. Lett. 1998, 296, 125; J. Chem. Phys.1999, 110, 6412.
18. Cabral, J. T.; Luzar, A.; Teixeira-Dias, J.; Bellisent-Funel, M.-C.; J. Chem. Phys. 2000, 113, 8736.
19. Luzar, A.; J. Mol. Liq.1990, 46, 221.
20. Rao, B. G.; Singh, U. C.; J. Am. Chem. Soc.1990, 112, 3803. 21. Liu, H.; Müller-Plathe, F.; van Gunsteren, W. F.; J. Am. Chem.
Soc.1995, 117, 4363.
22. Vishnyakov, A.; Lyubarsev, A. P.; Laaksonen, A.; J. Phys. Chem. A 2001, 105, 1702.
23. Fox, T.; Kollman, P. A.; J. Phys. Chem. B 1998, 102, 8070. 24. Skaf, M. S.; J. Chem. Phys.1997, 107, 7996; Mol. Phys.
1997, 90, 25.
25. Skaf, M. S.; J. Phys. Chem. A 1999, 103, 10719.
26. Hansen, J. -P.; McDonald, I. R.; Theory of Simple Liquids, 2nd ed.; Academic Press: London, 1969.
27. Dogonadze, R.; Kalman, E.; Kornyshev, A.; Ulstrup, J., eds.; The Chemical Physics of Solvation; Elsevier: Amsterdam, 1985, Part A.
28. Raineri, F. O.; Resat, H.; Perng, B.-C.; Hirata, F.; Friedman, H. L.; J. Chem. Phys.1994, 100, 1477; Friedman, H. L.; Raineri, F. O.; Hirata, F.; Perng, B.-C.; J. Stat. Phys.1995, 78, 239. 29. Edwards, D. M. F.; Madden, P. A.; McDonald, I. R.; Mol.
Phys. 1984, 51, 1141.
30. Skaf, M. S.; Fonseca, T.; Ladanyi, B. M.; J. Chem. Phys.
1993, 98, 8929.
31. Guillot, B.; J. Chem. Phys.1991, 95, 1543; Guillot, B.; Guissani, Y. In Collision- and Interaction Induced Spectros-copy; Tabisz, G. C., Neuman, M. N., eds; Kluwer: Amsterdam, 1995.
32. Stassen, H.; Dorfmuller, T.; Chem. Phys.1994, 187, 337; Stassen, H.; Steele, W. A.; J. Mol. Struct. (THEOCHEM)1997, 394, 227.
33. de Leeuw, S. W.; Perram, J. M.; Smith, E. R.; Annu. Rev. Phys. Chem.1986, 37, 245; Proc. R. Soc. Lond. A1980, 373, 27; Proc. R. Soc. Lond. A 1980, 373, 57.
34. Ryckaert, J. P.; Ciccotti, G.; Berendsen, H. J. C.; J. Comput. Phys.1977, 23, 327.
35. Allen, M. P.; Tildesley, D. J.; Computer Simulation of Liquids; Clarendon: Oxford, 1987; Hockney, R. W.; Methods Comput. Phys. 1970, 9, 136.
36. Thole, B. T.; Chem. Phys.1981, 59, 341. 37. Miller, K. J.; J. Am. Chem. Soc.1990, 112, 8533. 38. Pacak, P.; J. Sol. Chem.1987, 16, 71.
39. Madden, P. A.; Kivelson, D.; Adv. Chem. Phys. 1984, 56, 467. 40. Edwards, D. M. F.; Madden, P. A.; Mol. Phys. 1984, 51, 1163. 41. Neumann, M.; Steinhauser, O.; Chem. Phys. Lett.1983, 102,
508.
42. Ladanyi, B. M.; Skaf, M. S.; Annu. Rev. Phys. Chem.1993, 44, 335.
43. Although this is a justified procedure, since the gas phase dipole moment is usually used in modelling spectroscopic properties, we prefer to present the data for the t=0 correla-tions for the P2 model exactly as obtained from the simula-tions, that is, without the scaling factor µgas/µP2, in order to avoid potential sources of misunderstanding with other stud-ies on the dielectric propertstud-ies of P2 DMSO.
44. Böttcher, C. J. F.; Bordewijk, P.; Theory of Electric Polariza-tion II, Elsevier: Amsterdam, 1978.
45. The FIR spectrum obtained for the P2 potential is peaked at 50 cm-1, while Bulkin46 and Guillot et al.47 quote FIR bands peaked at 83 and 88 cm-1, respectively.
46. Bulkin, B. J.; Helv. Chim. Acta1969, 52, 1348.
47. Guillot, B.; Marteau, Ph.; Obriot, J.; J. Chem. Phys. 1990, 93, 6148.
48. Wiewior, P. P.; Shirota, H.; Castner, E. W.; J. Chem. Phys.
2002, 116, 4643.
Received: December 19, 2001 Published on the web: June 24, 2002