ACPD
10, 14815–14873, 2010Evaluation of Collection 5 MODIS
aerosol over land
R. C. Levy et al.
Title Page
Abstract Introduction
Conclusions References
Tables Figures
◭ ◮
◭ ◮
Back Close
Full Screen / Esc
Printer-friendly Version Interactive Discussion
Discussion
P
a
per
|
Dis
cussion
P
a
per
|
Discussion
P
a
per
|
Discussio
n
P
a
per
Atmos. Chem. Phys. Discuss., 10, 14815–14873, 2010 www.atmos-chem-phys-discuss.net/10/14815/2010/ doi:10.5194/acpd-10-14815-2010
© Author(s) 2010. CC Attribution 3.0 License.
Atmospheric Chemistry and Physics Discussions
This discussion paper is/has been under review for the journal Atmospheric Chemistry and Physics (ACP). Please refer to the corresponding final paper in ACP if available.
Global evaluation of the Collection 5
MODIS dark-target aerosol products over
land
R. C. Levy1,2, L. A. Remer2, R. G. Kleidman1,2, S. Mattoo1,2, C. Ichoku2, R. Kahn2, and T. F. Eck3,2
1
Science Systems and Applications Inc., Lanham, MD, USA 2
NASA/Goddard Space Flight Center, Greenbelt, MD, USA 3
Goddard Earth Science and Technology Center, Baltimore, MD, USA
Received: 13 April 2010 – Accepted: 4 June 2010 – Published: 16 June 2010
Correspondence to: R. C. Levy ([email protected])
ACPD
10, 14815–14873, 2010Evaluation of Collection 5 MODIS
aerosol over land
R. C. Levy et al.
Title Page
Abstract Introduction
Conclusions References
Tables Figures
◭ ◮
◭ ◮
Back Close
Full Screen / Esc
Printer-friendly Version Interactive Discussion
Discussion
P
a
per
|
Dis
cussion
P
a
per
|
Discussion
P
a
per
|
Discussio
n
P
a
per
|
Abstract
NASA’s MODIS sensors have been observing the Earth from polar orbit, fromTerra since early 2000 and from Aqua since mid 2002. We have applied a consistent re-trieval and processing algorithm to both sensors to derive the Collection 5 (C005) dark-target aerosol products over land. Here, we co-locate the MODIS field of view 5
aerosol retrievals with Level 2 AERONET sunphotometer measurements at over 300 sites, and find 85 000 matched pairs that represent mutually cloud-free conditions. From these collocations, we validate the total aerosol optical depth (AOD or τ) prod-uct, and define the expected error (EE) as ±(0.05+0.15τ). Since we find that >66% (one standard deviation) of MODIS AOD values compare to AERONET within EE, we 10
can consider global AOD to be validated. However, MODIS does not compare as well to AERONET at particular sites and seasons. There are residual biases that are cor-related with ˚Angstrom exponent, scattering angles, and scene reflectance conditions, resulting from assumptions about the aerosol optical properties and surface conditions that are not accurate everywhere. Although we conclude that the AOD over land is 15
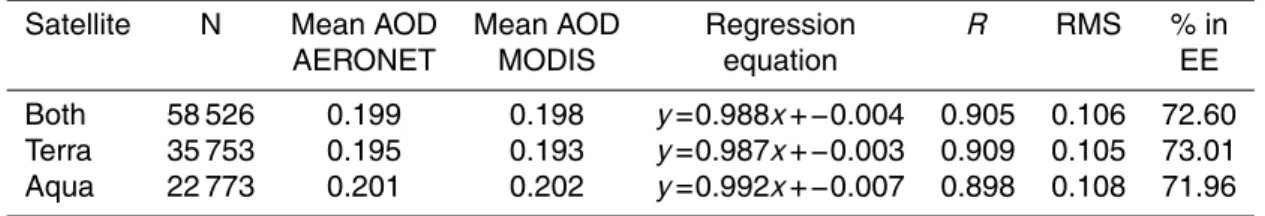
globally quantitative, MODIS-derived parameters of aerosol size over land ( ˚Angstr ¨om exponent, fine AOD) are not. When separating data into those derived from Terra ver-sus those from Aqua, scatterplots to AERONET are nearly indistinguishable. However, while Aqua is stable, Terra shows a slight trend in its bias with respect to AERONET; overestimating (by∼0.005) before 2004, and underestimating by similar magnitude af-20
ter. This suggests small, but significant calibration uncertainties of<2%, which could lead to spurious long-term aerosol trends.
1 Introduction
As components in Earth’s global climate system, global aerosol distribution and loading must be characterized in order to understand their impacts. The climate and aerosol 25
ACPD
10, 14815–14873, 2010Evaluation of Collection 5 MODIS
aerosol over land
R. C. Levy et al.
Title Page
Abstract Introduction
Conclusions References
Tables Figures
◭ ◮
◭ ◮
Back Close
Full Screen / Esc
Printer-friendly Version Interactive Discussion
Discussion
P
a
per
|
Dis
cussion
P
a
per
|
Discussion
P
a
per
|
Discussio
n
P
a
per
well as for monitoring. Aerosol products from NASA’s Moderate Imaging Spectrom-eter (MODIS; Salomonson et al., 1989) sensor were utilized in the latest IPCC (4th) assessment of climate (IPCC, 2007), and are being assimilated into chemical trans-port models (e.g. Zhang and Reid, 2006). Satellite aerosol products, including those from MODIS, are also being used for estimating and monitoring ground-level particu-5
late matter (PM) at regional and local scales (e.g., Al-Saadi et al., 2005; van Donkelaar et al., 2010).
There are two MODIS sensors (King et al., 2003), observing Earth from polar orbit aboard NASA’s Terra (since February 2000) and Aqua satellites (since June 2002). MODIS is uniquely suited for characterization of aerosols, combining swath 10
size (∼2330 km), spectral resolution (36 wavelength bands, spanning from 0.415 µm to 14.5 µm) and spatial resolution (1 km, 0.5 km, or 0.25 km, depending on band). Orbit stability and calibration are both rigorously maintained by the MODIS Characterization Support Team (MCST), to within±2–3% at typical situations (Xiong et al., 2005, 2007). To take advantage of MODIS’s sensitivity to aerosol signals, efficient retrieval algo-15
rithms have been developed, maintained, and consistently applied to the entire time series. These algorithms operate by matching observed spectral reflectance (statis-tics of non-cloudy pixels) to lookup tables (LUT) that simulate spectral reflectance for expected aerosol conditions. Each retrieved value represents the aerosol conditions in non-cloudy skies, within some expected error interval. The current suite of MODIS 20
aerosol products are derived separately over three environments: 1) dark-surface (far from sun glint) ocean targets (Remer et al., 2005), 2) dark-surface (vegetation; soils) land targets (Levy et al., 2007b), and 3) bright surface (deserts) land targets (e.g, Hsu et al., 2004).
In this paper, we assess the performance of the aerosol products over dark-land 25
targets (environment 2). These products include totalaerosol optical depth(τor AOD) at 0.55 µm,spectral AOD at 0.47 and 0.65 µm,the aerosol model weighting factor (η
ACPD
10, 14815–14873, 2010Evaluation of Collection 5 MODIS
aerosol over land
R. C. Levy et al.
Title Page
Abstract Introduction
Conclusions References
Tables Figures
◭ ◮
◭ ◮
Back Close
Full Screen / Esc
Printer-friendly Version Interactive Discussion
Discussion
P
a
per
|
Dis
cussion
P
a
per
|
Discussion
P
a
per
|
Discussio
n
P
a
per
|
parameters and retrieval Quality Assurance (QA), comprise the set of Level 2 (L2) aerosol products. These L2 products are retrieved at 10 km resolution globally, and are contained in data product files, which we denote as M*D04 (MOD04 for Terra and MYD04 for Aqua). These M*D04 files are processed and archived by the MODIS Adaptive Processing System (MODAPS) at NASA’s Goddard Space Flight Center, in 5
Hierarchal Data Format (HDF) with parameters stored as Scientific Data Sets (SDS). The most recent dark-target aerosol data are being processed as Collection 5, or C005 for Terra and Collection 51 or C051 for Aqua.
Prior to Terra launch, Kaufman et al. (1997a) estimated theexpected error (EE) for MODIS-retrieved AOD. Since then, many studies (e.g. Chu et al., 2002; Remer et al., 10
2005), have attempted to validate the MODIS products with respect to EE, most re-cently for the dataset known as Collection 4 (C004). The C004 MODIS-derived aerosol products were compared to global sunphotometer data, and shown to compare within EE on a global scale (Remer et al., 2005). However this and other studies (e.g. Levy et al., 2005) demonstrated that there were locations and conditions where the C004 15
errors were systematically larger. These errors were of a magnitude that the C004 products were not accurate enough for use in global model assimilation (e.g. Hyer and Reid, 2009).
Levy et al. (2007a, b) characterized some of the limitations of the C004 algorithm, and introduced the “second-generation” dark target algorithm that was used to process 20
C005. Although there have been studies using C005 dark-target products both glob-ally (e.g. Remer et al., 2008), and regionglob-ally (e.g. Mi et al., 2007), this paper is a more in-depth evaluation. Here, we compare the entire MODIS time series (from both Terra and Aqua) to global AERONET data, thus quantifying global EE, and identifying where and under what conditions the C005 products may still be falling short. In Sect. 2, 25
ACPD
10, 14815–14873, 2010Evaluation of Collection 5 MODIS
aerosol over land
R. C. Levy et al.
Title Page
Abstract Introduction
Conclusions References
Tables Figures
◭ ◮
◭ ◮
Back Close
Full Screen / Esc
Printer-friendly Version Interactive Discussion
Discussion
P
a
per
|
Dis
cussion
P
a
per
|
Discussion
P
a
per
|
Discussio
n
P
a
per
spatial-temporal collocation method that was introduced by Ichoku et al. (2002), and used previously by Remer et al. (2005) and others. In Sect. 5, we summarize our validation results and suggest steps necessary to reduce the remaining systematic discrepancies. Section 6 offers some discussion of the significance of the results and conclusions.
5
2 The MODIS aerosol retrieval over land
The MODIS “dark-target” aerosol retrieval algorithm is optimized for land surfaces that are “dark” in parts of the visible (VIS) and shortwave infrared (SWIR) spectrum. Gen-erally, vegetated and dark soil regions are examples of such dark targets. Although the algorithm’s details have evolved since inception (Kaufman et al., 1997a), the fun-10
damental logic remains the same. Specifically, the algorithm uses two visible (VIS) and one shortwave IR (SWIR) bands (centered about 0.47, 0.65 and 2.1 µm) (Kaufman et al., 1997a; Levy et al., 2007b), which a) are nearly transparent to CO2, H2O and other gaseous absorption, and b) demonstrate a spectral relationship that constrains the reflectance properties of vegetated land surfaces (Kaufman et al., 1997b). Addi-15
tional wavelengths in other parts of the spectrum are used to mask out clouds, deserts, snow, and ice – non dark-target conditions (Ackerman et al., 1998; Martins et al., 2002; Li et al., 2003). Although the nominal resolution of MODIS is 500 m in most wavelength bands, the MODIS aerosol retrieval is performed at 10 km. The 10 km retrieval allows us to improve the signal to noise ratio since we can throw out many pixels (clouds, 20
cloud shadows, snow, surface inhomogeneities) and still have sufficient information for doing the retrieval.
The heart of the algorithm is a lookup table (LUT), containing radiative transfer (RT) simulations of the top-of-atmosphere (TOA) spectral reflectance field for typical aerosol scenarios over land. The algorithm tries to match the LUT to the observed radiation 25
ACPD
10, 14815–14873, 2010Evaluation of Collection 5 MODIS
aerosol over land
R. C. Levy et al.
Title Page
Abstract Introduction
Conclusions References
Tables Figures
◭ ◮
◭ ◮
Back Close
Full Screen / Esc
Printer-friendly Version Interactive Discussion
Discussion
P
a
per
|
Dis
cussion
P
a
per
|
Discussion
P
a
per
|
Discussio
n
P
a
per
|
of the total AOD contributed by fine-sized aerosol. A small fitting error (ε) indicates that the solution from the LUT closely matches the observations. The AOD is the vertical integration of aerosol extinction, a physical property of the aerosol field. ETA is essentially the algorithm’s fitting parameter, providing flexibility for mixing aerosol types to match to observed spectral reflectance. ETA does not represent a physical aerosol 5
quantity.
While the retrieved parameters (AOD, ETA) are the solution to the algorithm, they also depend on assumptions. Knowledge of the assumptions in the LUT, including the shape, size distributions and refractive indices of the aerosol models, leads to calculation of additional parameters. Thesederived parameters include spectral AOD, 10
˚
Angstrom exponent (AE orα), and fine AOD (fAOD orτf). Specifically, the AE is a one-parameter description of the spectral AOD dependence, which can be related to relative aerosol size (e.g. Eck et al., 1999). Larger values of AE (steeper spectral dependence) indicate smaller column-effective particle size, and conversely. The fine-model AOD (fAOD or τf) is the product of AOD and ETA at 0.55 µm. We refer to this quantity as 15
the fine-model AOD because one of the multi-modal models is dominated by the fine mode. (The other, the dust model, is dominated by the coarse mode.) Although there can be correlation between this fine-model AOD and common definitions of fine-mode AOD (like that derived from MODIS over ocean), we emphasize that over land, it is not a physical retrieval of aerosol particle size.
20
Finally, the MODIS algorithm reports a number of diagnostic products, including an estimate of the “quality” of the retrieval. The Quality Assurance (QA) plan (e.g. Hubanks, 2007) is a series of tests that indicates whether certain conditions are met during the course of the retrieval. At the end of the retrieval process, a summary QA Confidence (QAC) flag summarizes the results of all QA tests, and indicates a relative 25
ACPD
10, 14815–14873, 2010Evaluation of Collection 5 MODIS
aerosol over land
R. C. Levy et al.
Title Page
Abstract Introduction
Conclusions References
Tables Figures
◭ ◮
◭ ◮
Back Close
Full Screen / Esc
Printer-friendly Version Interactive Discussion
Discussion
P
a
per
|
Dis
cussion
P
a
per
|
Discussion
P
a
per
|
Discussio
n
P
a
per
2.1 Expected error
Because the MODIS algorithms are designed to infer aerosol properties from the radi-ation field, uncertainties in the retrieval assumptions and retrieval methodology lead to uncertainties in the retrieved products. Prior to Terra launch, Kaufman et al. (1997b) used sensitivity studies to estimate the expected error (EE) of the MODIS-retrieved 5
AOD. Estimated as ±(0.05+0.20τ), the MODIS EE represented the fusion of abso-lute (0.05) and relative (20%) uncertainties that would arise from combined errors in assumed boundary conditions (e.g. surface reflectance, instrument calibration) and er-rors in aerosol model type (such as in single scattering albedo).
After the launch of Terra (and later Aqua), the actual MODIS-derived AOD was re-10
peatedly collocated with, and compared to global sunphotometer data, which is used as ground-truth (e.g. Chu et al., 2002; Remer et al., 2005). Good matches were re-ported wherever the MODIS-retrieved AOD, τMODIS, fell within the envelope defined by
τ− |EE| ≤τMODIS≤τ+|EE|. (1)
15
Validationreferred to the process of quantifying the EE, so that at least 66% (or one standard deviation) of matches would fall within this envelope. Through validation, Chu et al. (2002) suggested that the EE could be reduced to
EE=±(0.05+0.15τ), (2)
which was later confirmed by Remer et al. (2005) for a large dataset (Collection 4; 5906 20
collocations).
However, these and other studies (e.g. Levy et al., 2005; Hyer and Reid, 2009) noted conditions and locations where the errors were larger. For example, Remer et al. (2005) demonstrated that on average, the C004 algorithm tended to overestimate AOD, espe-cially in conditions of low aerosol loading (i.e.,τ<0.1). Other systematic biases were 25
ACPD
10, 14815–14873, 2010Evaluation of Collection 5 MODIS
aerosol over land
R. C. Levy et al.
Title Page
Abstract Introduction
Conclusions References
Tables Figures
◭ ◮
◭ ◮
Back Close
Full Screen / Esc
Printer-friendly Version Interactive Discussion
Discussion
P
a
per
|
Dis
cussion
P
a
per
|
Discussion
P
a
per
|
Discussio
n
P
a
per
|
al. (2005) looked at a specific region of MODIS/sunphotometer disagreement, the US East Coast, and found ways to update both the surface and aerosol optical assump-tions to provide better agreement with sunphotometer observaassump-tions. Levy et al. (2004) also indicated how the neglect of polarization in the radiative transfer simulations could introduce errors.
5
2.2 The C005 algorithm and products
Based on the lessons learned from systematic C004 evaluation, Levy et al. (2007a) created the “second-generation” over-land retrieval algorithm, which was then imple-mented for C005 processing (starting in early 2006). Although in general, the dark-target concept (Kaufman et al., 1997a; Remer et al., 2005) was retained, there were 10
major modifications for C005 (Levy et al., 2007a, b), including:
– The global aerosol is represented by three spherical, fine (sized)-dominated aerosol types, distinguished by their single scattering albedo at 0.55 µm (SSA=0.86, 0.91 and 0.95), as well as a single, spheroidal, coarse (sized)-dominated, dust aerosol type (SSA=0.95). Each aerosol model has two lognor-15
mal modes. Seasonal, gridded maps (1◦×1◦) assign the fine-dominated type to constrain the LUT search.
– Instead of neglecting polarization in the atmospheric simulations (Levy et al., 2004), the LUT was created with vector RT code (Evans and Stephens, 1991). Modified T-matrix code (Dubovik et al., 2006) was used to calculate spheroid, 20
dust type scattering, whereas Mie code (Wiscombe, 1980) was used for the other types.
– Instead of fixed ratios, the VIS/SWIR surface reflectance parameterization in-cludesy-offsets, and varies by SWIR vegetation index and scattering angle.
– Instead of the two-channel VIS retrieval with transparent 2.1 µm assumptions, 25
ACPD
10, 14815–14873, 2010Evaluation of Collection 5 MODIS
aerosol over land
R. C. Levy et al.
Title Page
Abstract Introduction
Conclusions References
Tables Figures
◭ ◮
◭ ◮
Back Close
Full Screen / Esc
Printer-friendly Version Interactive Discussion
Discussion
P
a
per
|
Dis
cussion
P
a
per
|
Discussion
P
a
per
|
Discussio
n
P
a
per
the possibility of non-transparent dust in all channels. The VIS/SWIR surface reflectance relationships are used to constrain the solution.
– Instead of simple reduction of Rayleigh AOD over elevated targets, the phase function dependency of Rayleigh/aerosol interaction is included.
– To reduce statistical biases in low-AOD conditions (AOD<0.05), negative AOD 5
values down to−0.05 are permitted.
– The improved snow/ice mask of Li et al. (2003) is implemented.
Other than implementing the snow mask of Li et al. (2003) into the C005 algorithm, the pixel selection technique remained the same. The 3×3 visible reflectance variability test (e.g. Martins et al., 2002) provides the primary cloud screening, and of the re-10
maining pixels, 20% of the darkest and 50% of the brightest pixels are discarded. The C005 processing also included major changes to theQuality Assurance(QA; Hubanks, 2007) plan. The new QA plan included information characterizing the type, quality and confidence of the input MODIS reflectance data, ancillary datasets (e.g. meteorology or ozone ancillary data; Levy et al., 2009b), as well as some of the intermediate and 15
output products.
2.3 Preliminary validation
Levy et al. (2007a) collected a test-bed (6000 granules) of archived MODIS-C004 ra-diance files, and compared results of the second-generation algorithm with those ob-tained by the previous one. For the test-bed, the overall, mean AOD decreased from 20
∼0.28 (C004-like) to∼0.19 (C005-like). They found that the comparison of total AOD with collocated, global, AERONET (Holben et al., 1998) sunphotometer measurements (>1200 cases) was improved, as demonstrated by the correlation coefficient (R) in-creasing from 0.85 to 0.89, and they-offset decreasing from 0.097 to 0.029. For the test-bed, 67% of the MODIS/AERONET AOD collocations fell within the EE envelope 25
ACPD
10, 14815–14873, 2010Evaluation of Collection 5 MODIS
aerosol over land
R. C. Levy et al.
Title Page
Abstract Introduction
Conclusions References
Tables Figures
◭ ◮
◭ ◮
Back Close
Full Screen / Esc
Printer-friendly Version Interactive Discussion
Discussion
P
a
per
|
Dis
cussion
P
a
per
|
Discussion
P
a
per
|
Discussio
n
P
a
per
|
improvements in the correlation of MODIS/AERONET size parameters, however there was no indication they were globally quantitative.
Although the new aerosol retrieval algorithm passed the preliminary validation tests using the archived C004 radiances, new calibration coefficients were introduced by MCST for C005 processing (http://mcst.gsfc.nasa.gov/uploads/files/c5 luts update/ 5
L1B Aqua LUT History.txt and http://mcst.gsfc.nasa.gov/uploads/files/c5 luts update/ L1B Terra LUT History.txt). This means that the preliminary validation performed by Levy et al. (2007a) may not apply to actual C005 products. In fact, Remer et al. (2008) identified differences between the C004 and C005 datasets over ocean that could be attributed to the calibration changes. Thus, evaluation of actual C005 is necessary. 10
3 Global evaluation of C005 products
The algorithm’sretrievedparameters are solutions to the lookup table matching. These are AOD and ETA (at 0.55 µm), and are reported as SDSs in the M*D04 file as “Cor-rected Optical Depth Land” and “Optical Depth Ratio Small Land”, respectively. The fAOD is simply the product of the solution (AOD×ETA) and is reported as “Opti-15
cal Depth Small Land”. Calculation of additional parameters requires the information embedded in the LUT. For example, based on assignment of aerosol model type, which is in turn associated with assumed aerosol optical properties (e.g., spectral extinction), we compute such parameters as spectral AOD (0.47 and 0.65 µm; “Cor-rected Optical Depth Land” SDS) and the AE (“Angstrom Exponent Land”). Although 20
these are derived parameters, they are essentiallyalgorithm diagnostics (Kahn et al., 2009).
The Quality Assurance (QA) information, including the summary QAC, is true diag-nostic information, reported using the “Quality Assurance Land” SDS. Tables of the QA tests are found in Levy et al. (2009b) and Hubanks (2007). Another source of QA in-25
ACPD
10, 14815–14873, 2010Evaluation of Collection 5 MODIS
aerosol over land
R. C. Levy et al.
Title Page
Abstract Introduction
Conclusions References
Tables Figures
◭ ◮
◭ ◮
Back Close
Full Screen / Esc
Printer-friendly Version Interactive Discussion
Discussion
P
a
per
|
Dis
cussion
P
a
per
|
Discussion
P
a
per
|
Discussio
n
P
a
per
3 processing (e.g., Hubanks et al., 2007). Depending on which tests pass or fail, the algorithm may report fill (i.e., missing) values for all, some, or none of the parameters. For example, if the scene reflectance is brighter than 0.25 at 2.1 µm, only the spectral AOD is reported. All the other parameters are set to fill values and QAC is set to zero. Independent of the QAC, if the retrieved AOD is less than 0.2, the derived fAOD value is 5
reported, but not ETA. If retrieved AOD is reported but negative (i.e., 0>AOD>−0.05), then size apportionment is meaningless, so fAOD, ETA, and AE are all reported as fill values. Thus, there are high confidence (QAC=3) pixels that report AOD, but not size parameters. The QAC is thealgorithmconfidence in the product, yet we expect that data having QAC=3 will be more accurate, and therefore more useful for quantitative 10
applications (e.g. Kahn et al., 2009).
3.1 Collocation with AERONET
Here, we collocate the entire set of C005 Terra/Aqua-MODIS aerosol retrievals with the AERONET Version 2.0, Level 2 Quality Assured (cloud screened and calibrated) direct-sun measurements of spectral AOD (Holben et al., 1998; Smirnov et al., 2000). 15
Although the AERONET AOD uncertainties are on the order of 0.01–0.02 (Eck et al., 1999), we consider them as “ground truth” for satellite product validation. Using quadratic fits on a log-log scale (Eck et al., 1999), we interpolate the AERONET data to MODIS band-effective wavelengths (i.e., 0.47, 0.55 and 0.65 µm bands), and calcu-late the 0.47/0.65 µm ˚Angstrom exponent to match that reported in the MODIS product. 20
Finally, we use the spectral de-convolution technique of O’Neill et al. (2003) to derive AERONET fine mode fraction and fine-mode AOD. Again, note that the AERONET fine-mode fractions and fine-mode AOD are not the same as the MODIS estimates of ETA and fine-dominated AOD, but we can check for respective correlation.
We employ the spatio-temporal technique of Ichoku et al. (2002), which creates a grid 25
cal-ACPD
10, 14815–14873, 2010Evaluation of Collection 5 MODIS
aerosol over land
R. C. Levy et al.
Title Page
Abstract Introduction
Conclusions References
Tables Figures
◭ ◮
◭ ◮
Back Close
Full Screen / Esc
Printer-friendly Version Interactive Discussion
Discussion
P
a
per
|
Dis
cussion
P
a
per
|
Discussion
P
a
per
|
Discussio
n
P
a
per
|
culated and compared to the temporal statistics of the AERONET observations taken within±30 min of MODIS overpass. At least 5 of the possible 25 MODIS retrievals, and 2 of the possible 4 or 5 AERONET observations, are required to include a collocation in our statistics. This means that the collocation might not include the exact 10 km MODIS aerosol retrieval region in which the AERONET station resides, and could in-5
clude retrievals from pixels that are 20–25 km away. For a collocation to be included, both MODIS and AERONET require sampling that is sufficiently free of clouds, based on their respective cloud-masking algorithms. This precludes evaluation of MODIS products in conditions of overcast or some partial cloud situations.
As of September 2008, our database included collocations with 328 AERONET sites, 10
of which 32 were island sites that could not be used for over-land comparison. Of the remainder, 203 sites were inland, and the rest located at or near shoreline. Some sites offer long time series of measurements, whereas others have measurements only dur-ing particular seasons or field experiments. We exclude sites where the elevation of the AERONET instrument and the average of the 50 km×50 km surrounding region 15
differ by >300 m; in these locations AERONET does not represent the surrounding scene. The result is 85 463 matches for the combined Terra/Aqua dataset. For dis-cussion in this paper, we will label sites by the names given by the AERONET team (http://aeronet.gsfc.nasa.gov).
3.2 Global AOD
20
Figure 1 is a frequency scatterplot of the over-land comparison of total AOD at 0.55 µm, for the combined Terra and Aqua datasets. The data are not filtered by QAC. The color of each ordered pair (0.025×0.025 increment) represents the number of such matchups. The dashed, dotted and solid lines are the 1-1 line, defined EE for land AOD (Eq. 2), and the linear regression of the pre-sorted scatterplot, respectively. Table 1 25
ACPD
10, 14815–14873, 2010Evaluation of Collection 5 MODIS
aerosol over land
R. C. Levy et al.
Title Page
Abstract Introduction
Conclusions References
Tables Figures
◭ ◮
◭ ◮
Back Close
Full Screen / Esc
Printer-friendly Version Interactive Discussion
Discussion
P
a
per
|
Dis
cussion
P
a
per
|
Discussion
P
a
per
|
Discussio
n
P
a
per
shows much closer match to the 1-1 line (y=0.95x+0.005 versus y=0.78x+0.068), and a higher correlation (R=0.88 versus R=0.80). Validation is also achieved for the 0.65 and 0.47 channels (also in Table 1).
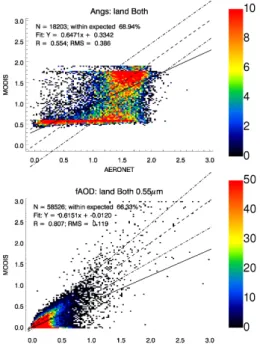
3.3 Global aerosol particle size
Each of the four aerosol types used in the retrieval are bi-lognormal, having both fine 5
and coarse modes (e.g. Levy et al., 2007a). Three of the models are fine-mode dom-inated and the fourth (the dust model) is coarse-mode domdom-inated. This means that the algorithm’s solution is a fine/coarse mixture having four lognormal modes (two fine and two coarse). The weighting of the fine-dominated model (to the total) is the ETA parameter, which is also the non-dust weighting. Unlike the η parameter, which is 10
derived by the aerosol retrieval over ocean (Tanr ´e et al., 1997) or the deconvolution of AERONET-observed AOD (e.g. O’Neill et al., 2003), the MODIS-derived, over-land ETA parameter is NOT “fine-mode weighting” and does not represent aerosol size dis-tribution. ETA is simply a way to fit the MODIS-observed spectral dependence and our preliminary validation exercises (Levy et al., 2007a) did not indicate correlation be-15
tween the MODIS ETA parameter and AERONET retrievedη. Our current study does not indicate significant correlation, either.
Having slightly better correlation compared to AERONET, the preliminary validation (Levy et al., 2007a) suggested that perhaps the ˚Angstrom exponent (AE) calculated from AOD at 0.47 and 0.65 µm or the fine AOD (AOD×ETA) demonstrates some skill. 20
Figure 2 shows the scatterplots of MODIS-derived AE (top) and fine AOD (bottom) against their respective AERONET quantities. Containing one standard deviation of the collocated points, the expected errors (EE) for AE and fAOD are plotted as±0.4 and±(0.05+0.20τ
f), respectively.
Taken together, these size plots indicate that in order to match the TOA spectral 25
ACPD
10, 14815–14873, 2010Evaluation of Collection 5 MODIS
aerosol over land
R. C. Levy et al.
Title Page
Abstract Introduction
Conclusions References
Tables Figures
◭ ◮
◭ ◮
Back Close
Full Screen / Esc
Printer-friendly Version Interactive Discussion
Discussion
P
a
per
|
Dis
cussion
P
a
per
|
Discussion
P
a
per
|
Discussio
n
P
a
per
|
retrieved AE is forced along the lower edge of the dynamic range, sometimes even in situations that are known to be smoke or pollution. This clearly indicates that the retrieved AE should not be confused with reality.
In general, except for cases where MODIS wrongly favors the dust model (appearing as the red arm along thex-axis), there is better correlation of MODIS-derived fAOD 5
(AOD×ETA) with that derived by AERONET. Thus, it appears that fAOD offers greater sensitivity to particle size. However, this apparent correlation is driven by the strong de-pendence on total AOD (Fig. 1), which is generally well retrieved by MODIS. However, because ETA is such a weak parameter, fAOD does not provide any new informa-tion on particle size. There is no physical informainforma-tion contained in the C005 aerosol 10
size parameters, whether retrieved as a solution to the inversion (e.g. ETA) or derived downstream (fAOD or AE).
In future collections of MODIS data, we suggest that derived (or assumed) param-eters such as fAOD and AE should be removed. ETA must be retained because it provides vital information for evaluating the performance of the algorithm. Due to their 15
lack of quantitative usefulness, there will be no additional discussion of the aerosol size parameters in this paper.
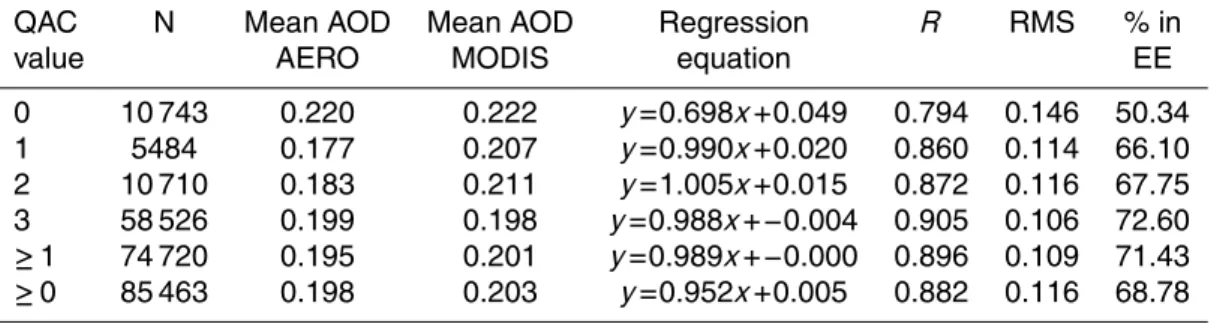
3.4 QAC filtering
As mentioned previously, each set of retrieved products is accompanied by an estimate of the QAC. Table 2 presents the information contained in the 0.55 µm row of Table 1, 20
but separated by QAC value. We see that the quality of the MODIS/AERONET compar-ison is strongly dependent on QAC. For the retrievals with QAC=0, there is significant deviation from the 1-1 line. Although the global averages of both datasets are simi-lar, MODIS retrieves only 50.34% of the cases to within EE for QAC=0. However, as we increase our QAC value, the regression become more symmetric to the 1-1 line 25
ACPD
10, 14815–14873, 2010Evaluation of Collection 5 MODIS
aerosol over land
R. C. Levy et al.
Title Page
Abstract Introduction
Conclusions References
Tables Figures
◭ ◮
◭ ◮
Back Close
Full Screen / Esc
Printer-friendly Version Interactive Discussion
Discussion
P
a
per
|
Dis
cussion
P
a
per
|
Discussion
P
a
per
|
Discussio
n
P
a
per
points. Note that a user may choose to use data with lower QAC, but is strongly advised not to use retrievals with QAC=0 for any quantitative purpose. The choice depends on the application’s tolerance for uncertainty versus the need for spatial coverage.
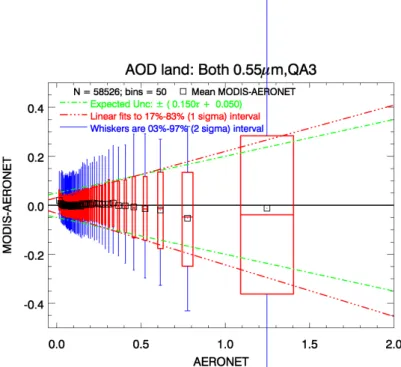
3.5 AOD filtering
For C004 validation, Remer et al. (2005) found that>66% or 1-standard deviation of 5
the 5906 over-land collocation points were contained within the EE envelope. However, the standard deviations were not smaller than EE for all values of AOD, indicating that the stated EE (Eq. 2) was not entirely correct.
Here, Fig. 3 presents the 58 586 QAC=3 cases of C005, binned by AERONET AOD. On the x-axis, there are 50 equal sized bins (∼1200 observations per bin). How-10
ever, instead of the MODIS AOD, they-axis is the absolute difference between MODIS and AERONET AOD (MODIS-AERONET). The statistics are presented as box-whisker plots, where the horizontal centers and half-widths of the red boxes represent the means and the standard deviations of the AERONET AOD in each bin. In the verti-cal, the centers and the tops/bottoms represent the medians and the middle 66% (1σ) 15
intervals of the MODIS-AERONET differences for each bin. The black squares are the mean of the MODIS-AERONET differences (usually close to the median). The red dashed-dot lines are linear best fits to the bottoms and tops of the boxes, which can be compared with the green dashed lines encompassing the EE envelope. Finally, the blue whiskers represent the 96% (2σ) intervals of the MODIS-AERONET differences. 20
From Fig. 3, we see across the entire AOD range that: a) the mean bias of the MODIS retrieval is near zero, and b) the 66% interval and the green EE envelope are nearly identical. This means that the EE is a reasonable assessment of C005’s AOD error across the entire range of AOD, indicating a more robust validation of the product. We note that the 2-σ bars represent AOD error approximately double of the 1σ (and 25
ACPD
10, 14815–14873, 2010Evaluation of Collection 5 MODIS
aerosol over land
R. C. Levy et al.
Title Page
Abstract Introduction
Conclusions References
Tables Figures
◭ ◮
◭ ◮
Back Close
Full Screen / Esc
Printer-friendly Version Interactive Discussion
Discussion
P
a
per
|
Dis
cussion
P
a
per
|
Discussion
P
a
per
|
Discussio
n
P
a
per
|
4 Local C005 validation
Although we have robustly validated theglobal C005 AOD within EE, we know from the literature (e.g. Jethva et al., 2008; Kahn et al., 2009) that there areregionswhere MODIS has systematic problems retrieving AOD. MODIS may systematically overesti-mate or underestioveresti-mate AOD for one reason or another, and the errors might be off set-5
ting (Kahn et al., 2007). In this section, we examine the performance of the MODIS algorithm for retrieving AOD at individual AERONET sites. By separating into cases with light aerosol loadings (τ<0.15) and heavy aerosol loadings (τ>0.4), we can sug-gest whether systematic errors result from poor surface assumptions or poor aerosol model assumptions.
10
4.1 Site by site: overall
Our dataset includes collocations from different sites and different seasons. These sites represent a variety of surface types (forests, savanna, urban, soils, etc), and a variety of expected aerosol types. Although we have demonstrated that on average, the retrieval algorithm has made the correct assumptions as to surface and aerosol 15
characteristics, we know that there are sites where MODIS shows systematic errors. Let us consider thefractionof the MODIS-retrieved AOD values that fall within EE at each site during a given season, as well as the sign of the mean bias. Where we see at least 2/3 (66% or 1-σ), we consider this to have “good” matching. If fewer than half lie within EE, this is a “poor” match, and we determine whether MODIS tends to retrieve 20
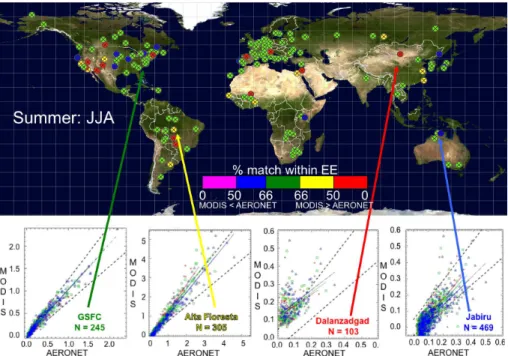
too low or too high. Figure 4 provides visual assessment of both matching quality and MODIS bias, during the summer months (June, July, and August). Symbols are plotted at AERONET sites having at least ten collocations for the season, and are color-coded based on the fraction of MODIS data that matches within EE. Green symbols are plotted where≥66% match (“good”) within EE (e.g. GSFC). Red represents sites 25
ACPD
10, 14815–14873, 2010Evaluation of Collection 5 MODIS
aerosol over land
R. C. Levy et al.
Title Page
Abstract Introduction
Conclusions References
Tables Figures
◭ ◮
◭ ◮
Back Close
Full Screen / Esc
Printer-friendly Version Interactive Discussion
Discussion
P
a
per
|
Dis
cussion
P
a
per
|
Discussion
P
a
per
|
Discussio
n
P
a
per
match and a MODIS low bias. Alta Floresta is marked by yellow because the fraction is between 50% and 66%, with a high bias. Jabiru is marked blue to refer to similar fraction, but a low MODIS bias. Scatterplots for four example sites (GSFC (38◦N, 76◦W), Alta Floresta (9◦S, 56◦W), Dalanzadgad (43◦N, 104◦E), and Jabiru (12◦S, 132◦E)) are displayed at the bottom, indicating why the site received a certain color 5
symbol.
For the summer months, much of the US East Coast shows very good agreement at 0.55 µm. An exception is New York City (the CCNY and GISS sites, both near (40◦N, 73◦W)), where the urban surface is poorly represented by MODIS’s surface re-flectance parameterization (Oo et al., 2010). Most sites in Western Europe also com-10
pare well, except for Venise (45◦N, 12◦E), which is actually an oceanographic platform, 15 km into the Adriatic Sea. Essentially, since the MODIS C005 algorithm was devel-oped based on MODIS/AERONET collocations and AERONET sky retrievals available through 2005 (Levy et al., 2007a, b), the US East Coast and Western Europe domi-nated the database. Except for the urban and offshore sites, the surface is generally at 15
least partially vegetated, and the aerosol is characterized by fine particles and a high single scattering albedo. Thus, it is not surprising that the products generally compare well in these regions.
Good comparisons are seen over southern Africa (e.g., Mongu (15◦S, 23◦E)) and parts of the Amazon for this season, which are both dark surface regions and were 20
well sampled by AERONET prior to C005. Even though Japan and Korea were not well sampled prior to C005 development, and the aerosol tends to be more absorbing than that over the Eastern US and Western Europe, good agreement is seen there be-cause the surfaces are not too different. Good agreement is also seen at the Chinese sites of Taihu (31◦N, 120◦E) and Xianghe (39◦N, 116◦E) (Mi et al., 2007). Interest-25
ingly, while the region surrounding Kanpur, India (26◦N, 80◦E) is relatively bright, the sunphotometer site is located in a small pocket of vegetation. For the summer season, the agreement is good (e.g. Jethva et al., 2007).
ACPD
10, 14815–14873, 2010Evaluation of Collection 5 MODIS
aerosol over land
R. C. Levy et al.
Title Page
Abstract Introduction
Conclusions References
Tables Figures
◭ ◮
◭ ◮
Back Close
Full Screen / Esc
Printer-friendly Version Interactive Discussion
Discussion
P
a
per
|
Dis
cussion
P
a
per
|
Discussion
P
a
per
|
Discussio
n
P
a
per
|
brighter and elevated targets. For example, Palencia, Spain, is on a plateau, has a relatively brighter surface where the aerosol signal is comparatively weak for a dark-target retrieval. Poor comparisons are also noted at sites over the western US, (e.g. BSRN-Boulder (40◦N, 105◦W) and Sevilleta (34◦N, 106◦W)), the Patagonian region of Argentina (e.g., Trelew (43◦S, 65◦W)), and the steppe and near desert plateaus of 5
Russia and China (e.g., Irkutsk (51◦N, 103◦E) and Dalanzadgad). While these scenes do not exceed the brightness criteria test for dark target scenes (2.1 µm reflectance greater than 0.25), they may be too bright for optimal use of the dark target algorithm. In addition, these regions may be dominated by aerosol types that would not have been characterized by the clustering of AERONET data available in 2005 and assumed for 10
the dark-target algorithm. These regions may be better suited for retrieval with the Deep Blue algorithm (Hsu et al., 2004), but testing this hypothesis is beyond the scope of this paper.
Although most of the darker-target sites compare to within global EE as expected, we find sites that compare less well. For examples, Alta Floresta and Cuiaba (15◦S, 15
56◦W) are both in Brazil, one near the border of the Amazon forest, the other located further south in the cerrado (savanna-like vegetation). These two sites have been col-lecting data for a long time, and were used when developing C005. Yet, for both sites, AOD tends to be overestimated in heavy aerosol conditions, and underestimated (con-sistently negative) in light loading conditions. These differing biases result from poor 20
assumptions in both the aerosol model and the surface reflectance. During the devel-opment of the C005 aerosol models, Levy et al. (2007b) found that the aerosol type in the region sometimes had lower single scattering albedo (SSA∼0.86 at 0.55 µm), and sometimes higher (SSA∼0.91), and had a tendency to have lower SSA towards the southeast. A box was drawn on a map to signify where the stronger absorbing type 25
ACPD
10, 14815–14873, 2010Evaluation of Collection 5 MODIS
aerosol over land
R. C. Levy et al.
Title Page
Abstract Introduction
Conclusions References
Tables Figures
◭ ◮
◭ ◮
Back Close
Full Screen / Esc
Printer-friendly Version Interactive Discussion
Discussion
P
a
per
|
Dis
cussion
P
a
per
|
Discussion
P
a
per
|
Discussio
n
P
a
per
is normally closer to 0.9 than to 0.86 during the dry season. At Alta Floresta (farther west), where the C005 moderately absorbing aerosol type (SSA∼0.91) is assigned, the true SSA is closer to 0.92–0.93 (Schafer et al., 2008). Therefore, both sites would experience similar systematic bias. A correction to the aerosol model assignments in Brazil is required, in some ways opposite to the correction that was implemented over 5
Southern Africa (Ichoku et al., 2003) for C004.
As for the consistent retrieval of negative AOD in light loading conditions, these two Brazilian sites may suffer from similar problems as noted at Jabiru (northern Australia). This systematic bias for low AOD results from overestimating the surface reflectance in the visible channels. Since the C005 algorithm was optimized for the set of global 10
collocations that favored sites in the Eastern US and Western Europe, the surface reflectance parameterization was biased toward these sites and their NDVI character-istics. The vegetation in the Amazon rainforest has smaller visible/SWIR ratios than the presumed global average. In addition, parts of the Amazon (as well as Australia) are known to have red soils, which may not display the same surface reflectance rela-15
tionships as modeled with the C005 parameterization.
4.2 Separating surface assumption and aerosol assumption errors
At Cuiaba and Alta Floresta, the MODIS-derived AOD are overall within EE, but that general assessment hides offsetting biases related to surface and aerosol assump-tions. To evaluate these issues we separate the MODIS/AERONET comparisons into 20
three groups, based on the AOD (at 0.55 µm) observed by AERONET. Collocations where τ<0.15 are “light” aerosol loading conditions, for which MODIS errors would be strongly related to errors in surface reflectance assumptions. Cases whereτ>0.4 are “heavy” aerosol loadings, which we use to evaluate the reliability of the aerosol model assumptions. The cases of 0.15≤τ≤0.4 likely are influenced by both surface 25
ACPD
10, 14815–14873, 2010Evaluation of Collection 5 MODIS
aerosol over land
R. C. Levy et al.
Title Page
Abstract Introduction
Conclusions References
Tables Figures
◭ ◮
◭ ◮
Back Close
Full Screen / Esc
Printer-friendly Version Interactive Discussion
Discussion
P
a
per
|
Dis
cussion
P
a
per
|
Discussion
P
a
per
|
Discussio
n
P
a
per
|
Here we can compute anerror ratio(ER),
ER=(τ
MODIS−τ)/EE, (3)
which compares the actual error to the expected error (e.g. Mi et al., 2007). Where −1≤ER≤1, the actual error is smaller than EE, indicating a “good” match. Where |ER|>1, it is a “poor” match. MODIS underestimation and overestimation are repre-5
sented by ER<0 and ER>0, respectively.
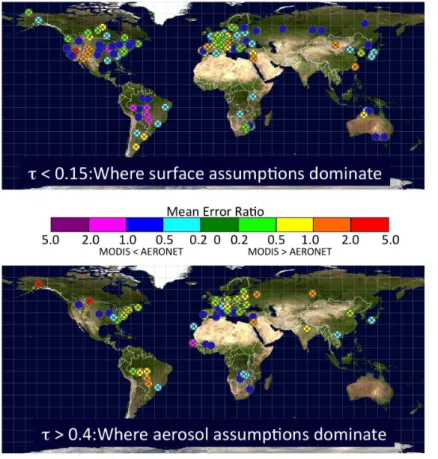
For each group (light and heavy loadings) separately, we calculate themean ER of the MODIS/AERONET matches (minimum of ten) at each site and season, and use these values to characterize the relative quality of the MODIS product. Figure 5 is a color-coded map of the mean ER at each site during summer months, for the light 10
(τ<0.15; top panel) and heavy (τ>0.4; bottom panel) aerosol cases. The greenish col-ors (cyan and lime) are sites where |ER|≤1, meaning that the systematic bias is less than the EE for the particular AOD group. Cooler colors indicate ER<0 (MODIS under-estimation) whereas warmer colors represent ER>0 (overestimation), and those colors farther from green (e.g., purple, red) represent increasingly severe average bias. Un-15
like single collocation estimates of ER, sites where average|ER|>0 indicate systematic bias to the MODIS retrieval.
Separation by aerosol regime helps to provide confirmation of our hypotheses in the previous section. For example, in the Amazon, MODIS clearly underestimates AOD in light loading conditions, and overestimates in more polluted conditions, indicating both 20
that the surface is darker (in the visible) than the VIS/SWIR relationship suggests, and that the particles are brighter than that assumed for the region. In urban or oceanic platform areas (e.g. CCNY or Venise) and brighter elevated surfaces (e.g. US South-west) the MODIS overestimations are generally confined to the low AOD conditions, indicating that the surface assumptions are the dominant source of errors. For the 25
ACPD
10, 14815–14873, 2010Evaluation of Collection 5 MODIS
aerosol over land
R. C. Levy et al.
Title Page
Abstract Introduction
Conclusions References
Tables Figures
◭ ◮
◭ ◮
Back Close
Full Screen / Esc
Printer-friendly Version Interactive Discussion
Discussion
P
a
per
|
Dis
cussion
P
a
per
|
Discussion
P
a
per
|
Discussio
n
P
a
per
We find it interesting that the AOD at Bonanza Creek (64◦N, 148◦W) is severely overestimated in polluted conditions, which suggests that our assumed aerosol model (SSA∼0.91) is too absorbing to represent the dense smoke (SSA∼0.97) observed at the site (Eck et al., 2009), possibly due in part to significant burning of peat fuels in the region.
5
In general, except for sites such as Kanpur or Mongu, that experience widely variable seasonal vegetation states, the characteristics of the MODIS retrieval quality do not vary much from season to season, so the summer month map provides the general global picture. Note that only a few sites meet the minimum ten collocations in heavy loading conditions.
10
5 Systematic errors
From Sect. 4 and the literature, we know that significant retrieval biases are tied to particular locations. Many authors have found ways to improve MODIS retrievals at particular sites (e.g. Mi et al., 2007; Oo et al., 2009; Jethva et al., 2008), but we have not implemented them into the global algorithm. Others have used data assimilation 15
to systematically “correct” the MODIS data in poorly performing areas, but may not al-ways get to the root cause of the problem in the first place. Here we determine whether there are residual errors due to such conditions, including cloud fraction, assumed sur-face type characteristics, or geometry. Of course, there can be multiple reasons for poorer than average retrieval in a particular scene. For example, coarse-dominated 20
dust aerosol type will be more common over more arid, brighter surfaces. Both char-acteristics would hinder the accuracy of the retrieved AOD.
5.1 Angstrom exponent˚
ACPD
10, 14815–14873, 2010Evaluation of Collection 5 MODIS
aerosol over land
R. C. Levy et al.
Title Page
Abstract Introduction
Conclusions References
Tables Figures
◭ ◮
◭ ◮
Back Close
Full Screen / Esc
Printer-friendly Version Interactive Discussion
Discussion
P
a
per
|
Dis
cussion
P
a
per
|
Discussion
P
a
per
|
Discussio
n
P
a
per
|
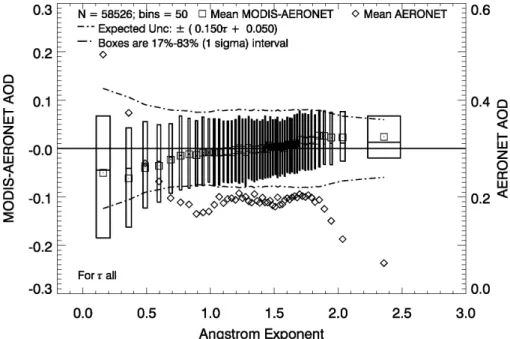
cation. What are the conditions that are related to the quality of the comparison? Figure 6 plots the differences between MODIS and AERONET as a function of the
˚
Angstrom exponent, AE, defined by AERONET AOD interpolated to the MODIS wave-lengths of 0.47 µm and 0.65 µm, as described in Sect. 3.3. Data are sorted by AE and grouped into 50 equally populated bins. Each box represents the statistics of the 5
MODIS-AERONET differences in the bin. The means and standard deviations of the AE (for each bin) are the centers and half widths in the horizontal. The mean, medians, and 66% (1−σ) interval of the MODIS-AERONET differences are the squares, the cen-ter, and top-bottom intervals in the vertical. The dashed curves represent the over-land EE envelope for total AOD (±(0.05+0.15τ); Eq. 2), where EE is calculated based on 10
the mean AERONET AOD within the bin (diamonds; right axis). From this plot, one can assess the average absolute error (and sign), the relative error, as well as the av-erage error in comparison to EE that varies with AE. One also can see whether 66% of the collocations fall within EE for a given bin. Note that the EE envelope is larger for coarse-dominated cases, indicating that our sample of coarse-dominated aerosol 15
cases (presumably dust) has larger AOD than our sample of fine-dominated cases. Figure 6 shows that for the MODIS/AERONET collocations with QAC=3, MODIS-retrieved AOD is generally accurate where AE is within the algorithm’s assumed AE parameter space (0.8<α<1.6). Within this AE interval, there is very little variability of AERONET AOD, such that each bin’s average AOD is approximately 0.2, with EE of 20
±0.08. The absolute and relative errors, as well as the ER are all close to zero. For the bins with AE>1.6 (fine-dominated), AERONET observed-AOD is lower, so that the corresponding EE has a smaller envelope. Yet MODIS tends to overestimate by∼0.02 (relative error of 20–30%), which in EE-space is ER∼0.3–0.4. For coarse-dominated aerosol (α<0.6) scenes, where the AERONET AOD is generally larger, MODIS tends 25
to underestimate AOD by 0.03–0.04. While this is a somewhat smaller relative error of 15–20%, in EE-space, the average ER is similar in magnitude.
ACPD
10, 14815–14873, 2010Evaluation of Collection 5 MODIS
aerosol over land
R. C. Levy et al.
Title Page
Abstract Introduction
Conclusions References
Tables Figures
◭ ◮
◭ ◮
Back Close
Full Screen / Esc
Printer-friendly Version Interactive Discussion
Discussion
P
a
per
|
Dis
cussion
P
a
per
|
Discussion
P
a
per
|
Discussio
n
P
a
per
cases of light aerosol loading (τ<0.15) in the top panel, and the 6621 cases of heavy loading (τ>0.4) in the bottom panel. The remaining cases, having moderate aerosol loadings, are not plotted. For low aerosol loading, the MODIS retrieval of AOD has neg-ligible bias on average, and>66% are within EE, regardless of the scene’s AE. There is a small, but systematic MODIS overestimation (∼0.01) for the highest AE cases 5
(α>2.0). On the other hand, MODIS retrieval of high AOD (τ>0.4) can have significant errors, especially for the lowest AE cases (α<0.8). For these coarse-dominated condi-tions, MODIS underestimates AOD by 0.2 or 20%, leading to poor retrievals compared to EE (ER∼1.0). MODIS underestimation is largest in heavy, dusty conditions. In heavy fine-dominated situations the tendency is towards an overestimation of∼0.05 or 6%. 10
5.2 Cloud fraction
Although the MODIS cloud-clearing algorithm aims to remove clouds from the scene, many studies have reported a positive correlation between AOD retrieval error and cloud fraction, suggesting residual cloud contamination in the MODIS aerosol retrieval (Kaufman et al., 2005; Marshak et al., 2006; Zhang et al., 2005). The MODIS-aerosol-15
product cloud fraction is calculated from the 500 m resolution pixels (Levy et al., 2009) that were removed during the cloud masking of the aerosol algorithm (Martins et al., 2002). Figure 8 plots the MODIS-AERONET differences as a function of MODIS-aerosol-product cloud fraction over land. The great majority of cases have low cloud fraction (<5%) and there is no significant bias, such that validation (within global EE) 20
is achieved for scenes with cloud fraction less than 5%. Yet, Fig. 8 also shows that MODIS overestimates AOD when cloud fraction is higher, and the error increases with increasing cloud fraction. As cloud fraction goes above 20%, the mean MODIS error approaches 0.03–0.04 or 15–20% in relative AOD units. Average ER∼0.3–0.4. For the larger cloud fractions (>13%), fewer than 66% are within EE.
25
ACPD
10, 14815–14873, 2010Evaluation of Collection 5 MODIS
aerosol over land
R. C. Levy et al.
Title Page
Abstract Introduction
Conclusions References
Tables Figures
◭ ◮
◭ ◮
Back Close
Full Screen / Esc
Printer-friendly Version Interactive Discussion
Discussion
P
a
per
|
Dis
cussion
P
a
per
|
Discussion
P
a
per
|
Discussio
n
P
a
per
|
fractions than seen in this data set. Thus, the biases seen in Fig. 8 for cloud fraction above 20% will have a greater effect on aerosol statistics calculated from the MODIS retrieval than is apparent from the figure, though “ground-truth” data to assess this situation statistically is lacking.
There are many reasons for AOD dependence on cloud fraction, as well as 5
many possible factors that could increase retrieval error with cloud fraction, such as cloud contamination in the retrieved product. The differences between MODIS and AERONET, however, might not be due entirely to MODIS cloud screening blunders. In fact, they can arise from different strategies for sampling. The AERONET sun mode’s cloud screening algorithm tests temporal variability (e.g., Smirnov et al., 2002), 10
whereas MODIS’s cloud screening algorithm operates on spatial variability. It is easy to visualize a scenario where the sunphotometer’s view of the sun is unobstructed, yet there are clouds along the horizon. The AERONET view will be biased towards the clear sky, whereas the MODIS view will include some pixels that are sampled within cloud fields. We know that non-cloudy holes within cloud fields are physically diff er-15
ent from the non-cloudy atmosphere far from clouds (Charlson et al., 2007; Koren et al., 2007, 2009). Higher humidity in cloud fields contribute to aerosol swelling close to the clouds (e.g. Twohy et al., 2009), and stray light from 3-D effects (e.g. Wen et al., 2007), remnants of decaying clouds and other cloud-related issues (e.g. Koren et al., 2009) all contribute to increasing the AOD retrieved in the cloud field. Note that 20
some factors that enhance satellite-retrieved AOD in cloud fields should be included in the result (swelling) whereas others represent AOD-retrieval artifacts (3-D effects), but all are physical phenomena that cannot be avoided by cloud masking, unless aerosol retrievals are excluded over the entire cloud field. The paradigm that MODIS does not avoid cloud fields as strictly as AERONET, contributes to the MODIS-AERONET 25
differences in Fig. 8.
con-ACPD
10, 14815–14873, 2010Evaluation of Collection 5 MODIS
aerosol over land
R. C. Levy et al.
Title Page
Abstract Introduction
Conclusions References
Tables Figures
◭ ◮
◭ ◮
Back Close
Full Screen / Esc
Printer-friendly Version Interactive Discussion
Discussion
P
a
per
|
Dis
cussion
P
a
per
|
Discussion
P
a
per
|
Discussio
n
P
a
per
tinues even to lower cloud fraction cases (>2%). For the heavy loading cases on the other hand, the differences between MODIS and AERONET are nearly independent of cloud fraction. This suggests that enhanced AOD associated with cloud fields sat-urates for higher aerosol loading situations, or that heavy aerosol is not significantly increased in cloud fields. We must remember that although the MODIS validation is 5
constrained by AERONET data and its cloud screening, MODIS may be retrieving in different conditions than AERONET is observing.
5.3 Scene and surface reflectance properties
The MODIS second-generation algorithm makes two major assumptions about the sur-face optical characteristics. The full inversion expects the scene to be “dark” (observed 10
reflectance at 2.1 µm must be less than 0.25), and that there are constraints on surface spectral reflectance properties. Specifically, it is assumed that there is a relationship between the visible (VIS: 0.47, 0.65 µm) and shortwave-infrared (SWIR: 2.1 µm) sur-face reflectance, that also depends on scattering angle and sursur-face “greenness” (Levy et al., 2007b). The surface greenness, parameterized by the NDVI swir (Karneili et al., 15
2002), is similar to the standard Normalized Difference Vegetation Index (Tucker et al., 1979), but based on two SWIR channels (1.6 and 2.1 µm). Except for extremely dusty cases, the use of the SWIR channels was expected to help minimize aerosol contam-ination. When developing the C005 algorithm, Levy et al. (2007b) relied on a MODIS granule test-bed, which resulted in a decision to optimize the retrieval to cases with 20
scene reflectance between 0.01 and 0.25, and the NDVI swir dependency to between 0.25 and 0.6. While not explicitly noted previously, this test-bed was dominated by data from the US East Coast and Western Europe, where the observed 2.1 µm reflectance is∼0.10, and the NDVI swir is∼0.4. Although there were scenes that demonstrated a larger range of surface conditions in the testbed, their influence on the global surface 25
parameterization was small.
ACPD
10, 14815–14873, 2010Evaluation of Collection 5 MODIS
aerosol over land
R. C. Levy et al.
Title Page
Abstract Introduction
Conclusions References
Tables Figures
◭ ◮
◭ ◮
Back Close
Full Screen / Esc
Printer-friendly Version Interactive Discussion
Discussion
P
a
per
|
Dis
cussion
P
a
per
|
Discussion
P
a
per
|
Discussio
n
P
a
per
|
impact of scene and surface assumptions by concentrating on these cases. Figure 9 plots MODIS-AERONET differences in light loading conditions (τ<0.15), as a function of MODIS-observed scene brightness (reflectance in 2.1 µm; top) and scene green-ness (NDVI swir; bottom). Differences between MODIS and AERONET are smallest in the mid-range, when the scene reflectance is 0.12, and/or the NDVI swir is 0.4. MODIS 5
is biased high (by 0.02 or 20%) when the scene reflectance is>0.17 and biased low by similar amount when the scene reflectance is<0.07. The scene’s NDVI swir demon-strates a larger influence on the MODIS bias, such that errors are>0.03 (30%) when NDVI swir<0.2 and<−0.03 (30%) when NDVI swir>0.6.
However, even though there are systematic biases, there are only a few conditions 10
for which<66% of the MODIS/AERONET collocations match within EE. These occur when scene reflectance is >0.20 and/or NDVI swir <0.2, which represents less than 10% of the global dataset. In other words, MODIS tends to overestimate over surfaces that are brighter and less green than optimal, and to underestimate when they are darker and greener. However, for the most part, over the middle of the range optimal for 15
MODIS retrieval, there is very little systematic bias. In order to make MODIS retrieval more accurate over the entire range of surfaces, the assumptions of surface reflectance relationships, surface darkness and surface greenness will need to be reevaluated for future MODIS retrievals. From Fig. 9, it appears that a simple linear factor could correct most of the observed bias.
20
5.4 Observation geometry
An ideal aerosol algorithm would retrieve AOD of equal quality, independent of solar and observing geometry. However, factors other than algorithm performance can also cause covariance between MODIS AOD retrieval error and observing geometry. For example, many heavy aerosol events (dust, smoke, pollution) occur in mid-latitude and 25
tropical regions during summer. These events tend to coincide with specific scattering geometry. The solar zenith angle (θ0) is small in these circumstances, and scattering
ACPD
10, 14815–14873, 2010Evaluation of Collection 5 MODIS
aerosol over land
R. C. Levy et al.
Title Page
Abstract Introduction
Conclusions References
Tables Figures
◭ ◮
◭ ◮
Back Close
Full Screen / Esc
Printer-friendly Version Interactive Discussion
Discussion
P
a
per
|
Dis
cussion
P
a
per
|
Discussion
P
a
per
|
Discussio
n
P
a
per
solar/sensor azimuthφangles: Θ =cos−1(−cosθ
0cosθ+sinθ0sinθcosφ), (4)
These factors create natural correlations between observed AOD and scattering angle. Because absolute AOD error increases with AOD (e.g., Fig. 3), correlations between absolute AOD error and scattering angle also occur. However, the relative or fractional 5
error is much less dependent on AOD, so this metric should be relatively independent of geometry.
Figure 10 presents the statistics of the MODIS-AERONET differences as a function of sensor view zenith angle. Angles are negative or positive, depending on whether they are to the “left” or “right” of nadir along the path of the orbit. For example, the left 10
side of the orbit corresponds to the eastern side for Terra (descending across equator), and the western side for Aqua (ascending). The sun is on the western side for Terra and eastern side for Aqua, so there is symmetry to glint and hotspot patterns.
We see from Fig. 10 that although in general,>66% of MODIS-AERONET colloca-tions are within EE, MODIS tends to overestimate AOD by∼0.01 (5% relative error) on 15
the sun-glint (left) side and to underestimate by similar magnitude on the sun-shadow (right) side of the swath. If split into light (τ<0.15) and heavy (τ>0.4) aerosol loadings, we would see that a) the view angle dependence is limited to low AOD conditions, and that b) the errors are independent of angle in heavy aerosol conditions. Yet, 66% of the collocations fall within the EE envelope, indicating that the EE an accurate assessment, 20
regardless of view zenith angle.
Scattering angle dependence is more difficult to decipher, and is presented for the global aggregate in Fig. 11. Again, the average absolute errors of MODIS are small (<0.01) across the entire range of scattering angle, and for the most part,>66% of col-locations in every bin match within EE. However,observed AERONET AOD increases 25