Transcriptomic-Wide Discovery of Direct and
Indirect HuR RNA Targets in Activated CD4
+
T Cells
Patsharaporn Techasintana
1,2, J. Wade Davis
3, Matthew M. Gubin
4, Joseph D. Magee
5,
Ulus Atasoy
1,2*
1Department of Surgery, University of Missouri, Columbia, Missouri, United States of America,
2Department of Molecular Microbiology and Immunology, University of Missouri, Columbia, Missouri, United States of America,3Department of Biostatistics, University of Missouri, Columbia, Missouri, United States of America,4Department of Pathology and Immunology, Washington University School of Medicine, St. Louis, Missouri, United States of America,5Dalton Cardiovascular Research Center, University of Missouri, Columbia, Missouri, United States of America
Abstract
Due to poor correlation between steady state mRNA levels and protein product, purely
tran-scriptomic profiling methods may miss genes posttranscriptionally regulated by RNA
bind-ing proteins (RBPs) and microRNAs (miRNAs). RNA immunoprecipitation (RIP) methods
developed to identify in vivo targets of RBPs have greatly elucidated those mRNAs which
may be regulated via transcript stability and translation. The RBP HuR (ELAVL1) and family
members are major stabilizers of mRNA. Many labs have identified HuR mRNA targets;
however, many of these analyses have been performed in cell lines and oftentimes are not
independent biological replicates. Little is known about how HuR target mRNAs behave in
conditional knock-out models. In the present work, we performed HuR RIP-Seq and
RNA-Seq to investigate HuR direct and indirect targets using a novel conditional knock-out model
of HuR genetic ablation during CD4+ T activation and Th2 differentiation. Using
indepen-dent biological replicates, we generated a high coverage RIP-Seq data set (
>
160 million
reads) that was analyzed using bioinformatics methods specifically designed to find direct
mRNA targets in RIP-Seq data. Simultaneously, another set of independent biological
repli-cates were sequenced by RNA-Seq (
>
425 million reads) to identify indirect HuR targets.
These direct and indirect targets were combined to determine canonical pathways in CD4+
T cell activation and differentiation for which HuR plays an important role. We show that
HuR may regulate genes in multiple canonical pathways involved in T cell activation
espe-cially the CD28 family signaling pathway. These data provide insights into potential
HuR-regulated genes during T cell activation and immune mechanisms.
OPEN ACCESS
Citation:Techasintana P, Davis JW, Gubin MM, Magee JD, Atasoy U (2015) Transcriptomic-Wide Discovery of Direct and Indirect HuR RNA Targets in Activated CD4+T Cells. PLoS ONE 10(7): e0129321.
doi:10.1371/journal.pone.0129321
Editor:André Paul Gerber, University of Surrey, UNITED KINGDOM
Received:September 22, 2014
Accepted:May 7, 2015
Published:July 10, 2015
Copyright:This is an open access article, free of all copyright, and may be freely reproduced, distributed, transmitted, modified, built upon, or otherwise used by anyone for any lawful purpose. The work is made available under theCreative Commons CC0public domain dedication.
Data Availability Statement:All relevant data are within the paper and its Supporting Information files.
Funding:This work is funded by grant R21AI079341 National Institutes of Health (www.nih.gov)to UA; R01AI080870 National Institutes of Health (www.nih. gov)to UA; NIH grant 2R01AI080870-05A1. The funders had no role in study design, data collection and analysis, decision to publish, or preparation of the manuscript.
Introduction
Due to poor correlation between steady state mRNA levels and protein products, traditional
genome profiling techniques may be limiting. Eukaryotic mRNAs are regulated
posttranscrip-tionally by RNA-binding proteins (RBPs) and microRNAs (miRNAs) at the levels of transcript
stability and translation. To better understand the complex milieu of posttranscriptional gene
regulation, investigators have developed various methods to identify mechanisms of gene
regu-lation. RNA-immunoprecipitation applied to gene chips (RIP-Chip) or, more recently, to
RNA-Seq (next generation deep sequencing) are two such methods that have revealed
net-works of posttranscriptionally regulated genes. These methods can be used to explore both
known and novel transcripts.
The
elav
family of RBPs and HuR (
elavl1
) in particular play important roles in stabilization
and translational recruitment of labile mRNA transcripts to heavy polysomes in order to
facili-tate protein product expression. Since HuR is a stabilizer RBP, many labs, including our own,
have taken advantage of this fact and performed HuR RIP-Chip (or Seq) and RNA-Seq to
iden-tify mRNAs which may be coordinately regulated by HuR in a variety of biological systems [
1
–
3
],[
4
]. However, the vast majority of these analyses are not truly independent biological
sam-ples and they were mostly performed in transformed cell lines. Not as much is known about
HuR regulation of mRNA target genes in primary cells
in vivo
.
An active area of HuR investigation is in immune system regulation, especially during CD4
+T cell activation and differentiation. When our group first cloned murine HuR (HuA), we
dem-onstrated that T cell activation results in 14-fold increases in the total cellular HuR levels [
5
].
Other groups have shown that following T cell activation, HuR rapidly translocates to the
cyto-plasm [
6
]. Thus, we and others have hypothesized that HuR may facilitate T cell activation as
well as naïve CD4
+T cell differentiation programs.
Naive CD4
+T cells can differentiate into different subsets, including Th1, Th2, Th17,
Tfh and Treg, with unique signature transcription factors and different patterns of cytokine
gene expression. HuR was previously described as a regulator of transcription factors and
cytokines promoting CD4
+Th2 differentiation such as GATA-3 and IL-4 [
7
,
8
]. Th2
cyto-kines, such as IL-4, IL-5 and IL-13 play major roles in allergic airway inflammation.
How-ever, other HuR target transcripts essential for Th2 differentiation, besides those identified
previously, may have been overlooked. In order to address this, we took advantage of HuR
RIP-Chip techniques to determine direct HuR target transcripts in Th2 differentiating cells.
Additionally, RNA-Seq was performed in HuR knock-out (KO) vs. wild type control CD4
+cells under Th2 polarization to identify target transcripts which were altered in the absence
of HuR. To our knowledge, this is the first time these techniques have been used with
independent biological replicates from primary murine CD4
+T cells undergoing Th2
differentiation.
Material and Methods
Mice
OX40 Cre HuR
fl/flmice were generated as previously described [
7
]. In HuR
fl/flmice, a portion
of the promoter region, exon 1 and exon 2 of HuR gene were flanked with the loxP sites which
allow HuR ablation to occur upon
cre
recombinase excision. These mice were then crossed to
OX40-
cre
mice in which
cre
recombinase enzyme is expressed under the control of OX40
pro-moter in activated T cells to generate OX40-
cre
HuR
fl/flKO mice. All mice used were on the
C57BL/6 background and housed in the pathogen free facilities. All animal experiments and
procedures were conducted in accordance with the guidelines set forth by the University of
Missouri Animal Care and Use Committee (IACUC). The University of Missouri IACUC
approved all the experiments in this manuscript.
Murine T cell polarization
in vitro
Naive splenocytes were isolated from 6-8-wk-old C57BL/6 OX40-
Cre
HuR
fl/flknockout mice
or C57BL/6 HuR
fl/flcontrol mice. CD4
+T cells were isolated using CD4 (L3T4) MicroBeads
(Miltenyi Biotec) following the manufacturer’s protocol. Cells were activated with anti-CD3
anti-CD28 (5
μg/ml each) for 5 days in T cell media (DMEM, 10% FCS, 50ug/ml gentamicin,
1mM Na Pyruvate, 2mM L-Glutamine and 0.05mM beta-mercaptoethanol (2-BME). For Th2
polarizing condition 100 U/ml rIL-4, 50 U/ml rIL-2, and 10
μg/ml anti–IFN-
γ
Ab were added
in the media upon activation. Anti-CD3, anti-CD28, anti-IL-4, and anti- IFN-
γ
antibodies
were purchased from eBioscience (San Diego, CA). Cytokines were all purchased from
Pepro-tech (Rocky Hill, NJ). Tissue culture reagents were all purchased from Life Technologies.
RNA isolation and sequencing
CD4
+Th2 polarized cells were harvested from the
in vitro
culture on day 5 post-activation.
Approximately, 1x10
7cells were lysed and re-suspended in 1 ml of Trizol reagent (Life
Tech-nologies). Total RNA was then isolated according to the company protocol. For
RNA-sequenc-ing, 5ug of RNA from seven OX40-
cre
HuR
fl/flmice and seven HuR
fl/flcontrols were used to
make the libraries (TruSeq). RNA-sequencing was performed using an Illumina HiSeq 2000
sequencer at the DNA Core facility of the University of Missouri. These libraries were
sequenced in two different runs (one 6-plex and one 8-plex) of one lane each using 100 bp
single-end reads.
RNA-immunoprecipitation (RIP)
HuR and IgG1 RNA-immunoprecipitations were performed according to published protocol
[
1
,
9
]. Briefly, CD4
+Th2 polarized cells from HuR
fl/flwild-type controls on day 5 of
in vitro
polarization were lysed in polysomal lysis buffer (PLB) supplemented with RNaseOUT, DTT
and complete protease inhibitor. HuR (clone 3A2) or IgG1 isotype control antibodies were
pre-coated onto protein A Sapharose beads (PAS) overnight at 4°C. On the next day, antibody
coated beads were washed with NT-2 buffer (50mM Tris-Hcl pH7.4, 150mM NaCl
2, 1mM
MgCl
2and 0.05%NP-40) at least 5 times. Equal amount of protein lysates in PLB buffer were
with acid-phenol and precipitated using absolute ethanol. Total RNA was then processed for
RNA-sequencing (RNA-Seq). From each biological replicate (n = 3), two libraries (HuR IP and
IgG1 control) were prepared and sequenced on an Illumina HiSeq 2000 with 100 bp single end
reads. Each library was sequenced using a full lane on the sequencer.
Statistical analyses and bioinformatics
RNA-Seq data and RIP-Seq data were analyzed separately to determine the indirect and direct
HuR targets, respectively. After identifying those targets, the lists were merged and used for
further analysis to identify enriched canonical pathways and to build novel networks related to
HuR in CD4
+T cells.
RNA-Sequencing
The primary analysis of the pre-processed RNA-Seq data was conducted using
R/Bioconduc-tor, with other free, open-source programs used for the pre-processing itself. The preprocessing
steps consisted of: 1) quality assessment of FASTQ files using FastQC (
http://www.
bioinformatics.bbsrc.ac.uk/projects/fastqc
), 2) trimming of adapters from each library using
Cutadapt, 3) aligning libraries to the mm10 genome (
http://hgdownload-test.cse.ucsc.edu/
goldenPath/mm10/bigZips/
) using a seed-and-vote method, and 4) forming a read-count
matrix at the gene level by read summarization via featureCounts in Rsubread.
Non-specific filtering of genes prior to statistical testing was carried out to increase the
power of detecting differentially expressed genes [
10
], based on the requirement that a gene
have an expression level greater than 1 count per million reads mapped (CPM) for at least 7
libraries across all samples (HuR KO and wild-type control). Library normalization to adjust
for differences in library size was then made using the TMM method [
11
] in edgeR [
12
]. A
flex-ible mean-variance modeling and transformation process known as voom [
13
], was used in
conjunction with a linear modeling approach [
14
], a combination known as Limma Voom,
which was recently shown to perform among the best of available techniques in an
comprehen-sive comparison of differential gene expression methods for RNA-Seq data [
15
]. Using this
framework, normalized expression levels were compared between the KO/CTL, resulting in
estimated fold changes and associated p-values. Adjustment to the p-values was made to
account for multiple testing using the false discovery rate (FDR) method of Benjamini and
Hochberg; these are reported as q-values.
RIP-Sequencing
Pre-processing and read summarization of RIP-Seq data was carried out as described for the
RNA-Seq data. For each animal (n = 3), a HuR and IgG1 sample was processed separately
using the RIPSeeker [
16
] algorithm, which is a
de novo
method for detecting peaks (indicating
application of the central limit theorem, the difference between the average RIPscores (RIP and
control) has been shown to have a Gaussian distribution, which can be used to derive a
p-value. Finally, those p-values are adjusted for multiple testing using FDR. Data (HuR and IgG1
control) from each animal were analyzed individually by RIPSeeker to produce a list of
anno-tated RIP regions (aka peaks) and associated q-values. Taking cues from the quality control
protocol used for ChIP-Seq data in the ENCODE project, the peak lists were compared
between animals, and excluded if the peak list of any sample overlapped by less than 50% with
the other samples.
Combined analysis of RNA-Seq and RIP-Seq results for canonical
pathways and novel networks
The set of genes identified by RNA-Seq analysis (indirect targets) and by RIP-Seq analysis
(direct targets) were merged and used for further analysis to identify enriched canonical
path-ways and to build novel networks related to HuR in CD4
+T cells. Canonical pathways were
assessed and novel networks were generated through the use of Ingenuity Pathways Analysis
(Ingenuity Systems,
www.ingenuity.com
), henceforth IPA, as previously described [
17
]. The
complete lists of identified genes were uploaded into IPA along with the Entrez Gene identifier
(ID), fold change, and q-value. In the event of duplicate genes prior to uploading into IPA,
RIP-Seq (direct target) information for the gene was used as opposed to RNA-Seq (indirect
tar-get). Within IPA, in the event of commonly mapped IDs to the Ingenuity Knowledge Base
(IKB), the maximum fold change (i.e., RIP-Seq values took precedence over RNA-Seq values
when both significant) was used to represent the single results for that Gene ID. For canonical
pathway analysis, Fisher’s exact test was used to determine which pathways are enriched for
our reported direct or indirect HuR targets. For novel networks, a detailed description of the
network generating algorithm is provided by Calvano et al. [
18
]. Graphical representations of
the pathways were generated using IPA’s Path Designer, which illustrates the relationships
between molecules (i.e., nodes), and the biological relationship between two nodes is
repre-sented as an edge (i.e., connecting line). All edges are supported by at least 1 reference stored in
the IKB which was derived either from the literature, from a textbook or from canonical
information.
RT-qPCR
RNA isolation from CD4
+Th2 polarized cells on day 5 post-activation was performed using
Trizol extraction following the manufacture’s protocol. Reverse transcription (RT) was
per-formed using 0.5–1 ug of RNA with Superscript III reverse transcriptase (Invitrogen).
Quanti-tative PCR was done in triplicate using Platinum SYBR green Universal (Invitrogen). The data
were analyzed using comparative CT method with Gapdh as an endogenous control. Data
were present in arbitrary relative quantitative ratio (RQ). Student’s t-test was used to calculate
p-value based on delta-delta CT of the targets.
Murine primers for qPCR were listed below (forward/reverse):
Gapdh:
5
0-TCAACAGCAACTCCCACTCT TCCA-3
0/ 5
0ACCCTGTTGCTGTAGCCGTATTCA-3
0Il2
: 5
0-CCCAAGCAGGCCACAGAATTGAAA-3
0/
5
0-AGTCAAATCCAGAACATGCCG CAG-3
0Camk2:
5
0-TTGGCAGCAGACCCTAATG-3
0/
5
0-CTCCAAGCTGAGTGGACAAA-3
0Camk4:
5
0-TCTCACACCCGAACATCATAAA-3
0/
Results
Our RNA-Seq experiments obtained approximately 425 million total raw reads (mean of 30
million), while the RIP-Seq experiments resulted in approximately 160 million total raw reads
(mean of 26 million).
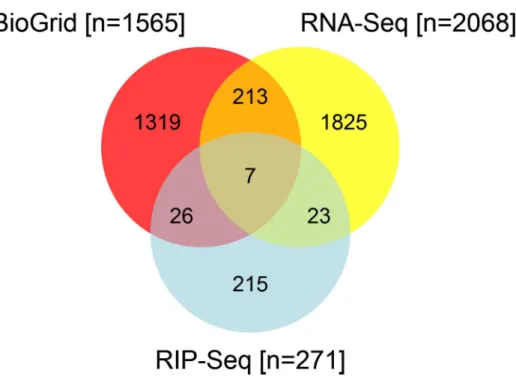
Fig 1
provides a broad overview of the results found by RNA-Seq and
RIP-Seq, in terms of the number of genes indicated as being significant by each method and
how they are related. We searched BioGRID, a public database (
http://thebiogrid.org/
, accessed
6/24/2014) that aggregates and archives published genetic and protein interaction data from
model organisms and humans [
19
–
21
], in order to compare our identified direct and indirect
HuR (ELAVL1) targets with those experimentally determined in the literature. We
down-loaded data files containing approximately 2000 interactions involving HuR in human, mouse,
and rat. Nearly all data came from humans; therefore, we only used BioGRID genes with
mouse orthologs to construct
Fig 1
. We also limited our RNA-Seq and RIP-Seq findings to
regions with official gene symbols because gene symbol is the identifier level at which the
Bio-GRID data is reported.
BioGrid, RNA-Seq and HuR RIP-Seq revealed 1514, 2068 and 271 transcripts involving in
Th2 differentiation respectively. Under Th2 polarizing conditions, 271 transcripts were shown
to be direct HuR target transcripts by HuR RIP-seq. The RNA expression level of 30 genes
shown to be direct HuR targets were altered in the absence of HuR. Of all the transcripts
ana-lyzed by these 3 methods, only seven have previously been shown to be known interacting
tar-gets by BioGrid. Thus, using these 3 analyses in combination, we discovered not only the
potential target transcripts with which HuR may physically interact, but we also revealed the
transcripts that may require HuR for their expression.
Fig 1. Venn diagram of RNA-Seq, RIP-Seq, and BioGRID reported ELAVL1 target genes.Results from the RNA-Seq and RIP-Seq experiments were compared to genes experimentally verified in the literature to interact with ELAVL1, as curated in the BioGRID database. Results from BioGRID were limited to genes with mouse orthologs to make the results more compatible with our experiments.
HuR indirect targets in CD4
+Th2 differentiation identified by RNA-Seq
2080 genes (2068 with designated gene symbol in NCBI Gene) were found based on a nominal
p-value cutoff of .05 (with corresponding q
<
.30), with a median p-value of .1275 (q = .15).
The full listing of these genes is given in
S1 Table
. A broad entry criterion was selected because
the ultimate goal was to use the identified differentially expressed genes as input for a
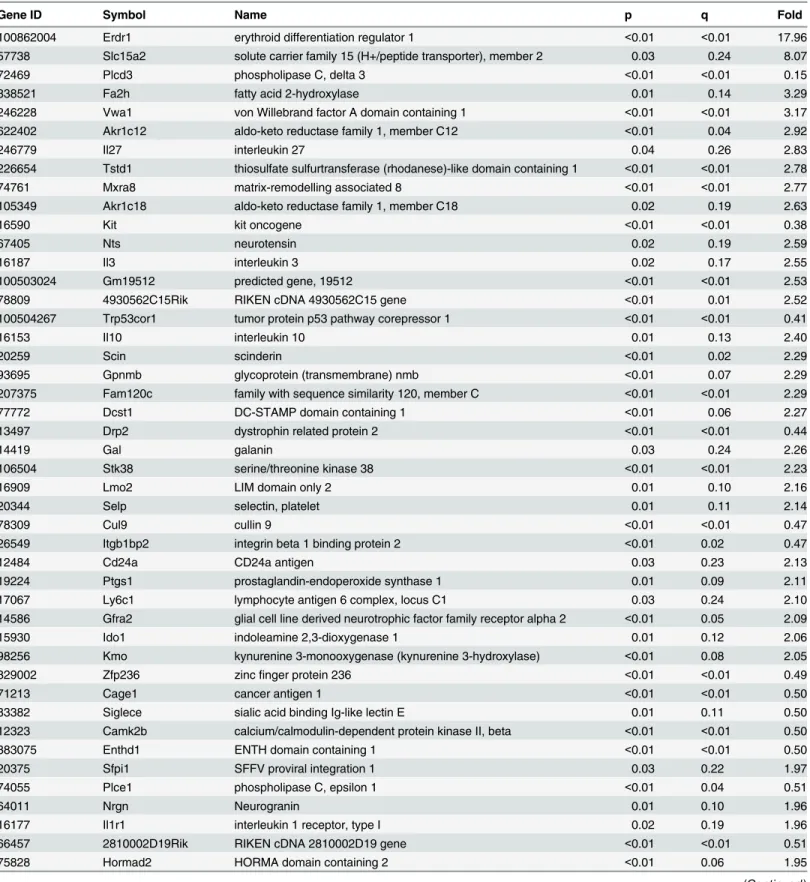
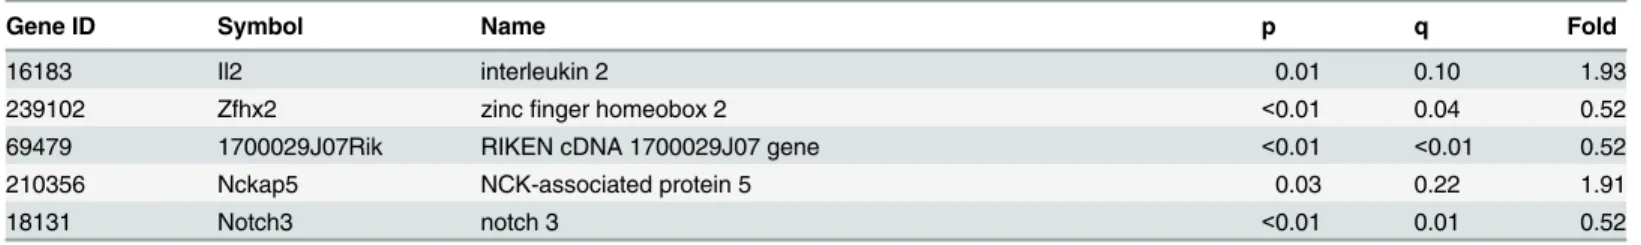
com-bined network analysis, using both RNA-Seq and RIP-Seq results. The top 50 differentially
expressed genes (with an assigned gene symbol) discovered via RNA-Seq are given in
Table 1
,
sorted by the absolute magnitude of the fold change. Here, fold change is defined as knock-out
(KO) divided by wild-type control (CTL).
Most of the genes in
Table 1
are highly significant (median q = .045) with a large
fold-change (median magnitude of the fold fold-change = 2.15). We also determined efficiency of HuR
ablation in activated HuR KO CD4
+T cells by Western analysis. As shown in
S1D Fig
, HuR
levels in HuR KO CD4
+T cells are indeed abolished. Additionally, we also verified RNA-Seq
data by determining mRNA steady state levels of three potential HuR target genes (CAMK2,
CAMK4 and IL-2) by RT-qPCR. Consistent with the RNA-Seq data, IL-2 mRNA was increased
in KO T cells by two-fold, whereas CAMK2 and CAMK4 levels were decreased 50% and 15%,
respectively RT-qPCR (
S1A–S1C Fig
).
Many genes that are involved in CD4
+T cell activation and Th2 differentiation were
identi-fied as genes whose expression is altered in the absence of HuR as shown in
Table 1
. Only a few
of those transcripts have been previously verified as HuR targets in other transformed cell lines
such as Plcd3 and Trp53cor1 [
22
,
23
].
Many of those known HuR regulated transcripts are not common with transcripts found in
CD4
+T cells, even if those transcripts are highly expressed in both transformed cell lines and
CD4
+T cells. This may indicate that HuR function may be cell type specific and HuR targets in
transformed cell lines may be different from primary cells. The RNA-Seq data also showed
novel HuR target transcripts encoding for cytokines, cytokine receptors and transcription
fac-tors required for CD4
+T cell functions such as IL-2, IL-10 and IL-1R1.
Direct
in vivo
HuR targets identified by RIP-Seq in CD4
+Th2
differentiation
Three independent experiments were conducted and analyzed separately to determine the
number of significant binding events (hits or peaks). Those regions were annotated based on
which gene the region overlapped (or the gene with nearest start site). Experiment 1 identified
149 binding events that mapped to 81 genes, experiment 2 found 381 that mapped to 193
genes, and experiment 3 found 348 that mapped to 172 genes. Experiment 1 did not meet the
minimum agreement with the other two experiments, so those results were excluded from
fur-ther analysis. The regions from the remaining two experiments were aggregated at the gene
level for a total of 271 unique genes with at least one significant binding event overlapping
them (
S2 Table
). The top 100 significantly different annotated regions from among 271
identi-fied via RIP-Seq are given in
Table 2
, along with the total number of significant
‘hits’
(binding
events) at that region among two independent RIP experiments.
Table 1. Top 50 RNA-Seq significantly different genes sorted by magnitude of fold change (KO/CTL).The official symbol of the top 50 (significant) genes found via RNA-Seq are given, along with fold change (KO/CTL), raw p-value for differential expression, and q (false discovery rate value based on method of Benjamini-Hochberg).
Gene ID Symbol Name p q Fold
100862004 Erdr1 erythroid differentiation regulator 1 <0.01 <0.01 17.96
57738 Slc15a2 solute carrier family 15 (H+/peptide transporter), member 2 0.03 0.24 8.07
72469 Plcd3 phospholipase C, delta 3 <0.01 <0.01 0.15
338521 Fa2h fatty acid 2-hydroxylase 0.01 0.14 3.29
246228 Vwa1 von Willebrand factor A domain containing 1 <0.01 <0.01 3.17
622402 Akr1c12 aldo-keto reductase family 1, member C12 <0.01 0.04 2.92
246779 Il27 interleukin 27 0.04 0.26 2.83
226654 Tstd1 thiosulfate sulfurtransferase (rhodanese)-like domain containing 1 <0.01 <0.01 2.78
74761 Mxra8 matrix-remodelling associated 8 <0.01 <0.01 2.77
105349 Akr1c18 aldo-keto reductase family 1, member C18 0.02 0.19 2.63
16590 Kit kit oncogene <0.01 <0.01 0.38
67405 Nts neurotensin 0.02 0.19 2.59
16187 Il3 interleukin 3 0.02 0.17 2.55
100503024 Gm19512 predicted gene, 19512 <0.01 <0.01 2.53
78809 4930562C15Rik RIKEN cDNA 4930562C15 gene <0.01 0.01 2.52
100504267 Trp53cor1 tumor protein p53 pathway corepressor 1 <0.01 <0.01 0.41
16153 Il10 interleukin 10 0.01 0.13 2.40
20259 Scin scinderin <0.01 0.02 2.29
93695 Gpnmb glycoprotein (transmembrane) nmb <0.01 0.07 2.29
207375 Fam120c family with sequence similarity 120, member C <0.01 <0.01 2.29
77772 Dcst1 DC-STAMP domain containing 1 <0.01 0.06 2.27
13497 Drp2 dystrophin related protein 2 <0.01 <0.01 0.44
14419 Gal galanin 0.03 0.24 2.26
106504 Stk38 serine/threonine kinase 38 <0.01 <0.01 2.23
16909 Lmo2 LIM domain only 2 0.01 0.10 2.16
20344 Selp selectin, platelet 0.01 0.11 2.14
78309 Cul9 cullin 9 <0.01 <0.01 0.47
26549 Itgb1bp2 integrin beta 1 binding protein 2 <0.01 0.02 0.47
12484 Cd24a CD24a antigen 0.03 0.23 2.13
19224 Ptgs1 prostaglandin-endoperoxide synthase 1 0.01 0.09 2.11
17067 Ly6c1 lymphocyte antigen 6 complex, locus C1 0.03 0.24 2.10
14586 Gfra2 glial cell line derived neurotrophic factor family receptor alpha 2 <0.01 0.05 2.09
15930 Ido1 indoleamine 2,3-dioxygenase 1 0.01 0.12 2.06
98256 Kmo kynurenine 3-monooxygenase (kynurenine 3-hydroxylase) <0.01 0.08 2.05
329002 Zfp236 zincfinger protein 236 <0.01 <0.01 0.49
71213 Cage1 cancer antigen 1 <0.01 <0.01 0.50
83382 Siglece sialic acid binding Ig-like lectin E 0.01 0.11 0.50
12323 Camk2b calcium/calmodulin-dependent protein kinase II, beta <0.01 <0.01 0.50
383075 Enthd1 ENTH domain containing 1 <0.01 <0.01 0.50
20375 Sfpi1 SFFV proviral integration 1 0.03 0.22 1.97
74055 Plce1 phospholipase C, epsilon 1 <0.01 0.04 0.51
64011 Nrgn Neurogranin 0.01 0.10 1.96
16177 Il1r1 interleukin 1 receptor, type I 0.02 0.19 1.96
66457 2810002D19Rik RIKEN cDNA 2810002D19 gene <0.01 <0.01 0.51
75828 Hormad2 HORMA domain containing 2 <0.01 0.06 1.95
S2 Table
. Location of binding overlaps the annotated region unless otherwise noted, in which
case the reported gene is the nearest annotated gene; we have indicated those in
Table 2
and
S2 Table
.
Various transcripts of protein coding genes, pseudogenes, lincRNA genes, miRNA genes,
snoRNA genes and unclassified genes were found to physically interact with HuR by HuR
RIP-Seq. The top significant HuR associated transcripts and the number of HuR hits are
dis-played in
Table 2
. Many of those transcripts are novel HuR target genes which have been
shown to play pivotal roles in CD4
+T cell activation and Th2 differentiation. We validated
HuR RIP-Seq data by performing HuR RIP followed by RT-qPCR in some of potential HuR
transcripts in Th2 polarized CD4
+T cells. IL-2, CAMK2 and CAMK4 transcript enrichment in
RIP using HuR antibody were analyzed as compared to RIP using IgG1 antibody. In agreement
with the HuR RIP-Seq data, IL-2 and CAMK4 were found to be direct HuR target transcripts
while CAMK2 did not seem to be an appreciable direct HuR target transcript (
S2A Fig
).
Combined network analysis of RNA-Seq and RIP-Seq regions
Table 3
lists alphabetically the seven genes found in the intersection of
Fig 1
, and combines
information reported in Tables
1
and
2
and
S2 Table
. In two instances, the hits do not perfectly
overlap the annotated gene, so the reported gene is the nearest annotated gene; we have
indi-cated those in
Table 3
.
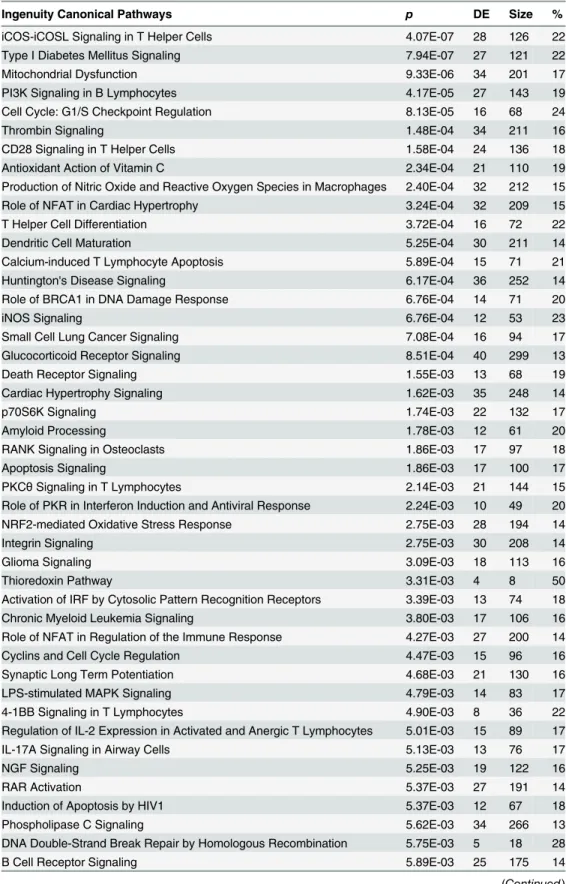
Based on the union of the RNA-Seq and RIP-Seq lists, we used IPA software to identify the
top 50 enriched canonical pathways (
Table 4
). We reported the significance and indicated the
magnitude of the enrichment as a percent of the genes in our list for a given canonical pathway
divided by the size of the canonical pathway.
Fig 2
gives details for the top identified canonical
pathway (iCOS-iCOSL Signaling in T Helper Cells) overlaid with relevant data (
Table 5
).
Sig-nificant pathway nodes are shaded according to the size of the fold change (red
>
1; green
<
1),
with white nodes indicating undetected genes and gray indicating genes that were detected, but
not significant. Nodes with multicolor gradients contain genes with significant fold changes in
different directions; complete relevant data for every node is given in
Table 5
,
Fig 3
and
Table 6
present similar information for another highly significant canonical pathway, CD28 Signaling
in T Helper Cells.
Multiple pathways involved in CD4
+T cell activation and Th2 differentiation are displayed
in Tables
3
to
6
and Figs
2
and
3
. Two major CD28 family co-stimulatory pathways,
iCOS-iCOSL (Inducible Co-stimulator)/AILIM (Activation-inducible lymphocyte
immunomedia-tory molecule) and CD28, in T helper cells are the most effected by HuR ablation. iCOS and
CD28 are both co-stimulatory molecules which are highly up-regulated upon the engagement
of T cell receptor (TCR). iCOS is induced upon T cell activation but not in naïve CD4
+T cells
while CD28 is constitutively expressed even before TCR engagement [
24
,
25
]. iCOS has been
shown to be essential for Th2 differentiation and for follicular helper T cell (Tfh) development
while CD28 signal is required for IL-2 production in activated CD4
+T cells [
26
–
28
]. This data
Table 1. (Continued)Gene ID Symbol Name p q Fold
16183 Il2 interleukin 2 0.01 0.10 1.93
239102 Zfhx2 zincfinger homeobox 2 <0.01 0.04 0.52
69479 1700029J07Rik RIKEN cDNA 1700029J07 gene <0.01 <0.01 0.52
210356 Nckap5 NCK-associated protein 5 0.03 0.22 1.91
18131 Notch3 notch 3 <0.01 0.01 0.52
Table 2. Top 100 significant RIP-Seq regions arranged by gene type.The top 100 significantly different annotated regions from among 271 identified via RIP-Seq are given along with the total number of significant‘hits’(binding events) at that region among two independent RIP experiments. Fold denotes the
minimumfold change observed across all of the hits, where fold change is expressed as (HuR/IgG). All regions given in this table have aminimumq-value
(false discovery rate value based on method of Benjamini-Hochberg)<1E-99 from testing for HuR binding to RNA. The regions are arranged by gene type, and then sorted by fold change. Location of binding overlaps the annotated region unless otherwise noted.
Symbol Feature Type Hits Fold Symbol Feature Type Hits Fold
Adipor2* protein coding 2 714 Odf2 protein coding 5 149
Nfe2l3* protein coding 2 510 Tcp11l1* protein coding 2 146
Ttc7b* protein coding 5 500 Gm1043* protein coding 1 145
Atxn1 protein coding 1 496 Mrgprd* protein coding 5 138
Mapk14* protein coding 3 477 Fgf23* protein coding 3 137
Cdk6 protein coding 1 473 Fam133b* protein coding 1 133
Olfr1445* protein coding 3 464 Cpne6* protein coding 6 116
Clrn1* protein coding 2 443 Wfdc8 protein coding 3 92
9130011E15Rik protein coding 3 397 Hrasls5* protein coding 3 86
Abcc2* protein coding 2 390 Gm15155 protein coding 4 84
Wnt16* protein coding 3 368 Adam29* protein coding 6 82
Nrn1* protein coding 2 363 Mex3b* protein coding 3 80
Atp2b4* protein coding 3 357 Kctd21* protein coding 2 78
Kcnh5* protein coding 2 352 Prr3 protein coding 3 76
Cldn25* protein coding 1 346 Tfdp1 protein coding 4 70
9630033F20Rik protein coding 1 316 Gm5072* protein coding 3 66
Glb1* protein coding 2 314 Fam107b protein coding 5 62
Exoc2 protein coding 2 309 Hck* protein coding 2 57
Adam12 protein coding 1 300 Tmx1* protein coding 2 52
Fam199x protein coding 2 285 Cd47 protein coding 5 51
Slc8a3 protein coding 3 281 Disp1* protein coding 3 42
Nup210l protein coding 3 276 Zc3h7a protein coding 2 31
Adh7* protein coding 1 273 Dtnbp1* protein coding 2 25
Ccin* protein coding 2 269 Ctdspl2 protein coding 2 20
Foxr1* protein coding 1 267 Gm11383* pseudogene 1 1377
Kcnb1 protein coding 5 267 RP23-331E4.1* pseudogene 4 281
Zfhx3* protein coding 2 251 Gm13567* pseudogene 1 234
Mettl13* protein coding 2 244 Gm13260* pseudogene 1 113
Dock9* protein coding 1 242 Gm13400* pseudogene 3 77
Tcp11l2* protein coding 3 238 Rps2-ps6* pseudogene 4 13
Mbnl1* protein coding 6 235 Gm14152 lincRNA gene 2 353
Kcnt2* protein coding 3 213 Gm12596* lincRNA gene 3 316
Espl1 protein coding 6 202 Gm13391* lincRNA gene 3 296
Dag1* protein coding 2 193 E530001K10Rik lincRNA gene 1 205
Dram2 protein coding 3 191 AC169129.1 lincRNA gene 3 48
Ndufa4l2* protein coding 3 191 Gm26333* miRNA gene 2 361
Pola1 protein coding 4 187 Gm25947* miRNA gene 3 253
Camk1* protein coding 1 185 Mir1956* miRNA gene 2 109
Srxn1* protein coding 3 171 Gm25972* miRNA gene 3 85
Tbl1xr1* protein coding 4 170 Gm24179* snoRNA gene 4 350
Fam174a* protein coding 4 169 Gm23404* snoRNA gene 8 125
Ebf2 protein coding 4 168 Gm24539* snoRNA gene 3 27
Elavl1 protein coding 6 159 Gm22983* snRNA gene 2 403
Sycp1 protein coding 7 158 Gm25130* snRNA gene 2 78
emphasize the possibility that HuR may play a role in regulating CD28 co-stimulatory receptor
family signaling pathways which control T cell function and differentiation.
In order to verify several potential HuR target transcripts that have been illustrated
previ-ously to be involved in the iCOS-iCOSL pathway, we have quantitated CAMK2, CAMK4 and
IL-2 levels in our system. CAMK2 and CAMK4 have been shown previously to inhibit IL-2
transcription [
29
]. Interestingly, our data show potential direct and indirect HuR regulation of
CAMK2 and CAMK4 on IL-2 expression. Down regulation of CAMK2 and CAMK4 observed
in Th2 differentiated HuR KO CD4
+T cells may result in up-regulation of IL-2 expression.
Although the mRNA levels of CAMK2 were significantly lower in the HuR KO Th2 polarized
CD4
+T cells as compared to the control, the protein levels were not significantly different
(
S1A–S1D Fig
). This may be due to the inability of Western blotting to detect subtle changes in
protein expression. Also, there are 4 isoforms of CAMK2 (
α
,
β
,
δ
and
γ
). Two isoforms of
CAMK2 (
β
and
β
’e splice variants) have been shown to suppress IL-2 expression [
29
]. The
anti-body used in this experiment detects all CAMK2 isoforms, making it difficult to detect subtle
alterations in individual isoform expression. Moreover, only expression of the CAMK2b
iso-form was altered in the absence of HuR and was a HuR target. These results emphasize the fact
that HuR regulation of target mRNA transcripts is complex. Additionally, HuR regulation at
the translation levels has to be considered in interpretation of mRNA results. Therefore, further
Table 2. (Continued)Symbol Feature Type Hits Fold Symbol Feature Type Hits Fold
Gm8914* protein coding 2 157 Gm22628* snRNA gene 2 22
Tram1* protein coding 6 157 4930505M18Rik* unclassified gene 1 1652
Shoc2 protein coding 8 155 AA387200* unclassified gene 2 142
Cdh13* protein coding 4 154 Gm14720 unclassified gene 3 106
Pold3* protein coding 2 153 Gm13256* unclassified gene 5 48
Golga1* protein coding 2 151 C330013F16Rik unclassified ncRNA 2 361
*Denotes the nearest annotated gene to the discovered binding site, rather than an overlapping annotated gene.
doi:10.1371/journal.pone.0129321.t002
Table 3. Genes found in both RNA-Seq and RIP-Seq, sorted alphabetically.The seven protein-coding genes identified as significant based on RIP-Seq and RNA-Seq are given. For RIP-Seq, the total number of significant‘hits’(binding events) per gene are reported, counted across two independent RIP experiments. Fold denotes theminimumfold change observed across all of the hits, where fold change is expressed as (HuR/IgG), and q denotes the maxi-mumq-value (false discovery rate value based on method of Benjamini-Hochberg) from testing for HuR binding to RNA. Location of binding overlaps the annotated gene unless otherwise noted. For RNA-Seq, fold denotes change (HuR KO/CTL).
RIP-Seq RNA-Seq
Gene ID Symbol Name Fold q Hits AveExpr q Fold
12326 Camk4 calcium/calmodulin-dependent protein kinase IV 637 <1E-68 2 7.40 .060 0.845
16423 Cd47 CD47 antigen (Rh-related antigen, integrin-associated signal transducer) 51 <1E-99 5 8.71 .077 1.181 15568 Elavl1 ELAV (embryonic lethal, abnormal vision)-like 1 (Hu antigen R) 159 <1E-99 6 7.25 .002 1.316
67698 Fam174a* family with sequence similarity 174, member A 169 <1E-99 4 4.70 .111 1.111
18286 Odf2 outer densefiber of sperm tails 2 149 <1E-99 5 7.46 .041 0.864
320554 Tcp11l1* t-complex 11 like 1 146 <1E-99 2 0.49 .073 1.632
106205 Zc3h7a zincfinger CCCH type containing 7 A 31 <1E-99 2 7.59 .002 1.308
*Denotes the nearest annotated gene to the discovered binding site, rather than an overlapping annotated gene.
Table 4. Top 50 canonical pathways for union of RIP-Seq and RNA-Seq analyses sorted by p-value.
Size indicates the number of molecules that comprise a pathway and DE indicates the number of significant genes identified by either RIP-Seq or RNA-Seq, where % represents DE/size.pis based on Fisher’s Exact Test and indicates pathways that are enriched for genes from RIP-Seq or RNA-Seq.
Ingenuity Canonical Pathways p DE Size %
iCOS-iCOSL Signaling in T Helper Cells 4.07E-07 28 126 22
Type I Diabetes Mellitus Signaling 7.94E-07 27 121 22
Mitochondrial Dysfunction 9.33E-06 34 201 17
PI3K Signaling in B Lymphocytes 4.17E-05 27 143 19
Cell Cycle: G1/S Checkpoint Regulation 8.13E-05 16 68 24
Thrombin Signaling 1.48E-04 34 211 16
CD28 Signaling in T Helper Cells 1.58E-04 24 136 18
Antioxidant Action of Vitamin C 2.34E-04 21 110 19
Production of Nitric Oxide and Reactive Oxygen Species in Macrophages 2.40E-04 32 212 15
Role of NFAT in Cardiac Hypertrophy 3.24E-04 32 209 15
T Helper Cell Differentiation 3.72E-04 16 72 22
Dendritic Cell Maturation 5.25E-04 30 211 14
Calcium-induced T Lymphocyte Apoptosis 5.89E-04 15 71 21
Huntington's Disease Signaling 6.17E-04 36 252 14
Role of BRCA1 in DNA Damage Response 6.76E-04 14 71 20
iNOS Signaling 6.76E-04 12 53 23
Small Cell Lung Cancer Signaling 7.08E-04 16 94 17
Glucocorticoid Receptor Signaling 8.51E-04 40 299 13
Death Receptor Signaling 1.55E-03 13 68 19
Cardiac Hypertrophy Signaling 1.62E-03 35 248 14
p70S6K Signaling 1.74E-03 22 132 17
Amyloid Processing 1.78E-03 12 61 20
RANK Signaling in Osteoclasts 1.86E-03 17 97 18
Apoptosis Signaling 1.86E-03 17 100 17
PKCθSignaling in T Lymphocytes 2.14E-03 21 144 15
Role of PKR in Interferon Induction and Antiviral Response 2.24E-03 10 49 20
NRF2-mediated Oxidative Stress Response 2.75E-03 28 194 14
Integrin Signaling 2.75E-03 30 208 14
Glioma Signaling 3.09E-03 18 113 16
Thioredoxin Pathway 3.31E-03 4 8 50
Activation of IRF by Cytosolic Pattern Recognition Receptors 3.39E-03 13 74 18
Chronic Myeloid Leukemia Signaling 3.80E-03 17 106 16
Role of NFAT in Regulation of the Immune Response 4.27E-03 27 200 14
Cyclins and Cell Cycle Regulation 4.47E-03 15 96 16
Synaptic Long Term Potentiation 4.68E-03 21 130 16
LPS-stimulated MAPK Signaling 4.79E-03 14 83 17
4-1BB Signaling in T Lymphocytes 4.90E-03 8 36 22
Regulation of IL-2 Expression in Activated and Anergic T Lymphocytes 5.01E-03 15 89 17
IL-17A Signaling in Airway Cells 5.13E-03 13 76 17
NGF Signaling 5.25E-03 19 122 16
RAR Activation 5.37E-03 27 191 14
Induction of Apoptosis by HIV1 5.37E-03 12 67 18
Phospholipase C Signaling 5.62E-03 34 266 13
DNA Double-Strand Break Repair by Homologous Recombination 5.75E-03 5 18 28
B Cell Receptor Signaling 5.89E-03 25 175 14
Table 4. (Continued)
Ingenuity Canonical Pathways p DE Size %
Sphingosine-1-phosphate Signaling 5.89E-03 19 123 15
Gαq Signaling 6.03E-03 24 171 14
HER-2 Signaling in Breast Cancer 6.92E-03 14 82 17
Sperm Motility 7.41E-03 21 143 15
TWEAK Signaling 7.41E-03 8 39 21
doi:10.1371/journal.pone.0129321.t004
Fig 2. Top canonical pathway (iCOS-iCOSL Signaling in T Helper Cells) overlaid with hits from union of RIP-Seq and RNA-Seq analyses.Significant pathway nodes are shaded according to size of fold change (red>1; green<1), with white nodes indicating genes that were not detected in the samples and gray indicating genes that were detected, but not significant. Nodes with multicolor gradients denote nodes with significant genes with fold changes in different directions (seeTable 2for more details). Fold change is defined as KO/CTL (RNA-Seq) or IP/CTL (RIP-Seq). Colored double borders indicate that the molecule is a complex.
experiments are needed to confirm the posttranscriptional regulation of these potential HuR
regulated genes.
Discussion
It has long been appreciated that there is a poor correlation between steady state mRNA levels
and protein products [
30
,
31
]. This observation strongly implied the importance of
scriptional gene regulation by RBPs and miRNAs. Keene and colleagues proposed the
posttran-scriptional operon hypothesis and developed techniques to identify
in vivo
mRNA targets of
different RBPs [
32
–
35
]. These techniques have been used by many labs to delineate the
uni-verse of mRNA transcripts which co-exist in ribonucleoparticles (RNPs) with ribosomes, RBPs
Table 5. Details of the hits in the top canonical pathway (iCOS-iCOSL Signaling in T Helper Cells).Official symbols of the significant genes found via RNA-Seq (RIP-Seq) that are in the pathway (Fig 2) is given along with name of its corresponding node in the pathway. Fold is given as KO/CTL (RNA-Seq) or IP/CTL (RIP-Seq), and q is the false discovery rate value based on method of Benjamini-Hochberg. Genes were identified by both RNA-Seq and RIP-Seq. Numbers in parentheses and italicized denote data obtained from RIP-Seq.Symbol Member of Node
Entrez Gene Name RNA (RIP)
Fold
RNA (RIP) q
AKT1 AKT v-akt murine thymoma viral oncogene homolog 1 0.887 0.140
ATM ATM ataxia telangiectasia mutated 0.905 0.189
Calm1 CALM calmodulin 1 1.132 0.153
CAMK4†
CALM calcium/calmodulin-dependent protein kinase IV 0.85 (637) 0.06 (<
1E-99)
Camk2b CAMKII calcium/calmodulin-dependent protein kinase II, beta 0.500 0.004
CD40 CD40 CD40 molecule, TNF receptor superfamily member 5 1.765 0.100
CD80 CD80\CD86 CD80 molecule 0.861 0.159
CD3D CD3 CD3d molecule, delta (CD3-TCR complex) 1.184 0.108
CD3G CD3 CD3g molecule, gamma (CD3-TCR complex) 1.178 0.026
HLA-DMA* MHC II major histocompatibility complex, class II, DM alpha (2196) (<1E-99)
HLA-DMB MHC II major histocompatibility complex, class II, DM beta 1.215 0.249
HLA-DOA MHC II major histocompatibility complex, class II, DO alpha 1.194 0.263
HLA-DOB MHC II major histocompatibility complex, class II, DO beta 0.622 <1E-3
IKBKE IKK inhibitor of kappa light polypeptide gene enhancer in B-cells, kinase epsilon 0.868 0.244 IKBKG IKK inhibitor of kappa light polypeptide gene enhancer in B-cells, kinase gamma 0.935 0.282
IL2 IL-2 interleukin 2 1.933 0.103
IL2RG IL-2R interleukin 2 receptor, gamma 1.167 0.036
ITK ITK IL2-inducible T-cell kinase 0.912 0.244
ITPR1 IP3R inositol 1,4,5-trisphosphate receptor, type 1 0.806 0.221
ITPR3 IP3R inositol 1,4,5-trisphosphate receptor, type 3 0.881 0.258
NFKB2 NFκB nuclear factor of kappa light polypeptide gene enhancer in B-cells 2 (p49/p100) 1.096 0.285 NFKBIE IκB nuclear factor of kappa light polypeptide gene enhancer in B-cells inhibitor, epsilon 1.089 0.111 PIK3C2A PI3K phosphatidylinositol-4-phosphate 3-kinase, catalytic subunit type 2 alpha 0.627 0.017
PLCG1 PLCγ1 phospholipase C, gamma 1 0.891 0.220
PLEKHA4 TAPP pleckstrin homology domain containing, family A (phosphoinositide binding specific) member 4
0.706 0.214
PPP3CA Calcineurin protein phosphatase 3, catalytic subunit, alpha isozyme 1.264 0.049
PTEN* PTEN phosphatase and tensin homolog (228) (<1E-99)
TRAT1 TRIM T cell receptor associated transmembrane adaptor 1 0.589 0.038
*found only by RIP-Seq †
found by both RNA-Seq and RIP-Seq
and miRNAs [
1
,
36
–
38
]. The further development of PAR-CLIP by Tuschl and his group
allowed for fine mapping of direct residues which RBPs used to interact with their targets [
3
,
39
,
40
]. Taken together, these approaches have greatly aided the field in better delineation of
posttranscriptionally regulated gene networks. Furthermore, these methods identified mRNAs
which may have been previously over-looked using traditional profiling methods since their
steady-state mRNA levels did not appreciably change.
As suggested by Phil Sharp and colleagues, RBPs and miRNA interact to affect cellular gene
expression programs to help cells survive environmental stresses [
41
]. However, it has become
increasingly clear that the cell employs these same mechanisms to posttranscriptionally control
gene expression during differentiation and development in many tissues. More recent works
Fig 3. Canonical pathway for CD28 Signaling in T Helper Cells overlaid with hits from union of RIP-Seq and RNA-Seq analyses.Significant pathway nodes are shaded according to size of fold change (red>1; green<1), with white nodes indicating genes that were not detected in the samples and gray indicating genes that were detected, but not significant. Nodes with multicolor gradients denote nodes with significant genes with fold changes in different directions (seeTable 3for more details). Fold change is defined as KO/CTL (RNA-Seq) or IP/CTL (RIP-Seq). Colored double borders indicate that the molecule is a complex.have identified the existence non-coding RNAs (such as lincRNAs and others) and have
strongly suggested important roles for these evolutionally conserved genes in biology.
Many early analyses of RNP structure using RIP techniques were performed with HuR and
family members since they are stabilizer RBPs, making it much easier to recover low copy
number mRNA targets [
1
,
5
]. However, these approaches have been expanded to include other
RNA binding proteins [
42
,
43
]. Data from different groups indicate that HuR interacts with
miRNAs in a cell specific context to either positively or negatively regulate target gene
expres-sion [
44
,
45
]. Many of the previous works were limiting in that transformed cancer cell lines
were used. Few studies were performed in primary cells or using tissues from animal models.
However, to identify physiologically relevant immune regulation, it was imperative to expand
utility of these techniques to
in vivo
animal models using primary cells. Another advantage of
HuR genetic ablation approaches is that one can generate very low levels of HuR to achieve
essentially a null allele in tissues, which can be difficult with conventional siRNA approaches.
It had been previously demonstrated that HuR plays crucial roles in cancer and immune
cells, especially during T cell activation and development. We used a novel conditional HuR
KO which ablates HuR following T cell activation since earlier ablation may interfere with T
cell development and potentially alter gene expression profiles [
7
]. We focused upon CD4
+T
cell differentiation since our earlier work as well as from other groups, has demonstrated the
significance of HuR in T cell cytokine expression [
7
,
8
,
46
,
47
].
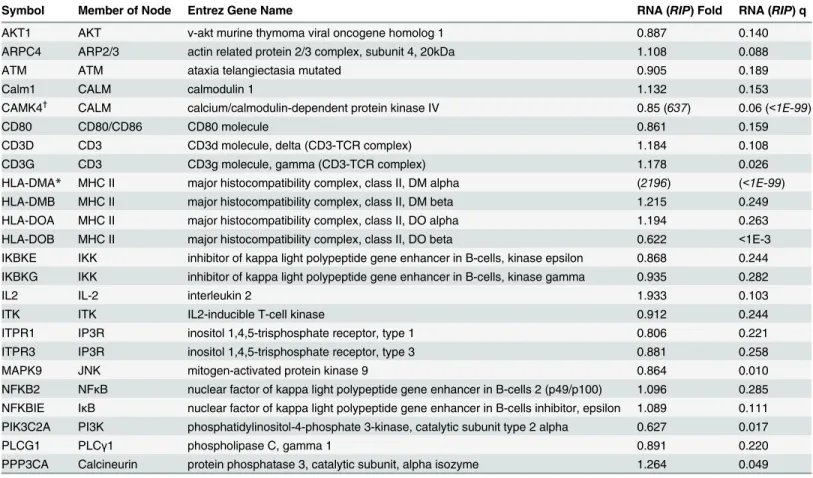
Table 6. Details of the hits of canonical pathway CD28 Signaling in T Helper Cells.Official symbols of the significant genes found via RNA-Seq (RIP--Seq) that are in the pathway (Fig 3) is given along with the name of its corresponding node in the pathway. Fold is given as KO/CTL (RNA-Seq) or IP/CTL (RIP-Seq), and q is the false discovery rate value based on method of Benjamini-Hochberg. Genes were identified by both RNA-Seq and RIP-Seq. Numbers in parentheses and italicized denote data obtained from RIP-Seq.
Symbol Member of Node Entrez Gene Name RNA (RIP) Fold RNA (RIP) q
AKT1 AKT v-akt murine thymoma viral oncogene homolog 1 0.887 0.140
ARPC4 ARP2/3 actin related protein 2/3 complex, subunit 4, 20kDa 1.108 0.088
ATM ATM ataxia telangiectasia mutated 0.905 0.189
Calm1 CALM calmodulin 1 1.132 0.153
CAMK4† CALM calcium/calmodulin-dependent protein kinase IV 0.85 (637) 0.06 (<1E-99)
CD80 CD80/CD86 CD80 molecule 0.861 0.159
CD3D CD3 CD3d molecule, delta (CD3-TCR complex) 1.184 0.108
CD3G CD3 CD3g molecule, gamma (CD3-TCR complex) 1.178 0.026
HLA-DMA* MHC II major histocompatibility complex, class II, DM alpha (2196) (<1E-99)
HLA-DMB MHC II major histocompatibility complex, class II, DM beta 1.215 0.249
HLA-DOA MHC II major histocompatibility complex, class II, DO alpha 1.194 0.263
HLA-DOB MHC II major histocompatibility complex, class II, DO beta 0.622 <1E-3
IKBKE IKK inhibitor of kappa light polypeptide gene enhancer in B-cells, kinase epsilon 0.868 0.244 IKBKG IKK inhibitor of kappa light polypeptide gene enhancer in B-cells, kinase gamma 0.935 0.282
IL2 IL-2 interleukin 2 1.933 0.103
ITK ITK IL2-inducible T-cell kinase 0.912 0.244
ITPR1 IP3R inositol 1,4,5-trisphosphate receptor, type 1 0.806 0.221
ITPR3 IP3R inositol 1,4,5-trisphosphate receptor, type 3 0.881 0.258
MAPK9 JNK mitogen-activated protein kinase 9 0.864 0.010
NFKB2 NFκB nuclear factor of kappa light polypeptide gene enhancer in B-cells 2 (p49/p100) 1.096 0.285 NFKBIE IκB nuclear factor of kappa light polypeptide gene enhancer in B-cells inhibitor, epsilon 1.089 0.111 PIK3C2A PI3K phosphatidylinositol-4-phosphate 3-kinase, catalytic subunit type 2 alpha 0.627 0.017
PLCG1 PLCγ1 phospholipase C, gamma 1 0.891 0.220
PPP3CA Calcineurin protein phosphatase 3, catalytic subunit, alpha isozyme 1.264 0.049
We analyzed data using Ingenuity Pathway Analysis (IPA) to identify top canonical
path-ways in which multiple genes were affected to probe HuR function in Th2 differentiated CD4
+T cells. To our knowledge, this is first report studying direct and indirect HuR immune targets
from primary CD4
+T cells using high coverage next generation sequencing. Our results
iden-tify many direct and indirect HuR gene targets which may play important roles in T cell
activa-tion and Th2 differentiaactiva-tion. We have verified not only various HuR targets common among
other cell types but have also discovered novel HuR target transcripts specific for Th2 cell
dif-ferentiation. Our data show that HuR may be involved in multiple T cell activation pathways
especially in CD28 family co-stimulatory molecule signaling pathways. However, we note care
in interpreting the data, since RNP formation has both kinetic and spatial components so that
timing of HuR ablation may alter target milieu. It would be prudent to confirm any putative
HuR mRNA targets identified by RIP-Seq and RNA-Seq at the level of translation. Indeed, a
recent publication has used an RNA-Seq heavy polysome screen to identify translationally
active HuR targets [
48
].HuR may function differently in distinct cell types since the mRNA
and miRNAs expression milieu varies. In future studies, it will be important to vary timing of
HuR ablation and determine the effects, if any, upon direct and indirect mRNA targets.
In summary, our data combined with studies from other labs can help delineate
posttran-scriptional networks by which RBPs, miRNAs and lincRNAs can coordinately affect cellular
gene expression at different points. Such information can directly aid in our understanding of
many pro-inflammatory disease processes such as asthma and autoimmunity.
Supporting Information
S1 Fig. a-c: Data representative of three HuR target transcripts altered in the absence of
HuR.
IL-2 (a), CAMK2 (b) and CAMK4 (c) mRNA levels in Th2 polarized cells on day 5
post-activation. mRNA from Th2 polarized cells from OX40-
cre
HuR
fl/fl(KO) or control mice were
iso-lated and analyzed for IL-2, CAMK2 and CAMK4 levels by RT-qPCR. The data were normalized
to non-HuR target control GAPDH mRNA. n = 3,
p
<
0.05,
p
<
0.001. (D): Western blot analysis
shows levels of HuR, CAMK2 and
β
-actin (loading control) proteins in unactivated KO (lane1),
unactivated control (lane2), Th2 polarized KO (lane3) and Th2 polarized control cells (lane4).
(TIF)
S2 Fig. a: CAMK4 and IL-2 are HuR target transcripts in Th2 polarized cells.
HuR
RNA-Immunoprecipitation (HuR-RIP) assay for detection of CAMK2, CAMK4 and IL-2
mRNA enrichment in Th2 polarized extracts immunoprecipitated with HuR or IgG1 isotype
antibodies followed by RT-qPCR. n = 2,
p
<
0.01.
(TIF)
S1 Table. Full list of genes which are indirect HuR targets in CD4
+Th2 differentiation
identified by RNA-Seq.
(XLSX)
S2 Table. Full list of genes which are direct
in vivo
HuR targets identified by RIP-Seq in
CD4
+Th2 differentiation.
(XLSX)
Author Contributions
References
1. Calaluce R, Gubin MM, Davis JW, Magee JD, Chen J, Kuwano Y, et al. The RNA binding protein HuR differentially regulates unique subsets of mRNAs in estrogen receptor negative and estrogen receptor positive breast cancer. BMC Cancer. 2010; 10:126. Epub 2010/04/08. doi: 1471-2407-10-126 [pii]doi:
10.1186/1471-2407-10-126PMID:20370918; PubMed Central PMCID: PMC2856550.
2. Lopez de Silanes I, Zhan M, Lal A, Yang X, Gorospe M. Identification of a target RNA motif for RNA-binding protein HuR. Proc Natl Acad Sci U S A. 2004; 101(9):2987–92. Epub 2004/02/26. doi:10.1073/ pnas.03064531010306453101[pii]. PMID:14981256; PubMed Central PMCID: PMC365732.
3. Mukherjee N, Corcoran DL, Nusbaum JD, Reid DW, Georgiev S, Hafner M, et al. Integrative regulatory mapping indicates that the RNA-binding protein HuR couples pre-mRNA processing and mRNA stabil-ity. Mol Cell. 2011; 43(3):327–39. Epub 2011/07/05. doi:10.1016/j.molcel.2011.06.007PMID:
21723170; PubMed Central PMCID: PMC3220597.
4. Lebedeva S, Jens M, Theil K, Schwanhausser B, Selbach M, Landthaler M, et al. Transcriptome-wide analysis of regulatory interactions of the RNA-binding protein HuR. Mol Cell. 2011; 43(3):340–52. Epub 2011/07/05. doi:10.1016/j.molcel.2011.06.008PMID:21723171.
5. Atasoy U, Watson J, Patel D, Keene JD. ELAV protein HuA (HuR) can redistribute between nucleus and cytoplasm and is upregulated during serum stimulation and T cell activation. J Cell Sci. 1998; 111 (Pt 21):3145–56. PMID:9763509.
6. Raghavan A, Robison RL, McNabb J, Miller CR, Williams DA, Bohjanen PR. HuA and tristetraprolin are induced following T cell activation and display distinct but overlapping RNA binding specificities. J Biol Chem. 2001; 276(51):47958–65. Epub 2001/10/17. doi:10.1074/jbc.M109511200PMID:11602610.
7. Gubin MM, Techasintana P, Magee JD, Dahm GM, Calaluce R, Martindale JL, et al. Conditional knock-out of the RNA-binding protein HuR in CD4+ T cells reveals a gene dosage effect on cytokine produc-tion. Mol Med. 2014. Epub 2014/01/31. doi:10.2119/molmed.2013.00127PMID:24477678.
8. Stellato C, Gubin MM, Magee JD, Fang X, Fan J, Tartar DM, et al. Coordinate regulation of GATA-3 and Th2 cytokine gene expression by the RNA-binding protein HuR. J Immunol. 2011; 187(1):441–9. Epub 2011/05/27. doi:10.4049/jimmunol.1001881PMID:21613615.
9. Dahm GM, Gubin MM, Magee JD, Techasintana P, Calaluce R, Atasoy U. Method for the isolation and identification of mRNAs, microRNAs and protein components of ribonucleoprotein complexes from cell extracts using RIP-Chip. Journal of visualized experiments: JoVE. 2012;(67: ). Epub 2012/10/12. doi:
10.3791/3851PMID:23051702; PubMed Central PMCID: PMC3490259.
10. Bourgon R, Gentleman R, Huber W. Independent filtering increases detection power for high-through-put experiments. Proc Natl Acad Sci U S A. 2010; 107(21):9546–51. Epub 2010/05/13. doi:10.1073/ pnas.0914005107PMID:20460310; PubMed Central PMCID: PMC2906865.
11. Robinson MD, Oshlack A. A scaling normalization method for differential expression analysis of RNA-seq data. Genome biology. 2010; 11(3):R25. Epub 2010/03/04. doi:10.1186/gb-2010-11-3-r25PMID:
20196867; PubMed Central PMCID: PMC2864565.
12. Robinson MD, McCarthy DJ, Smyth GK. edgeR: a Bioconductor package for differential expression analysis of digital gene expression data. Bioinformatics. 2010; 26(1):139–40. Epub 2009/11/17. doi:10. 1093/bioinformatics/btp616PMID:19910308; PubMed Central PMCID: PMC2796818.
13. Law CW, Chen Y, Shi W, Smyth GK. voom: precision weights unlock linear model analysis tools for RNA-seq read counts. Genome biology. 2014; 15(2):R29. Epub 2014/02/04. doi: 10.1186/gb-2014-15-2-r29PMID:24485249; PubMed Central PMCID: PMC4053721.
14. Smyth GK. Linear models and empirical bayes methods for assessing differential expression in micro-array experiments. Statistical applications in genetics and molecular biology. 2004; 3:Article3. Epub 2006/05/02. doi:10.2202/1544-6115.1027PMID:16646809.
15. Rapaport F, Khanin R, Liang Y, Pirun M, Krek A, Zumbo P, et al. Comprehensive evaluation of differen-tial gene expression analysis methods for RNA-seq data. Genome biology. 2013; 14(9):R95. Epub 2013/09/12. doi:10.1186/gb-2013-14-9-r95PMID:24020486; PubMed Central PMCID: PMC4054597.
16. Li Y, Zhao DY, Greenblatt JF, Zhang Z. RIPSeeker: a statistical package for identifying protein-associ-ated transcripts from RIP-seq experiments. Nucleic Acids Res. 2013; 41(8):e94. Epub 2013/03/05. doi:
10.1093/nar/gkt142PMID:23455476; PubMed Central PMCID: PMC3632129.
17. Padilla J, Simmons GH, Davis JW, Whyte JJ, Zderic TW, Hamilton MT, et al. Impact of exercise training on endothelial transcriptional profiles in healthy swine: a genome-wide microarray analysis. American Journal of Physiology—Heart and Circulatory Physiology. 2011; 301(2):H555–H64. doi:10.1152/ ajpheart.00065.2011PMID:21622830
18. Calvano SE, Xiao W, Richards DR, Felciano RM, Baker HV, Cho RJ, et al. A network-based analysis of systemic inflammation in humans. Nature. 2005; 437(7061):1032–7. doi:10.1038/nature03985PMID:
19. Chatr-Aryamontri A, Breitkreutz BJ, Heinicke S, Boucher L, Winter A, Stark C, et al. The BioGRID inter-action database: 2013 update. Nucleic Acids Res. 2013; 41(Database issue):D816–23. Epub 2012/12/ 04. doi:10.1093/nar/gks1158PMID:23203989; PubMed Central PMCID: PMC3531226.
20. Stark C, Breitkreutz BJ, Chatr-Aryamontri A, Boucher L, Oughtred R, Livstone MS, et al. The BioGRID Interaction Database: 2011 update. Nucleic Acids Res. 2011; 39(Database issue):D698–704. Epub 2010/11/13. doi:10.1093/nar/gkq1116PMID:21071413; PubMed Central PMCID: PMC3013707.
21. Stark C, Breitkreutz BJ, Reguly T, Boucher L, Breitkreutz A, Tyers M. BioGRID: a general repository for interaction datasets. Nucleic Acids Res. 2006; 34(Database issue):D535–9. Epub 2005/12/31. doi:10. 1093/nar/gkj109PMID:16381927; PubMed Central PMCID: PMC1347471.
22. Uren PJ, Burns SC, Ruan J, Singh KK, Smith AD, Penalva LO. Genomic analyses of the RNA-binding protein Hu antigen R (HuR) identify a complex network of target genes and novel characteristics of its binding sites. J Biol Chem. 2011; 286(43):37063–6. Epub 2011/09/06. doi:10.1074/jbc.C111.266882
PMID:21890634; PubMed Central PMCID: PMC3199453.
23. Mazan-Mamczarz K, Galban S, Lopez de Silanes I, Martindale JL, Atasoy U, Keene JD, et al. RNA-binding protein HuR enhances p53 translation in response to ultraviolet light irradiation. Proc Natl Acad Sci U S A. 2003; 100(14):8354–9. PMID:12821781.
24. Hutloff A, Dittrich AM, Beier KC, Eljaschewitsch B, Kraft R, Anagnostopoulos I, et al. ICOS is an induc-ible T-cell co-stimulator structurally and functionally related to CD28. Nature. 1999; 397(6716):263–6. Epub 1999/02/04. doi:10.1038/16717PMID:9930702.
25. Choi YS, Kageyama R, Eto D, Escobar TC, Johnston RJ, Monticelli L, et al. ICOS receptor instructs T follicular helper cell versus effector cell differentiation via induction of the transcriptional repressor Bcl6. Immunity. 2011; 34(6):932–46. Epub 2011/06/04. doi:10.1016/j.immuni.2011.03.023PMID:
21636296; PubMed Central PMCID: PMC3124577.
26. Watanabe M, Watanabe S, Hara Y, Harada Y, Kubo M, Tanabe K, et al. ICOS-mediated costimulation on Th2 differentiation is achieved by the enhancement of IL-4 receptor-mediated signaling. J Immunol. 2005; 174(4):1989–96. Epub 2005/02/09. PMID:15699127.
27. Shapiro VS, Truitt KE, Imboden JB, Weiss A. CD28 mediates transcriptional upregulation of the inter-leukin-2 (IL-2) promoter through a composite element containing the CD28RE and NF-IL-2B AP-1 sites. Mol Cell Biol. 1997; 17(7):4051–8. Epub 1997/07/01. PMID:9199340; PubMed Central PMCID: PMC232258.
28. Umlauf SW, Beverly B, Lantz O, Schwartz RH. Regulation of interleukin 2 gene expression by CD28 costimulation in mouse T-cell clones: both nuclear and cytoplasmic RNAs are regulated with complex kinetics. Mol Cell Biol. 1995; 15(6):3197–205. Epub 1995/06/01. PMID:7539104; PubMed Central PMCID: PMC230552.
29. Lin MY, Zal T, Ch'en IL, Gascoigne NR, Hedrick SM. A pivotal role for the multifunctional calcium/cal-modulin-dependent protein kinase II in T cells: from activation to unresponsiveness. J Immunol. 2005; 174(9):5583–92. Epub 2005/04/22. PMID:15843557.
30. Gygi SP, Rochon Y, Franza BR, Aebersold R. Correlation between protein and mRNA abundance in yeast. Mol Cell Biol. 1999; 19(3):1720–30. PMID:10022859.
31. Ideker T, Thorsson V, Ranish JA, Christmas R, Buhler J, Eng JK, et al. Integrated genomic and proteo-mic analyses of a systematically perturbed metabolic network. Science. 2001; 292(5518):929–34. PMID:11340206.
32. Keene JD. Posttranscriptional generation of macromolecular complexes. Mol Cell. 2003; 12(6):1347–9. PMID:14690589.
33. Tenenbaum SA, Carson CC, Atasoy U, Keene JD. Genome-wide regulatory analysis using en masse nuclear run-ons and ribonomic profiling with autoimmune sera. Gene. 2003; 317(1–2):79–87. PMID:
14604794.
34. Tenenbaum SA, Carson CC, Lager PJ, Keene JD. Identifying mRNA subsets in messenger ribonucleo-protein complexes by using cDNA arrays. Proc Natl Acad Sci U S A. 2000; 97(26):14085–90. PMID:
11121017.
35. Tenenbaum SA, Lager PJ, Carson CC, Keene JD. Ribonomics: identifying mRNA subsets in mRNP complexes using antibodies to RNA-binding proteins and genomic arrays. Methods. 2002; 26(2):191–
8. PMID:12054896.
36. Hieronymus H, Silver PA. Genome-wide analysis of RNA-protein interactions illustrates specificity of the mRNA export machinery. Nat Genet. 2003; 33(2):155–61. PMID:12524544.
37. Hieronymus H, Yu MC, Silver PA. Genome-wide mRNA surveillance is coupled to mRNA export. Genes Dev. 2004; 18(21):2652–62. PMID:15489286.
angiogenesis. Cell Cycle. 2010; 9(16):3337–46. Epub 2010/08/21. doi: 12711 [pii]doi:10.4161/cc.9.16. 12711PMID:20724828.
39. Hafner M, Landthaler M, Burger L, Khorshid M, Hausser J, Berninger P, et al. PAR-CliP—a method to identify transcriptome-wide the binding sites of RNA binding proteins. Journal of visualized experi-ments: JoVE. 2010;(41: ). Epub 2010/07/21. doi:10.3791/2034PMID:20644507; PubMed Central PMCID: PMC3156069.
40. Hafner M, Landthaler M, Burger L, Khorshid M, Hausser J, Berninger P, et al. Transcriptome-wide iden-tification of RNA-binding protein and microRNA target sites by PAR-CLIP. Cell. 2010; 141(1):129–41. Epub 2010/04/08. doi:10.1016/j.cell.2010.03.009PMID:20371350; PubMed Central PMCID: PMC2861495.
41. Leung AK, Sharp PA. MicroRNA functions in stress responses. Mol Cell. 2010; 40(2):205–15. Epub 2010/10/23. doi:10.1016/j.molcel.2010.09.027PMID:20965416; PubMed Central PMCID: PMC2996264.
42. Rattenbacher B, Beisang D, Wiesner DL, Jeschke JC, von Hohenberg M, St Louis-Vlasova IA, et al. Analysis of CUGBP1 targets identifies GU-repeat sequences that mediate rapid mRNA decay. Mol Cell Biol. 2010; 30(16):3970–80. Epub 2010/06/16. doi:10.1128/MCB.00624-10PMID:20547756; PubMed Central PMCID: PMC2916446.
43. Stoecklin G, Tenenbaum SA, Mayo T, Chittur SV, George AD, Baroni TE, et al. Genome-wide analysis identifies interleukin-10 mRNA as target of tristetraprolin. J Biol Chem. 2008; 283(17):11689–99. Epub 2008/02/08. doi:10.1074/jbc.M709657200PMID:18256032; PubMed Central PMCID: PMC2431067.
44. Bhattacharyya SN, Habermacher R, Martine U, Closs EI, Filipowicz W. Relief of microRNA-Mediated Translational Repression in Human Cells Subjected to Stress. Cell. 2006; 125(6):1111–24. PMID:
16777601.
45. Kim HH, Kuwano Y, Srikantan S, Lee EK, Martindale JL, Gorospe M. HuR recruits let-7/RISC to repress c-Myc expression. Genes Dev. 2009; 23(15):1743–8. Epub 2009/07/04. doi:10.1101/gad.1812509
PMID:19574298; PubMed Central PMCID: PMC2720259.
46. Chen J, Cascio J, Magee JD, Techasintana P, Gubin MM, Dahm GM, et al. Posttranscriptional gene regulation of IL-17 by the RNA-binding protein HuR is required for initiation of experimental autoimmune encephalomyelitis. J Immunol. 2013; 191(11):5441–50. Epub 2013/10/30. doi:10.4049/jimmunol. 1301188PMID:24166976; PubMed Central PMCID: PMC3831112.
47. Wang JG, Collinge M, Ramgolam V, Ayalon O, Fan XC, Pardi R, et al. LFA-1-dependent HuR nuclear export and cytokine mRNA stabilization in T cell activation. J Immunol. 2006; 176(4):2105–13. PMID:
16455966.