Article
Printed in Brazil - ©2017 Sociedade Brasileira de Química 0103 - 5053 $6.00+0.00
*e-mail: [email protected]
#Permanent address: Departamento de Química, Universidade Federal de Lavras, 37200-000 Lavras-MG, Brazil.
Preparative Separation and Structural Identification of Impurities of a New
α
2-Adrenoceptor Agonist Using Stacking Injection, LC-MS
nand LC-SPE-NMR
Josiane O. Cardoso,a Sérgio S. Thomasi,a,# Tiago Venâncio,a Ivan R. Pitta,b
Maria do Carmo A. de Limab and Regina V. Oliveira*,a
aDepartamento de Química, Universidade Federal de São Carlos, 13565-905 São Carlos-SP, Brazil
bNúcleo de Pesquisa em Inovação Tecnológica (NUPIT), Universidade Federal de Pernambuco, 50670-901 Recife-PE, Brazil
Identifying impurities in drug substances has become one of the most important issues in pharmaceutical analysis since it can have a significant impact on the efficacy of new pharmaceutical
products. Due to the purity requirements, in this paper a new synthetic α2-adrenoceptor agonist,
called LPSF-PT-31, was purified and its impurities were characterized by liquid
chromatography-multistage mass spectrometry (LC-MSn) and liquid chromatography-solid phase extraction-nuclear
magnetic resonance (LC-SPE-NMR). The purification step was conducted using a semi-preparative liquid chromatography and stacked injections as a new approach to drug purification. As a result, a
total yield of 75% of the pure LPSF-PT-31 and 2.9 L day-1 in solvent reduction was obtained. The
combination of semi-preparative stacking injection, LC-MSn, and LC-SPE-NMR, demonstrated to
be efficient to purify active drugs and unambiguously identify its impurities. In addition, isolation and identification of drug impurities in the early stages of development can improve the synthetic pathway, preventing the formation of impurities or minimizing this formation to minimum levels.
Keywords: semi-preparative separation, stacked injection, LC-MSn, LC-SPE-NMR, impurity
identification
Introduction
Identifying impurities in drug substances has become one of the most important issues in modern pharmaceutical analysis in order to achieve quality, safety and efficacy of drugs, once the presence of impurities, even in small amounts, can have a significant impact on the efficacy and toxicology of pharmaceutical products.1-5 Detecting,
isolating and structurally identifying impurities in drug substances and pharmaceutical formulations have been demanded by various regulatory organizations such as the Food and Drug Administration (FDA),6 the International
Conference on Harmonisation (ICH),7 the European
Medicines Agency (EMEA)8 and the Brazilian Health
Surveillance Agency (ANVISA).9 Impurities in drug
products can be attributed not only to the drug substance or inert ingredients used for formulating drugs, but they can also be related to starting materials, byproducts, breakdown products or polymorphs. Bearing in mind the impact of
impurities in active pharmaceutical ingredients (APIs), the ANVISA and ICH guidelines indicate that impurities at or above 0.1% in the drug substance require identification.7,9
In this context, the development of selective and efficient methods to isolate drug impurities is required. Preparative chromatography is an essential and conventional tool to isolate and purify compounds and it is widely used in chemical and pharmaceutical industries during the discovery and development process of new chemical entities (NCEs) to obtain a large amount of pure drugs. Moreover, the use of the stacked injection technique is very useful to improve the sample throughput of preparative separation, as well as to reduce the analysis time and the consumption of solvents.10-12 Using stacked injections
has been investigated for preparative isolation of pure enantiomers and these applications have been described in depth by several groups.11-18 However, to the best of
using stacked injections as a new approach for purifying drug substances or APIs.
For the purpose of identification and structural elucidation, liquid chromatography coupled to mass spectrometry (LC-MS) and nuclear magnetic resonance spectroscopy (NMR) are modern highly effective techniques, which are able to provide structural information unequivocally.1,2 Many
studies concerning impurity isolation and identification applying these techniques have been reported in the literature.11,13-20 However, on different occasions, it remains
a challenge to establish the identity of these impurities if their concentration level is not accessible to perform NMR analysis, especially when MS could be incompatible with the stability of the molecule, or generate the same mass and fragmentation pattern for the impurities and API, resulting in insufficient structural data for impurity identity. In this scenario, an attractive alternative is to use solid phase extraction as an interface between liquid chromatography and nuclear magnetic resonance (LC-SPE-NMR), which expands the applications of hyphenated techniques and allows high content structural data (NMR) on mass limited compounds.21 Therefore, due to the need for high purity of a
new drug and knowledge of its related impurities for further biological applications, in this paper a new α2-adrenoceptor
agonist with analgesic and sedative profile was purified and its two detected impurities were fully identified.
α
2-Adrenoceptors agonists are compounds that have
been used as adjuvant drug to improve therapeutic efficacy and the duration of action of drugs used for pain treatment like morphine.22-24 The main advantage of simultaneous use
of an adjuvant compound is to reduce the dose and frequency of administration of the main active drug, thus reducing side effects.22,23,25 Clonidine, a centrally acting α
2-adrenoceptor
agonist, is administrated as an adjuvant of analgesic and hypnotic compounds. However, its main disadvantages are the incidence of hypotension.23,26-28 Therefore, the
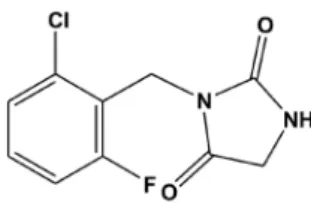
discovery of new drugs with properties similar to clonidine, but hemodynamically more stable is clinically relevant. A synthetic compound, 3-(2-chloro-6-fluorobenzyl)-imidazolidine-2,4-dione, named LPSF-PT-31, Girsupan (Figure 1) is a new α
2-adrenoceptor agonist with an
analgesic and sedative profile, which has showed dose-dependent antinociceptive effects via α
2-adrenoceptor
activation and improved stability of blood pressure and heartbeat rate when compared to clonidine. As a result, LPSF-PT-31 is a new and promising drug candidate to be used as an adjuvant drug with morphine to treat severe and chronic pain29 and, therefore, the purification and
identification of its unknown impurities (not previously reported) are extremely important for the synthesis of this drug in high purity enabling further biological studies.
The objective of the current study was to purify the synthetic drug, LPSF-PT-31, using semi-preparative chromatography and stacking injection and to identify and characterize two of the LPSF-PT-31 impurities by applying liquid chromatography-multistage mass spectrometry (LC-MSn)and LC-SPE-NMR techniques. This paper
describes in detail the analytical and semi-preparative method development, identification and characterization of the unknown impurities.
Experimental
Chemicals and materials
Girsupan (LPSF-PT-31), 3-(2-chloro-6-fluorobenzyl)-imidazolidine-2,4-dione, was planned and synthetized by the Research Center for Therapeutic Innovation at the Federal University of Pernambuco, Brazil, as described by Sudo et al.29 Methanol and acetonitrile (HPLC grade)
was purchased from Mallinckrodt Baker (St. Louis, MO, USA). Ammonium acetate salt was purchased from Sigma-Aldrich (St. Louis, MO) and water was purified using a Milli-Q purification system (Millipore, São Paulo, Brazil). Tri-deuterated acetonitrile (CD3CN) with 99.8%
of deuterium was obtained from Cambridge Isotope Laboratories, Inc. (Apeldoorn, The Netherlands).
Instruments and analytical conditions
Chromatographic separation: analytical and semi-preparative
The analytical high performance liquid chromatography (LC) system consisted of a Shimadzu LC system (Kyoto, Japan) equipped with an interface SCL-10Avp, a SIL-10ADvp autosampler, a DGU-10A degasser, a CTO10Svp column oven, two LC-10ATvp pumps and a SPD-10A UV-VIS detector operated at 268 nm. The analytical separation of LPSF-PT-31 was achieved on a phenyl-hexyl column (150 × 2.1 mm; 10 µm) at a flow rate of 0.5 mL min-1. A mobile phase consisted of water and
methanol (40:60, v/v) was used and the injection volume was 10 µL of a solution 0.5 mg mL-1 prepared in the mobile
phase. Data acquisition was performed using Shimadzu Class-Vp software.
The semi-preparative LC system consisted of a pump LC-6AD Shimadzu (Kyoto, Japan), a Rheodyne 7725i manual injector fitted with a 2 mL loop, a SPD-6AV UV-Vis detector operated at 268 nm and, a SCL-10A interface. The semi-preparative purification of LPSF-PT-31 was performed using a phenyl-hexyl column (200 × 7.0 mm; 10 µm) in reversed elution mode using a mobile phase, which consisted of water and methanol (30:70, v/v) and a flow rate of 4.0 mL min-1. The
semi-preparative separation using stacking injection was achieved by multiple injections of 2 mL of LPSF-PT-31 (1 mg mL-1) dissolved in the mobile phase every 4.5 min.
Data acquisition was performed using a CLASS LC-10 software. The collected fractions of LPSF-PT-31 and their related isomeric impurity was first evaporated by rotaevaporation to eliminate the organic solvent and then lyophilized to eliminate the water content. The obtained samples were weighed in order to obtain the yield of the purification process.
Structural identification
LC-MSn analysis
LC-MSn experiments were carried out using a
Shimadzu LC system (Kyoto, Japan) equipped with two LC-20AD pumps, a SIL-20A autosampler, a DGU-20A5 degasser and, a CBM-20A interface, coupled to a 3D Ion Trap (3D IT) mass spectrometer Esquire 6000 (Bruker Daltonics, Bremen, Germany). The chromatographic separation was achieved on a Luna phenyl-hexyl column (150 × 2.0 mm; 5 µm, Phenomenex) fitted with a phenyl-hexyl guard column (4.0 × 3.0 mm; 5 µm, Phenomenex) at room temperature. Isocratic elution mode was applied using a mobile phase consisted of ammonium acetate buffer (5 mmol L-1; pH 5.5) and methanol (40:60, v/v) at a
flow rate of 0.2 mL min-1. Ammonium acetate was used to
improve the analyte ionization. For the mass spectrometry (MS) analysis, an electrospray ionization (ESI) interface was selected and used in the positive ion mode. The 3D IT was operated under the following conditions: nebulizer gas 30 psi, dry gas 7.0 L min-1, dry gas temperature 325 °C and
capillary potential 4.5 kV. The flow rate for MS analysis was reduced to 95 µL min-1, using a flow rate splitter. For
data acquisition, the 3D IT was operated in the full MS scan mode using an accumulation time of 100 ms, a target of 30,000 and an acquisition range from m/z 100 to 400in conjunction with data-dependent MSn acquisitions on the
most intense ions selected from the MS-scan spectrum. Data acquisition and processing were performed using the Data Analysis software (Bruker Daltonics, Bremen, Germany).
LC-SPE-NMR analysis
LC-SPE-NMR measurements were carried out on a LC system (1200 series, Agilent GmbH) fitted with a G1311A quaternary pump, a G1322A degasser, a G1315D variable wavelength diode array detector, and a G1329A autosampler. The LC system was directly coupled to an automatic cartridge exchanger Bruker/Spark Prospekt 2 SPE unit (Bruker BioSpin, Rheinstetten, Germany; Spark, Emmen, The Netherlands) equipped with solid phase extraction (SPE) cartridges (HySphere Resin GP, 10 × 2.0 mm, 10 µm spherical polydivinylbenzene stationary phase), which was used to automatically trap the chromatographic peaks related to impurity A and B. The LC instrument was controlled by HYSTAR v. 3.2 software (Bruker BioSpin GmbH), which was used for data acquisition and processing.
The chromatographic separation was performed using a Kromasil C18 column (250 × 4.6 mm, 5 µm). Gradient elution was performed using a combination of water (eluent A) and methanol (eluent B) at 1.0 mL min-1 with the
following gradient: 0 to 5 min: 52% B; 5 to 19 min: 52 to 69% B; 19 to 20 min: 69 to 100% B; 20 to 26 min: 100% B; 26 to 27 min: 100 to 52% B; 27 to 35 min: 52% B for re-equilibration prior to injecting the next sample. The total analysis time was 35 min per sample. Peaks of impurities A and B were detected using the UV-Vis detector at 200 nm and were trapped based on their retention time onto the SPE cartridges using the automatic cartridge exchanger (Bruker Biospin GmbH). Deionized water was used as a makeup solvent at a flow rate of 3.0 mL min-1 using a Knauer K100
HPLC pump (Berlin, Germany), to reduce the strength of the eluent and to provide proper retention of the analytes onto the SPE cartridges. The SPE cartridges were preconditioned with acetonitrile (4 mL) and equilibrated with deionized water (4 mL) at 1.0 mL min-1. Twenty consecutive chromatographic
runs were performed using an injection volume of 20 µL and a flow rate of 1.0 mL min-1. After the sample loading, the
cartridges were dried with nitrogen for 30 min to remove residual solvent. Deuterated acetonitrile-d3 (99.8% D)
(200 µL) was used to elute the compounds from the SPE cartridges directly into NMR tubes (Bruker, 3 mm o.d.).
NMR experiments were performed in a Bruker Avance III instrument (14.1 Tesla / 600 MHz) equipped with a 1H {13C, 15N} TCI triple resonance cryogenically-cooled probehead,
reaching a maximum gradient strength of 55 G cm-1. The 1H NMR experiment was based on the 1D version of the
performed using exponential multiplication, applying a line broadening factor (lb) of 0.3 Hz. The 1H-1H g-COSY
(correlation spectroscopy) experiments were performed using a spectral width of 12,012 Hz, an acquisition time of 0.17 s, a relaxation delay of 1 s, and 16 scans per increment (256 increments). The 1H-13C g-HSQC (heteronuclear single
quantum correlation) experiments were performed using a spectral widths of 12,012 Hz for the F2 (1H) dimension
and 143,328 Hz for the F1 (13C) dimension. The acquisition
time was 0.17 s, the relaxation delay was 1 s, and 32 scans were performed per increment (256 increments). The
1H-13C g-HMBC (heteronuclear multiple bond correlation)
correlation maps were acquired using a spectral widths of 12,012 Hz for the F2 (1H) dimension and 143,292 Hz for
the F1 (13C) dimension, and 96 scans were performed per
increment (256 increments), using an acquisition time of 0.17 s and a relaxation delay of 1 s. Data acquisition and processing were performed using the TOPSPIN 3.0 software (Bruker BioSpin).
Results and Discussion
Separation and identification of unknown impurities of LPSF-PT-31
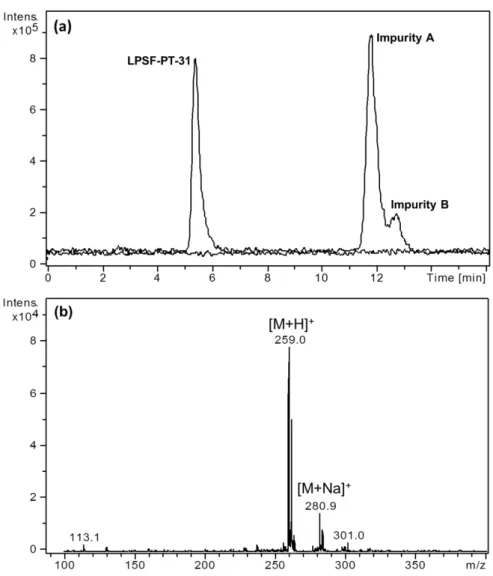
In this work, LPSF-PT-31 was analyzed using an analytical LC-MS method to verify its purity. During this exploratory analysis, apart from the LPSF-PT-31 chromatographic peak (eluting at 5.5 min), the presence of two impurities was also detected, which were denominated as impurity A and impurity B with retention time of 12 and 13 min, respectively. For both impurities A and B, the LC-MSn analyses revealed the same protonated ion at m/z 259 and the same fragmentation pattern which suggest that these two impurities were isomers. A typical extracted ion chromatogram (EIC) of the LPSF-PT-31 sample and a mass spectrum of the impurities are depicted in Figure 2.
The excellent chromatographic separation obtained for LPSF-PT-31 and its two unknown impurities prompted us
to investigate conditions to obtain multimilligram quantities of LPSF-PT-31 for further bioanalytical assays. Therefore, an analytical LC method was developed and scaled up to achieve a semi-preparative separation using stacked injections for isolation of the target compound. The stacked injection technique was selected to promote high sample throughput and, consequently, to save time and minimize consumption of solvents. By using stacked injections, the load of the next sample onto the chromatographic column was made before the end of the previous chromatographic elution and without compromising the chromatographic efficiency.11 When analytical chromatography is scaled
up to semi-preparative scale, if the packing is kept the same, it is thought that the eluent flow rate and sample load can be increased in proportion to the column cross-sectional area to obtain approximately the same separation. Therefore, the analytical method was modified by
scaling up the analytical parameters to achieve the semi-preparative separation needed for isolation of the pure compound. The new flow rate for the semi-preparative separation was calculated using the following equation: Fpreparative = [r2Lpreparative / r2Lanalytical]2 × Fanalytical; where
r = column radius, L = length of the column and F = flow rate. However, due to issues with column back pressure and solution viscosity, the initially calculated flow rate of 7.4 mL min-1 was decreased to 4.0 mL min-1 and the organic
modifier increased to 70%.
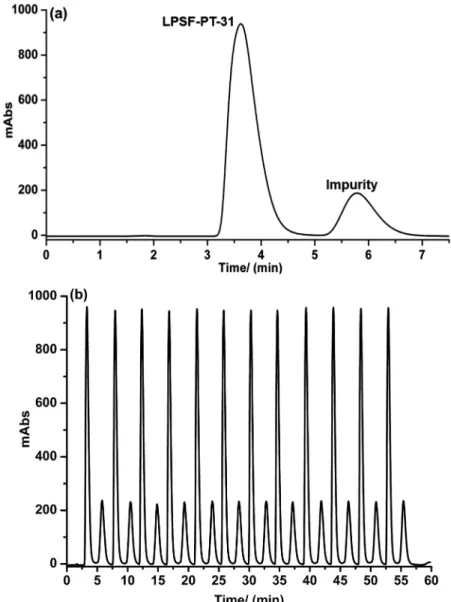
The semi-preparative purification of LPSF-PT-31 were performed with multiple injections every 4.5 min. Taking into consideration that the total analysis time of a conventional batch chromatography was 7.5 min, the use of stacked injections has enhanced the purification performance from 8 to 12 injections in 60 min. Figure 3 shows a representative chromatographic profile for the
separation of LPSF-PT-31 using a semi-preparative batch chromatography (Figure 3a) and a semi-preparative separation using 12 stacked injections (Figure 3b).
The developed methodology allowed for a purification rate of 24 mg h-1 of the synthetic drug, which resulted in
15.8 mg h-1 of pure LPSF-PT-31 with a yield of 65.8%
and 2.3 mg h-1 of impurity A and B with a yield of 9.6%,
demonstrating the applicability of stacking injections to purify a NCE. Additionally, by using this methodology, 30 min of analysis every hour and 120 mL h-1 of solvent
that corresponds to 2.9 L day-1 in solvent reduction were
saved. The semi-preparative total yield of 75% obtained for the isolation process is a consequence of the slice selection adopted for the chromatographic peak in order to achieve a high purity degree for LPSF-PT-31. The purified sample of LPSF-PT-31 obtained from the semi-preparative process was evaluated by LC-MSn and the presence only
of the correspondent protonated ion of LPSF-PT-31 (m/z
243) and absence of other ions attributed to contaminants
(m/z 259) were observed. In Figure 4, a representative extracted ion chromatogram and mass spectrum of the purified LPSF-PT-31 are depicted.
Structure elucidation of the unknown impurities by LC-MSn
and LC-SPE-NMR
During the purification process of LPSF-PT-31, the main priority was to obtain LPSF-PT-31 in high purity for initial metabolism assays. However, considering the importance of structural identification of impurities in new chemical species with pharmacological activity, we also focused our studies on the characterization of the impurities A and B detected in the synthesized LPSF-PT-31 sample.
In order to obtain structural characterization of the LPSF-PT-31 impurities, MSn experiments were performed as
a first attempt. The LC-MSn analyses revealed that impurities
A and B were isomers as they had the same protonated ion at
m/z 259 and the same fragmentation pattern. The MS2 mass
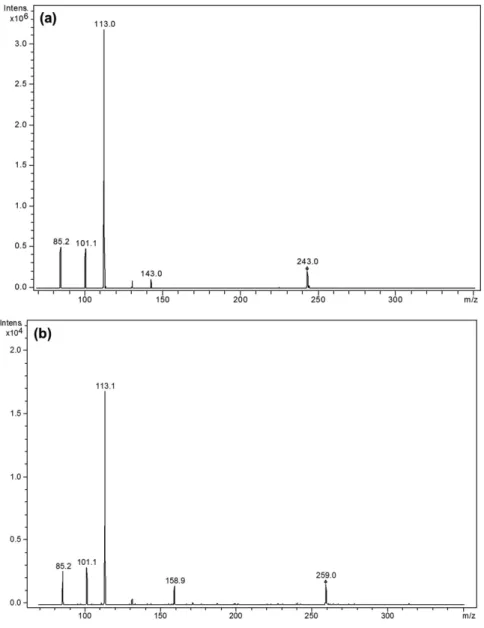
spectra of impurity A (Figure 5b) and impurity B (data not presented) showed a protonated molecular ion at m/z 259 and the formation of ion product characteristics at m/z 85, 113 and 159. Comparing the fragmentation pattern of LPSF-PT-31 (Figure 5a) and its impurities (Figure 5b), in both MS2 mass
spectrum, a major ion product at m/z 113 was observed, which corresponds to the moiety imidazolidine-2,4-dione (C4N2O2H5), indicating that the structural difference of
LPSF-PT-31 and its impurities occurs in the phenyl moiety. Moreover, the presence of chlorine atom was verified using mass spectrometry (Supplementary Information, Figure S1). The full MS scan of LPSF-PT-31 shows two peaks (M and M + 2) with a peak height ratio of 3:1 which corresponds to the presence of one chlorine atom, while the mass spectra for the impurities show three peaks in the molecular ion region (M, M + 2 and M + 4) with peak height ratios of 9:6:1, which corresponds to the presence of two chlorine
atoms. However, taking into consideration that impurities A and B were isomers, the complete structural identification and characterization of the impurities could only be achieved using NMR analyses, which requires larger quantities of each isolated impurity (µg to mg) than MS. To overcome this limitation, the LC-SPE-NMR technique was selected for the assays.
The LC-SPE-NMR is a powerful analytical tool that provides chromatographic LC separation and SPE enrichment of the target analytes for subsequent online or offline NMR analysis without the need for previous semi-preparative isolation of the impurities in pure form. Consequently, LC-SPE-NMR coupling provides increased sensitivity and substantial gains in the signal-to-noise ratio relative to conventional LC-NMR by multiple trapping of the interest peaks onto the same SPE cartridges through repeated chromatographic injections.30,31 Moreover, when
using LC-SPE-NMR, there is no need to use deuterated water as in LC-NMR methods. Hence, the structural information obtained from NMR analysis combined with the molecular mass and the fragmentation profile obtained from LC-MSn enable an unequivocal structural elucidation
of impurities, mainly for isomeric mixtures.1
For the purpose of structural identification of the LPSF-PT-31 impurities, the mixture of impurities A and B was subsequently analyzed through LC-SPE-NMR. The chromatographic conditions were optimized in order to offer a sufficient chromatographic separation, which was able to trap the impurities A and B by their retention time in two different SPE cartridges. The representative chromatogram of the separation of the LPSF-PT-31 impurities for trapping in the SPE cartridge is shown in the Supplementary Information, Figure S2. The SPE packing material (HySphere Resin GP) was selected to ensure appropriate retention of the impurities after multiple trapping injections. Moreover, a reduced particle size of 10 µm enables the use of a small volume of deuterated solvent for the SPE desorption. High sensitivity was obtained for the NMR analysis through twenty repeated LC injections onto the same SPE cartridge.
Impurity A showed to be 3-(2,4-dichlorobenzyl) imidazolidine-2,4-dione (1) (Figure 6) and it was identified by extensive analyses of 1H NMR, 1H-1H COSY as well
as 1H-13C HSQC and 1H-13C HMBC correlations maps
(Supplementary Information, Figures S3-S5). Two methylene hydrogens appearing as a singlet at d 4.67 (s, H-6) showed HMBC correlations with C-2 (d 158.7) and C-4 (d 171.7). These same correlations were also observed for the methylene hydrogens resonating at d 3.96 (s, H-5). A broad singlet attributed to H-1 (d 6.18, br s) showed cross peak correlation with H-6, which is directly attached to the sp3 carbon at d 47.6 (C-6) according to
the HSQC experiment. All this information was sufficient to confirm the presence of the imidazolidine-2,4-dione. Directly attached to C-6, an aromatic ring with a 1’-2’-4’ substitution pattern was assigned. The NMR signal of H-3’ appeared as a doublet at d 7.49 (H-3’, J 2.2 Hz, d) and shared an ortho correlation with H-5’ (d 7.33, J 2.2, 8.4 Hz, dd). H-5’ showed COSY correlation with H-6’ (d 7.25,
J 8.4 Hz, d). The substitution pattern was confirmed by the only HMBC correlation observed between H-6’ and C-6. All the other HMBC correlations and HSQC information support these findings.
Considering impurity B, a good quality spectrum with sufficient signal-to-noise and resolution in a reasonable amount of time was not obtained for 1H or 2D NMR
experiments. However, the structural identification for impurity B was readily obtained by comparing the
1H NMR, 1H-1H COSY, as well as 1H-13C HSQC and 1H-13C HMBC correlation maps obtained for the mixture
(containing impurities A and B) and those data obtained for impurity A. Based on these, the same imidizalidine-2,4-dione was assigned, but the difference lies in the substitution pattern of the aromatic system, which in this case led to a 3-(3,4-dichlorobenzyl)imidazolidine-2,4-dione (2) (Figure 6). Analyses of the aromatic region of the 1H NMR spectra showed that a 1’-3’-4’ substitution
pattern can be detected. The main HMBC correlation that supports the proposed structure is the one observed between H-2’ and H-6’ with C-6. Neither compounds 1 or 2 have fluorine attached to the aromatic system. No signals were detected in the 13C NMR spectra at d 159-165 appearing
as doublets because of the coupling since fluorine is a spin 1/2 nuclei. The NMR spectroscopic data (13C, 150 MHz; 1H, 600 MHz, MeCN-d
3) for 3-(2,4-dichlorobenzyl)
imidazolidine-2,4-dione (1) and 3-(3,4-dichlorobenzyl) imidazolidine-2,4-dione (2) are summarized in Table 1.
The 1H NMR and the two dimensional NMR spectra for
the mixture of impurities are depicted in the Supplementary Information, Figures S6-S9.
Figure 6. Chemical structures of LPSF-PT-31 impurities and important HMBC correlations. (1) 3-(2,4-Dichlorobenzyl)imidazolidine-2,4-dione; (2) 3-(3,4-dichlorobenzyl)imidazolidine-2,4-dione.
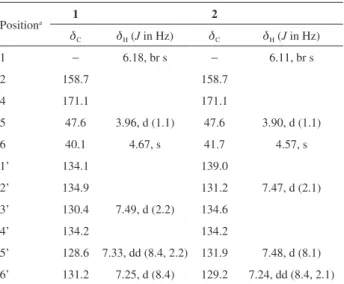
Table 1. NMR spectroscopic data (13C, 150 MHz; 1H, 600 MHz, MeCN-d3) for 3-(2,4-dichlorobenzyl)imidazolidine-2,4-dione (1) and 3-(3,4-dichlorobenzyl)imidazolidine-2,4-dione (2)
Positiona 1 2
dC dH (J in Hz) dC dH (J in Hz)
1 − 6.18, br s − 6.11, br s
2 158.7 158.7
4 171.1 171.1
5 47.6 3.96, d (1.1) 47.6 3.90, d (1.1)
6 40.1 4.67, s 41.7 4.57, s
1’ 134.1 139.0
2’ 134.9 131.2 7.47, d (2.1)
3’ 130.4 7.49, d (2.2) 134.6
4’ 134.2 134.2
5’ 128.6 7.33, dd (8.4, 2.2) 131.9 7.48, d (8.1)
6’ 131.2 7.25, d (8.4) 129.2 7.24, dd (8.4, 2.1)
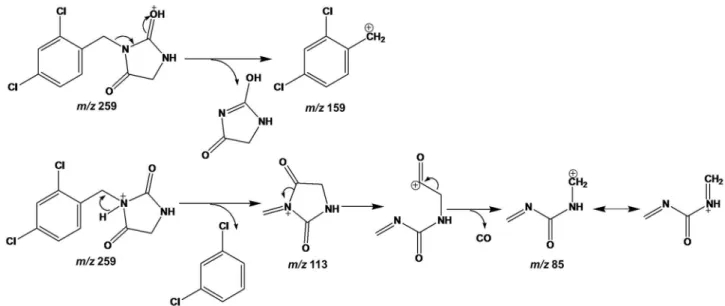
Based on the structural elucidation by NMR of the impurity A and B, a fragmentation proposal could be outlined for the LC-MSn experiments. From the precursor
ion (m/z 259), the ion product (m/z 113) was the most abundant one observed and this is attributed to the loss of 2,4-dichlorophenyl moiety and, afterwards the loss of carbon monoxide, leading to the ion product at m/z 85. The
m/z 159 was attributed to the loss of the imidazolidine-2,4-dione moiety. Figure 7 shows a fragmentation pathway proposed to impurity A and the proposal to impurity B are depicted in the Supplementary Information, Figure S10.
By integrating the LC-MSn and LC-SPE-NMR data
we derived the structure of the 2 synthesis impurities, which were respectively the (1) 3-(2,4-dichlorobenzyl) imidazolidine-2,4-dione and (2) 3-(3,4-dichlorobenzyl) imidazolidine-2,4-dione isomers, so that a structure only based on MS data could not be derived.
Conclusions
The present work showed the applicability of a semi-preparative chromatographic separation using stacked injection for the purification of LPSF-PT-31 on a multimilligram scale. This approach focused on obtaining maximum chromatographic efficiency so that data collection could be maximized. Additionally, the new developed assay using stacked injection demonstrates to be able to greatly reduce the analysis time and solvent consumption in the drug purification procedures. LC-SPE-NMR and LC-MSn
showed to be very powerful techniques for the identification and structural characterization of synthetic byproducts of LPSF-PT-31. The molecular formula of impurities could be deduced as C10H8Cl2N2O2 and the corresponding structure
Figure 7. Proposed fragmentation pathway of impurity A.
was characterized as 3-(2,4-dichlorobenzyl)imidazolidine-2,4-dione and 3-(3,4-dichlorobenzyl)imidazolidine-2,4-dione for impurity A and B, respectively. In addition, identifying LPSF-PT-31 impurities at the early stages of drug development could improve the synthetic procedure of this molecule preventing impurities and degradation products before using them in pharmacokinetic studies and even before it is promoted to a new drug on the market.
Supplementary Information
Supplementary data (chromatogram, NMR spectrum, LC-MSn fragmentation proposal) are available free of
charge at http://jbcs.sbq.org.br as PDF file.
Acknowledgments
The authors would like to acknowledge the financial support from the Fundação de Amparo à Pesquisa do Estado de São Paulo (FAPESP). Grants from the Conselho Nacional de Desenvolvimento Científico e Tecnológico (CNPq) (Scholarship No. 57185/2011-7) and the Coordenação de Aperfeiçoamento de Nível Superior (CAPES) are also acknowledged.
References
1. Singh, S.; Handa, T.; Narayanam, M.; Sahu, A.; Junwal, M.; Shah, R. P.; J. Pharm. Biomed. Anal.2012, 69, 148.
6. U.S. Department of Health and Human Service, Food and Drug Administration (FDA); Guidance for Industry ANDAs: Impurities in Drug Substances; USA, 2009.
7. International Conference on Harmonisation of Technical Requirements for the Registration of Pharmaceuticals for Human Use (ICH); ICH Harmonised Tripartite Guideline for Industry: Impurities in New Drug Substances Q3A (R2); EU,
Japan, USA, 2006.
8. The European Agency for the Evaluation of Medicinal Products (EMEA); Guideline on Control of Impurities of Pharmacopoeial Substances: Compliance with the European Pharmacopoeia
General Monograph Substances for Pharmaceutical Use
and General Chapter Control of Impurities in Substances for
Pharmacopoeial Use; UK, 2004.
9. Agência Nacional de Vigilância Sanitária (ANVISA); Resolução para Regulamentação da Notificação, Identificação
e Qualificação de Produtos de Degradação em Medicamentos,
Resolução RDC No. 58, de 20 de Dezembro de 2013; Diário Oficial da União: Brasília, Brasil, 2013.
10. Guiochon, G.; J. Chromatogr. A2002, 965, 129.
11. Grill, C. A.; Miller, L.; Yan, T. Q.; J. Chromatogr. A2004, 1026, 101.
12. Dingenen, J. In Preparative Enantioselective Chromatography; Cox, G. B., ed.; Blackwell Publishing Ltd.: Oxford, 2005, ch. 5. 13. Dongre, V. G.; Ghugare, P. D.; Karmuse, P. P.; Soudagar, S. R.;
Panda, N.; Kumar, A.; J. Pharm. Biomed. Anal.2007, 45, 422. 14. Dongre, V. G.; Karmuse, P. P.; Ghugre, P. D.; Salunke, S. M.;
Panda, N.; Kumar, A.; J. Pharm. Biomed. Anal.2006, 42, 334. 15. Thomas, S.; Bharti, A.; Maddhesia, P. K.; Shandilya, S.;
Agarwal, A.; Dharamvir; Biswas, S.; Bhansal, V.; Gupta, A. K.; Tewari, P. K.; Mathela, C. S. J.; Pharm. Biomed. Anal.2012, 61, 165.
16. Thomas, S.; Mathela, C. S.; Agarwal, A.; Paul, S. K.; J. Pharm. Biomed. Anal.2011, 56, 423.
17. Thomas, S.; Shandilya, S.; Bharati, A.; Paul, S. K.; Agarwal, A.; Mathela, C. S.; J. Pharm. Biomed. Anal.2012, 57, 39. 18. Nogle, L. M.; Mann, C. W.; Watts, W. L.; Zhang, Y. R.; J. Pharm.
Biomed. Anal.2006, 40, 901.
19. Sheldon, E. M.; J. Pharm. Biomed. Anal.2003, 31, 1153. 20. Sheldon, E. M.; Downar, J. B.; J. Pharm. Biomed. Anal.2000,
23, 561.
21. Rinaldi, F.; Fan, J.; Pathirana, C.; Palaniswamy, V.; Magn. Reson. Chem.2013, 51, 517.
22. Salmenpera, M. T.; Szlam, F.; Hug, C. C.; Anesthesiology1994, 80, 837.
23. Engelman, E.; Marsala, C.; Br. J. Anaesth. 2013, 110, 21. 24. Kamibayashi, T.; Maze, M.; Anesthesiology2000, 93, 1345. 25. Agarwal, S.; Aggarwal, R.; Gupta, P.; J. Anaesthesiol., Clin.
Pharmacol.2014, 30, 36.
26. Brown, M. J.; Harland, D.; Murphy, M. B.; Struthers, A. D.; Hypertension1984, 6, 57.
27. Poepping, D. M.; Elia, N.; Marret, E.; Wenk, M.; Tramer, M. R.; Anesthesiology2009, 111, 406.
28. Loomis, C. W.; Milne, B.; Cervenko, F. W.; Neuropharmacology 1988, 27, 191.
29. Sudo, R. T.; Calasans-Maia, J. A.; Galdino, S. L.; Lima, M. C. A.; Zapata-Sudo, G.; Hernandes, M. Z.; Pitta, I. R.; J. Pain 2010, 11, 71.
30. Exarchou, V.; Krucker, M.; van Beek, T. A.; Vervoort, J.; Gerothanassis, I. P.; Albert, K.; Magn. Reson. Chem. 2005, 43, 681.
31. Clarkson, C.; Sibum, M.; Mensen, R.; Jaroszewski, J. W.; J. Chromatogr. A2007, 1165, 1.
Submitted: March 2, 2016
Published online: September 20, 2016