Article
Printed in Brazil - ©2017 Sociedade Brasileira de Química0103 - 5053 $6.00+0.00
*e-mail: [email protected]
On the Fluorescent
,
Steric and Electronic Factors Affecting the Detection of Metallic
Ions Using an Imidazolyl-Phenolic Derived Fluorescent Probe
Ronaldo B. Orfão Jr., Fabrício de Carvalho, Paula Homem-de-Mello and Fernando H. Bartoloni*
Centro de Ciências Naturais e Humanas, Universidade Federal do ABC, 09210-580 Santo André-SP, Brazil
The imidazolyl-phenolic probe used at the present study has its photophysic properties regulated by a tautomeric equilibrium. After the absorption of a photon, an excited state intramolecular proton transfer process generates a ketonic species, responsible for the 440 nm emission (in CH3CN/H2O,
95:5, v/v). Addition of Cu2+, Al3+, Cr3+ and Fe3+ suppresses emission through a combination of
dynamic and static-like quenching, as indicated by Stern-Volmer plots, with a higher sensitivity for Cu2+ (K
SV = 1.90 × 10⁵ and 2.40 × 10⁴ L mol–1, respectively, for Cu2+ and Fe3+). The trivalent ions
led to the formation of a locked-enol tautomer that emits at shorter wavelengths; this coordinated compound is also quenched at metallic ions concentrations above 20 µmol L–1, due to a collisional
process. When compared to another imidazolyl-phenolic probe, experimental and simulated data revealed that fluorescent, steric and electronic effects regulate their sensitivity towards the ions.
Keywords: ESIPT, tautomerization, fluorescent sensor, copper(II), iron(III)
Introduction
The development of chemosensors for the detection of metallic cations in solution is a current topic of research, which elegantly combines preparative organic chemistry and spectroscopic studies, with the ultimate goal of applying such sensors for biological and environmental purposes.1-3 Fluorescent probes are frequently used as
the detection unit of chemosensors, combined with a recognition unit;4 nonetheless, some fluorescent probes
may act as a single detection/recognition system. In either case, the chemosensor efficiency depends on how strong is the binding interaction of the sensor with the metallic ion in solution. The presence of the latter can be indicated by changes on the properties of the free fluorescent sensor, such as the emission wavelength and/or intensity, or the appearance of a new band due to coordination of the sensor with the metallic cation.5,6
Generally, chemosensors are based on a switching on/ off mechanism,7 such that there is a relationship between
emission intensity and metallic ion concentration. Switching on mechanism occurs when an increased concentration of metallic ions enhances the emission intensity of the fluorescent sensor.8 In the opposite way, switching off
mechanism is the quenching effect of the emission intensity with increasing concentration of metal ions.3 In
recent years,9-13 several chemosensors were reported to
operate based on an excited state intramolecular proton transfer (ESIPT, Scheme 1) process. The ESIPT process can be interpreted as the disturbance of the equilibrium between two tautomers, the enolic (E) and ketonic (K) species, that happens after absorption of a photon. Such phenomenon occurs with an imidazolyl-phenolic framework,7 as the one
present in 2-(4,5-diphenyl-1H-imidazol-2-yl)phenol (1)14
and its derivative 2,4-di-tert-butyl-6-(4,5-diphenyl-1H -imidazol-2-yl)phenol (2).13 The phototautomerization
reaction occurs once that the E0 tautomer is the most
stable on the fundamental state (when compared to K0)
and, after the formation of the excited state E1, the ESIPT
process generates the more stable electronically excited tautomer K1. After deactivation of the K1 state through the
emission of a photon, the system thermally equilibrates from K0 back to the more stable E0 species. Since there is a
wide difference in the energy levels of the enolic (E0 → E1)
and ketonic (K1 → K0) species, this system displays a large
Stokes shift (regularly, greater than 100 nm).7 This results
in the non-existence of an overlap of the emission and absorption bands, making these promising compounds for use as fluorescent probes.15 The presence of certain metallic
the formation of the ketonic species and, thus, the ESIPT process is inhibited, changing the emission profile of the probe (Scheme 1).7,13
Our research group recently reported the application of compound 2 as a fluorescent sensor to detect Al3+, Cr3+,
Fe3+ and Cu2+ ions,13 which occurs due to the formation
of a complex and inhibition of the ESIPT process, thus, quenching the ketonic species emission. Moreover, the interaction between 2 and the aforementioned trivalent cations results on a new emission band, attributed to the fluorescence of a locked-enol tautomer, stabilized due to coordination.13 In this sense, it can be said that
chemosensor 2 works through a simultaneous switching on/off mechanism, with both quenching and enhancing of emission signals occurring at the same system, a desirable aspect of any sort of chemosensor.7 However,
the presence of the tert-butyl groups in 2 enhances the low-lying vibrational/rotational modes available to absorb the excess energy, resulting on a low fluorescence quantum yield (ΦFL < 0.1) of the probe.16 The non-existence of this
so-called free rotor effect16 in compound 1 can potentially
increase its ΦFL, when compared to probe 2, and this may have a positive feedback on the sensitivity of this system to detect metallic ions. The synthesis of compound 1 has been previously reported in many studies,14,17,18 as well as its
photophysical properties in methanol, dimethylformamide, tetrahydrofuran14 and acetonitrile,18 with comments
made on its ESIPT behavior.14 Although the interaction
of 1 with Zn2+,14 Co2+,17 and Cu2+18 has been previously
investigated, the disturbance of this probe’s keto/enol tautomerism, as evidenced by a Stern-Volmer approach, has never been applied for the detection of metallic ions in solution. To further increase our understanding concerning the interaction of the imidazolyl-phenolic framework with metallic cations, in this work we have studied the fluorescence quenching of probe 1 by Cu2+, Al3+, Cr3+ or
Fe3+ (as their nitrate salts), in an acetonitrile/water, 95:5, v/v
media. The Stern-Volmer treatment of the data indicates that two quenching processes, a collisional and an unusual static-like one, are responsible for the probe’s response towards the metallic ions. We have observed that fluorescent sensor 1 is more sensitive to the presence of these metallic ions than the tert-butyl derivative 2, previously studied by our group,13 even these two probes bearing the same
imidazolyl-phenolic framework. Expanding what has been done before, the analysis proposed herein suggests that this is due to a combination of factors: the higher fluorescence quantum yield of probe 1 and a reduced steric hindrance, with simultaneous increased nucleophilicity, of its coordination site, the latter evidenced by simulated electrostatic potential maps.
Experimental
UV-Vis absorption spectra were recorded on a Varian Cary 60 with a multicell holder thermostatized at 25 °C by a Varian Cary PCB 1500 system. Fluorescence spectra were recorded on a Varian Cary Eclipse (PMT voltage set at 650 V; both excitation and emission slits at 2.5 nm) with a single-cell holder thermostatized by a Varian Cary PCB 1500 system. Infrared spectrum was recorded on a PerkinElmer FTIR Spectrum Two coupled to an UATR Two accessory, used for measurements of the sample in the solid state. Gas chromatography coupled to low resolution mass spectrometry (GC-MS) analysis were performed on a Varian 4000, with electron impact ionization, an ion trap analyzer and a CP-8400 automated sampler. CHN composition was obtained in a PerkinElmer CHN 2400 analyzer, using benzoic acid as standard. Nuclear magnetic resonance (NMR) spectra was obtained at 25 °C on a Bruker AIII 500 MHz spectrometer; chemical shifts (d) are reported in parts per million (ppm) relative to tetramethylsilane (TMS). For the spectroscopic assays with metal ions, the following method was applied: to a mixture of CH3CN/H2O, 95:5, v/v, contained in a quartz cuvette
for absorbance or emission, already charged with 1
(ca. 10–6 mol L–1 final concentration, added as a
9.0 × 10⁻³ mol L–1 stock solution in CH
3CN), sequential
additions of small volumes of the nitrate salts stock solutions were made, without causing significant changes to the final
3.0 mL solution volume. The absorption or fluorescence spectra (λex = 310 nm) were recorded fifteen minutes after the preparation of each solution. Relative fluorescence quantum yields (ΦFL) were measured by integration of the corrected emission spectra relative to 2,4-di-tert-butyl- 6-(4,5-diphenyl-1H-imidazol-2-yl)phenol (2) in ethyl acetate as a standard (ΦFL = 0.11), after applying correction for the refractive indices of the solvents.19
2-(4,5-Diphenyl-1H-imidazol-2-yl)phenol (1) was prepared and isolated according to the procedure described by Benisvy et al.20 A 50 mL single neck round-bottomed
flask was charged with a mixture of salicylaldehyde (8.8 mmol), benzil (8.6 mmol) and ammonium acetate (64 mmol), in 30 mL of glacial acetic acid. After 2 hours of reflux the reaction was cooled to room temperature and a colorless precipitate was obtained. Afterwards, 30 mL of ice-cold deionized water were added; the crude product was collected by vacuum-filtration, washed with water (5 × 15 mL) and dried by suction. The resulting solid was dissolved in CH2Cl2 and dried under MgSO4. The solution
was filtered and the solvent removed by rotary evaporation, yielding a solid that was purified by recrystallization from CH2Cl2/pentane (1.15 g, 42% yield). Elemental analysis
calcd. for C21H16N2O: C, 85.1; H, 5.4; N, 9.5%; found: C,
84.5; H, 5.4; N, 9.3%; mp 200.5-201.2 °C (200-201 °C);14
IR (solid state) ν / cm–1 3192, 3057, 1600, 1539, 1138, 1071; 1H NMR (500 MHz, DMSO-d
6) d 6.96 (m, 2H), 7.25-7.29
(m, 4H), 7.42-7.55 (m, 7H), 8.04 (dd, 1H), 12.96 (s, 1H), 13.04 (s, 1H); 13C NMR (125 MHz, DMSO-d
6) d 112.84,
116.81, 118.85, 124.93, 126.77, 127.05, 127.28, 128.31, 128.50, 128.77, 130.07, 130.24, 133.58, 134.11, 145.83, 156.67; MS (EI, +): m/z, observed: 312.2; C21H16N2O [M]+
requires: 312.13. Spectra for the GC-MS (Figure S1), IR (Figure S2) and NMR (Figure S3 for 1H and Figure S4
for 13C) analysis are presented in the Supplementary
Information.
Quantum mechanical calculations were used to obtain structure in a minima of surface energy potential and to calculate the molecular electrostatic potential map (MEP) in ChelpG scheme as implemented in Gaussian-09 program,21
using density functional theory by means of Becke3-Lee-Yang-Parr (B3LYP) functional and 6-31G(2d,2p) basis set. In MEP plots, the negative regions regard nucleophilic sites, and the positive regions are electrophilic sites.
Results and Discussion
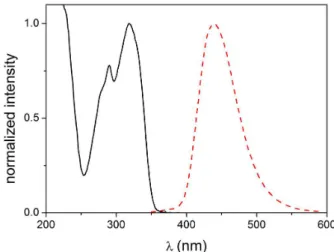
The fluorescent probe 1 presented absorption bands at 291 and 318 nm, with a single emission band centered at 440 nm (Figure 1). This Stokes shift represents a 122 nm (8719 cm–1) difference, suggesting that, as expected,
the excited state of the keto tautomer (K1, Scheme 1)
is responsible for the fluorescence emission of the free compound.7,13 It is known that 1 follows an ESIPT pathway
after photoexcitation (Scheme 1), as previously reported on the literature for such compound14 and as seen for
other substances sharing structural similarities.7,13,22,23 For
comparison, probe 1 has maximum absorption and emission bands at 316 and 430 nm, with a smaller 8390 cm–1 Stokes
shift, when methanol is used as solvent.14 The tert-butyl
containing derivative 2 studied by our group absorbs at 294 and 322 nm and emits at 466 nm, also in acetonitrile/water, 95:5, v/v, comprising a 9597 cm–1 Stokes shift.13 The herein
measured fluorescence quantum yields in acetonitrile/water, 95:5, v/v, media for compounds 1 and 2 were ΦFL = 0.350 and 0.013, respectively. As stated in the Introduction section, the two tert-butyl groups increase the number of available vibrational/rotational modes that can absorb the excess excitation energy (free rotor effect),16 consequently,
the non-radiative decay through internal conversion is favored. Compound 1 has a ΦFL almost thirty times higher than 2 in the studied solvent mixture, thus, its application as fluorescent sensor can be explored for the detection of metallic cations due to its increased luminescent properties.
The free chemosensor 1 showed fluorescence emission at 440 nm in an acetonitrile/water, 95:5, v/v, media (Figure 1). The addition of the metallic ions Ca2+, Co2+, Ni2+, Zn2+ or Ba2+
(Figures S5-S9) did not induce any significant changes in the emission profile (Figure 2), indicating that in these conditions there is no interaction of the fluorescent sensor 1 with such metallic ions. These results differ from the ones obtained by Eseola et al.14 and Buchholz et al.,17 who reported the titration
and characterization of a coordinated compound between 1
and Zn2+ or Co2+, respectively. Eseola et al.14 observed that
the coordination of Zn2+ with 1 promoted a fluorescence
emission quenching, when the reaction is carried out in methanol; 1 was used at a 1 × 10⁻⁴ mol L–1 concentration and
the quenching effect was reported on the 1 to 5 × 10⁻⁸ mol L–1
concentration range of Zn2+. This is significantly different
from our system, where no suppression was observed with
1 at 8 × 10⁻⁶ mol L–1 with the addition of Zn2+ from 1 × 10⁻⁶
to 2 × 10⁻⁵ mol L–1. At the present study and at the one
performed by Eseola et al.,14 the complexation reaction
occurred in situ spontaneously, however, Buchholz et al.17
had to apply reflux conditions to achieve coordination with Co2+ in ethanol. The present work proposes the application of
1 to detect metallic ions through a spontaneous complexation at ambient temperature; in our case, the interaction between probe 1 and Zn2+ or Co2+ in an acetonitrile/water, 95:5, v/v,
media was not observed at any extent.
There is a substantial change in the emission profile of compound 1 in the presence of Cu2+, Al3+, Cr3+ or Fe3+ ions.
Quenching of the 440 nm emission band was observed for these ions (Figure 2b) and in the presence of Al3+, Cr3+
and Fe3+ a new one originated around 385 nm (Figure 2c).
The appearance of this new emission band indicates that coordination of the fluorescent probe with the ionic species has occurred in solution,7,24,25 generating a locked-enol
tautomer (Scheme 2) which fluoresces at 385 nm. It is expected that the locked-enol tautomer would emit at a shorter wavelength than the one for the free keto tautomer emission, due to the relative energy difference between the fundamental and excited states of these species (Scheme 1).13
Effect of Cu2+ addition on the emission profile
The successive addition of Cu2+ ions to a solution
containing probe 1 caused a systematic decrease in the 440 nm emission band intensity (Figure 3a), with a fairly linear intensity vs. concentration relationship (Figure 3b). The emission band that appeared near 385 nm for the trivalent cations Al3+, Cr3+ or Fe3+ (Figure 2c), regarding the
formation of the locked-enol tautomer, was not observed within the used Cu2+ concentration range. Although this may
suggest that the locked-enol species is not being generated with Cu2+, this is not the case. It seems that Cu2+ is very
efficient in quenching the emission of the enolic tautomer as well, preventing the observation of its fluorescence; this has been previously addressed by our group for the interaction of probe 2 with Cu2+.13 From a correlation
between log (I) and[Cu2+] (data not shown) it was possible
to determine the limit of detection (LOD)3 of Cu2+ in this
fluorescent system, being obtained a LOD = 0.24 µmol L–1.
Thus, the detection of Cu2+ ions through the fluorescence
quenching of compound 1 has a higher sensitivity when compared to other fluorescent sensors for Cu2+ reported in
the literature, with LOD values as 0.86,13 1.15,3 69.026 and
130.0 µmol L–1.27 Care should be taken when different LOD
values are compared, once that different solvent systems
Figure 2. (a) Emission spectra of 1 (8.0 × 10⁻⁶ mol L–1, λ
ex = 310 nm)
in CH3CN/H2O (95/5, v/v) with the addition of Al3+ (1.8 × 10⁻⁵ mol L–1);
Ca2+ (1.1 × 10⁻⁵ mol L–1); Cr3+ (2.8 × 10⁻⁵ mol L–1); Fe3+ (1.9 × 10⁻⁵ mol L–1);
C o2 + ( 2 . 5 × 1 0– 5 m o l L– 1) ; N i2 + ( 1 . 7 × 1 0– 5 m o l L– 1) ;
C u2 + ( 5 . 8 × 1 0– 5 m o l L– 1) ; Z n2 + ( 1 . 4 × 1 0– 5 m o l L– 1) ;
Ba2+ (1.6 × 10⁻⁵ mol L–1). Changes on the emission profile due to the
may be involved; for example, the aforementioned 69.0 and 130.0 µmol L–1 values for Cu2+ detection where determined
in CH3CN/H2O, 75:25 (v/v) and methanol, respectively,
which are more polar than the CH3CN/H2O, 95:5 (v/v)
media used at the present study.
To further understand the types of interaction between
1 and Cu2+ that can lead to fluorescence quenching, the
obtained data was analyzed through a Stern-Volmer treatment (Figure 4). The observed upward curvature of this Stern-Volmer plot is an experimental evidence for
the occurrence of both collisional and static quenching processes.3,13,28 A reasonable linear relationship (r = 0.985)
was observed until 1.7 × 10⁻⁶ mol L–1 of Cu2+, furnishing a
Stern-Volmer constant KSV = (1.90 ± 0.10) × 105 L mol–1.
Effect of Al3+, Cr3+ andFe3+ addition on the emission profile
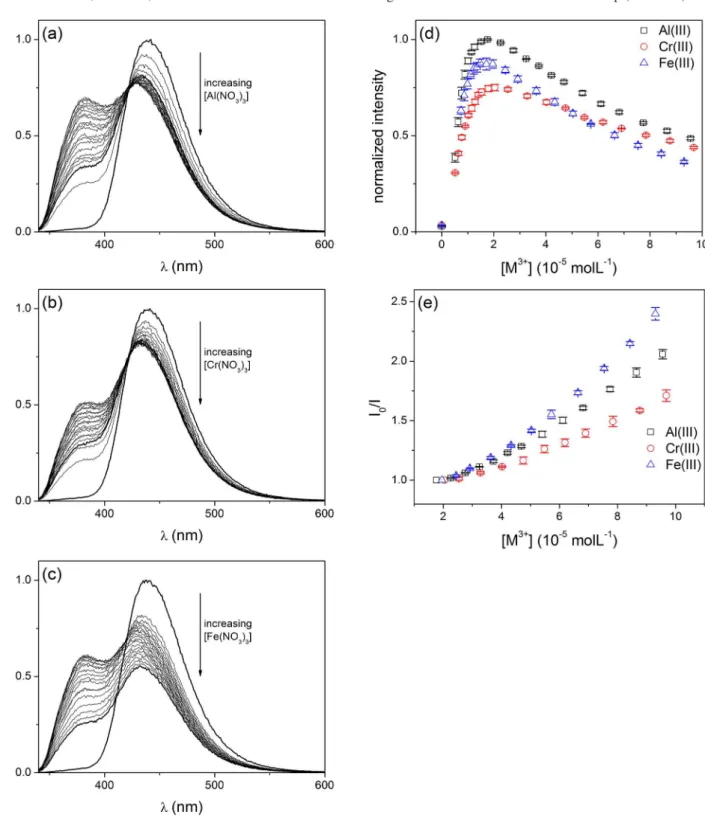
Probe 1 presented a very similar response upon addition of Al3+, Cr3+ or Fe3+ ions to its solution, namely, a marked
emission quenching at 440 nm and the appearance of a new emission band around 385 nm (Figures 5a-5c). As performed for Cu2+, we have determined the LOD values for
Al3+, Cr3+ and Fe3+, which are 1.07, 3.21 and 3.50 µmol L–1,
respectively. The fluorescence sensor reported in this study exhibited a higher sensitivity for the detection of Fe3+
when compared to the previously studied compound 2
(LOD = 11.0µmol L–1).13 Near 385 nm, the observed rise in
emission intensity with increasing metallic ion concentration can be attributed to the augmentation of the locked-enol tautomer concentration.13 The fluorescence emission of
such enolic species increases until it reaches a maximum value for a given concentration of cation, which is similar amid the three trivalent ions: 18, 20 and 20 µmol L-1 for Al3+,
Cr3+ and Fe3+, respectively (Figure 5d). A further increase in
concentration promotes a decrease on the emission intensity near 385 nm, suggesting that the locked-enol tautomer suffers from a dynamic quenching by the cation (Figure 5d). This is observable only above a certain cation concentration once that, until that point, the added metallic ion is involved mainly on the formation of the fluorescent locked-enol tautomer, and not on its quenching, which is prominent only at higher concentrations. We were able to determine the Stern-Volmer constant (KSV) values for the Al3+, Cr3+ and Fe3+ ions for the
fluorescence quenching near 385 nm (Figure 5e, Table 1),
Scheme 2. Formation of the so-called locked-enol tautomer due to coordination of 1 with a generic metallic cation Mn+ (adapted from
reference 13).
Figure 3. Effect of Cu2+ concentration (4.2 × 10⁻⁷ to 1.4 × 10⁻⁵ mol L–1) on
the fluorescence emission profile of 1 (λex = 310 nm) (a), which showed a linear decrease on the 440 nm maximum with increasing concentration of the metallic ion (b).
on the cation concentration interval where it was observed (above 20 µmol L–1).
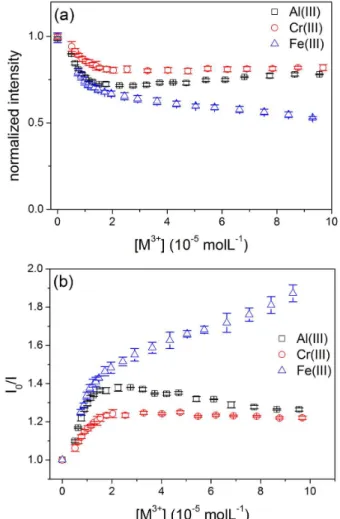
As shown in Figure 6a, the addition of Fe3+ decreases
the emission intensity at 440 nm at the entire concentration range. This quenching at 440 nm was also observed with Al3+ and Cr3+ ions, however, this effect is not observed at
concentrations higher than 15 and 18 µmol L–1, respectively
(Figure 6a). For a cation concentration of up to 15 µmol L–1,
where suppression is observed for the three trivalent ions, the Stern-Volmer constant (KSV) values at 440 nm were
determined (Figure 6b, Table 2), all at the 104 L mol–1 order of
magnitude. A reasonable linear relationship (r = 0.990) was
Figure 5. Effect of the (a) Al3+ (5.1 × 10⁻⁶ to 9.6 × 10⁻⁵ mol L–1); (b) Cr3+ (5.1 × 10⁻⁶ to 9.7 × 10⁻⁵ mol L–1) and (c) Fe3+ (7.4 × 10⁻⁶ to 9.3 × 10⁻⁵ mol L–1)
concentrations on the fluorescence emission profile of 1 (λex = 310 nm); (d) fluorescence emission intensity vs. [M3+] at 382, 385 and 381 nm; (e) Stern-Volmer
also observed for the 2.9 to 9.3 × 10⁻⁵ mol L–1 concentration
range of Fe3+, furnishing a second Stern-Volmer constant
value of KSV = (4.70 ± 0.20) × 103 L mol–1. It is not clear as
to why there is an apparent second KSV constant at higher
Fe3+ concentrations, since the Stern-Volmer profile of
combined static and dynamic quenching usually shows an upward curvature, as seen for the enol tautomer quenching at 385 nm (Figure 5e), since these processes occur concurrently and not sequentially. When quenching occurs only by one of these mechanisms, straight-line Stern-Volmer plots are observed with the emission intensity dependence with ion concentration.28 Thus, to the best of our knowledge, it could
be inferred that the emission suppression of the locked-enol tautomer (at 385 nm, Figure 5e) does actually occur by a combination of static and dynamic quenching, whilst the emission suppression of the keto tautomer (at 440 nm, Figure 6b) occurs by an unusual static-like process. This is referred to as “static-like”, since a formal static quenching would produce a non-fluorescent complex, which is not the case here, since the complex being generated is the fluorescent locked-enol tautomer.
Thus, the emission suppression observed at 440 nm shows a straight-line Stern-Volmer plot due to the formation of the locked-enol tautomer, and the concentration region where the phenomenon is observed further justifies this hypothesis: suppression of the emission at 440 nm occurs for the three trivalent cations for concentrations of up to 15 µmol L–1
of the metal ion, which is close to the concentration range where the emission of the locked-enol tautomer at 385 nm stops to rise, since this emission band is associated to its formation, and starts to be suppressed by the cation itself (Figure 5d). Therefore, the fluorescence behavior of probe 1
in the presence of the trivalent cations Al3+, Cr3+ and Fe3+ can
be summarized as follows. From zero to 15-20 µmol L–1 of
cation the emission intensity in 440 nm decreases (Figure 6a) due to formation of the locked-enol tautomer, following a static-like quenching process (KSV approx. 104 L mol–1,
Table 2) that induces the appearance and increase of an emission signal around 385 nm (Figure 5d). For cations concentrations above 15-20 µmol L–1, the locked-enol
tautomer emission starts to be suppressed by a combination of static and collisional quenching, as evidenced by the shape of the Stern-Volmer plots around 385 nm (Figure 5e). When the concentration of Al3+ and Cr3+ is above 15 and
18 µmol L–1, respectively, there is no further suppression of
the keto tautomer emission at 440 nm (Figure 6a). However, with Fe3+, a second dynamic quenching process (K
SV approx.
103 L mol−1) further suppresses the fluorescence emission of
the keto tautomer (Figure 6b). We have previously observed that the suppression of the keto tautomer emission of compound 2 occurs only with Fe3+, and not with Al3+ or Cr3+,13
showing that this metallic cation, in particular, has a higher potential to interact with probes based on an imidazolyl-phenolic system, such as 1 and 2.
Interaction of imidazolyl-phenolic systems 1 and 2 with metallic cations
It is interesting to perform a more direct comparison between data obtained for the fluorescent sensors 1 and,
Table 1. Stern-Volmer data for the quenching near 385 nm, for the interaction of 1 with different metallic cations
Metallic ion KSV /
(104 L mol–1)
[M3+] maxa /
(10–5 mol L–1) r
Al3+ 1.09 ± 0.05 4.7 0.990
Cr3+ 0.95 ± 0.03 8.8 0.990
Fe3+ 1.40 ± 0.05 5.0 0.994
a[M3+]
max is the maximum metallic ion concentration featuring in the linear
Stern-Volmer treatment.
Figure 6. (a) Fluorescence emission intensity vs. [M3+] at 440 nm; (b)
from our previous work, 2.13 The substitution of hydrogen
by the tert-butyl group significantly decreases the sensitivity of the system for detection of Cu2+, Al3+, Cr3+
and Fe3+ ions in the studied CH
3CN/H2O (95:5, v/v) media,
as seen for the overall decrease in KSV and increase in LOD
values obtained with sensor 2.13 For instance, regarding 1
and 2, respectively, for the interaction with Cu2+ we have
obtained KSV = 1.90 × 10⁵ and 8.02 × 10⁴ L mol–1, and
LOD = 0.24 and 0.86 µmol L–1. As anticipated, this effect
may be associated with the fluorescence quantum yield of these sensors. Compared to 2 (ΦFL = 0.013), the absence of a free rotor effect on fluorescent sensor 1 (ΦFL = 0.350) significantly increases the fluorescence emission of the ketonic species, with direct consequences to the KSV value
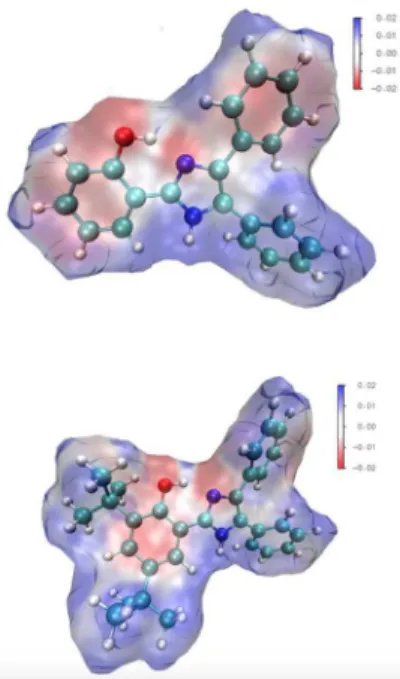
associated to the probe. Additionally, sensor 2 owns a bulky tert-butyl group in ortho with respect to the hydroxyl group, which may result in increased steric hindrance and a less-accessible coordination site for the cation, hampering the formation of the locked-enol tautomer. Interestingly, the molecular electrostatic potential map (MEP) images obtained for probes 1 and 2 (Figure 7) imply that the oxygen atom of the OH group and the sp2 hybridized nitrogen atom
of the imidazole ring are both more nucleophilic in probe 1. The calculated charges (Table S1) at the oxygen atom of the OH group are –0.564 and –0.439, respectively, for probes 1
and 2; likewise, at the mentioned imidazole N atom, charges are –0.529 and –0.512 for probes 1 and 2. Thus, with an overall more nucleophilic coordination site, probe 1 is more likely to interact with electrophilic cationic species, contributing to the formation of the locked-enol tautomer, which may reflect in higher KSV and lower LOD values.
Conclusions
The absorption and emission properties of the fluorescent sensor 1 can be rationalized in terms of an excited state intramolecular proton transfer (ESIPT), responsible for the observed large Stokes shift of 122 nm (8719 cm–1). The absorption and emission bands at 318 and
440 nm are, respectively, attributed to the enolic and ketonic
tautomers of the molecule, the latter being generated through the ESIPT process. The addition of Ca2+, Co2+,
Ni2+, Zn2+ or Ba2+ ions did not modify the free fluorescent
sensor emission spectrum profile, but the addition of Cu2+,
Al3+, Cr3+ and Fe3+ quenched the emission at 440 nm and,
for the trivalent cations, a new emission band near 385 nm was observed. At 440 nm, the obtained KSV and LOD
values were, respectively: for Cu2+, 1.90 × 10⁵ L mol–1 and
0.24 µmol L–1; for Al3+, 3.00 × 10⁴ L mol–1 and 1.07 µmol L–1;
for Cr3+, 1.52 × 10⁴ L mol–1 and 3.21 µmol L–1; for Fe3+,
2.40 × 10⁴ and 3.5 µmol L–1; such data indicate a greater
sensitivity of the fluorescent probe towards Cu2+ ions. The
signal near 385 nm was attributed to the formation of a locked-enol tautomer, between probe 1 and the cation. This coordinated species also suffers a collisional quenching due to interaction with metallic ions in solution, as evidenced for higher concentrations of the cations. When compared to imidazolyl-phenolic probe 2, it was rationalized that the higher sensitivity of probe 1 towards metallic ions can be attributed to a combination of fluorescent, steric and electronic factors. Even though these probes can be used to detect Cu2+, Al3+, Cr3+ and Fe3+ in the studied
CH3CN/H2O (95:5, v/v) system, their insolubility in water
prevents the use in real water samples, for the detection of metallic ions as contaminants, for example. Nevertheless, one can resort to the introduction of a water-soluble group in the chemosensor structure, such as a carboxylic acid,7,29
to enable the water-solubility of the imidazolyl-phenolic framework, showing the potential use of such compounds for analytical purposes in environmental analysis.
Table 2. Stern-Volmer data for the quenching at 440 nm, for the interaction of 1 with different metallic cations
Metallic ion KSV /
(104 L mol–1)
[M3+] maxa /
(10–5 mol L–1)
r
Al3+ 3.00 ± 0.30 1.3 0.958
Cr3+ 1.52 ± 0.09 1.5 0.969
Fe3+ 2.40 ± 0.20 1.5 0.963
a[M3+]
max is the maximum metallic ion concentration featuring in the linear
Stern-Volmer treatment.
Figure 7. MEP images obtained in vacuo for fluorescent probes 1 (top) and
Supplementary Information
Supplementary information (MS, IR and NMR spectra for the characterization of probe 1, fluorescence spectra for the addition of Ca2+, Co2+, Ni2+, Zn2+ or Ba2+, calculated
charges for the MEP maps) is available free of charge at http://jbcs.sbq.org.br as PDF file.
Acknowledgments
The authors thank the Fundação de Amparo à Pesquisa do Estado de São Paulo (FAPESP, RBOJr 2014/05813-2, FHB 2012/13807-7), Conselho Nacional de Desenvolvimento Científico e Tecnológico (CNPq, PHM 310669/2013-8 and 448125/2014-5) and Coordenação de Aperfeiçoamento de Pessoal de Nível Superior (Capes, FC) for financial support.
References
1. Wang, D. H.; Zhang, Y.; Sun, R.; Zhao, D. Z.; RSC Adv. 2016,
6, 4640.
2. Kundu, A.; Hariharan, P. S.; Prabakaran, K.; Anthony, S. P.;
Spectrochim. Acta, Part A 2015, 151, 426.
3. Gu, Z. Y.; Lei, W.; Shi, W. Y.; Hao, Q. L.; Si, W. M.; Xia, X. F.; Wang, F. X.; Spectrochim. Acta, Part A 2014, 132, 361. 4. Xu, Z. C.; Yoon, J.; Spring, D. R.; Chem. Soc. Rev. 2010, 39,
1996.
5. Formica, M.; Fusi, V.; Giorgi, L.; Micheloni, M.; Coord. Chem. Rev. 2012, 256, 170.
6. Hao, E. H.; Meng, T.; Zhang, M.; Pang, W. D.; Zhou, Y. Y.; Jiao, L. J.; J. Phys. Chem. A 2011, 115, 8234.
7. Henary, M. M.; Fahrni, C. J.; J. Phys. Chem. A 2002, 106, 5210. 8. Kim, Y. S.; Lee, J. J.; Lee, S. Y.; Kim, P.-G.; Kim, C.; J. Fluoresc.
2016, 26, 835.
9. Lin, H.-Y.; Cheng, P.-Y.; Wan, C.-F.; Wu, A.-T.; Analyst 2012,
137, 4415.
10. Wang, J.; Pang, Y.; RSC Adv. 2014, 4, 5845.
11. Iniya, M.; Jeyanthi, D.; Krishnaveni, K.; Mahesh, A.; Chellappa, D.; Spectrochim. Acta, Part A 2014, 120, 40.
12. Qin, J. C.; Yang, Z. Y.; Yang, P.; Inorg. Chim. Acta 2015, 432, 136.
13. Orfão Jr, R. B.; Alves, J.; Bartoloni, F. H.; J. Fluoresc. 2016,
26, 1373.
14. Eseola, A. O.; Li, W.; Gao, R.; Zhang, M.; Hao, X.; Liang, T.; Obi-Egbedi, N. O.; Sun, W.-H.; Inorg. Chem. 2009, 48, 9133. 15. Wu, J. S.; Liu, W. M.; Ge, J. C.; Zhang, H. Y.; Wang, P. F.;
Chem. Soc. Rev. 2011, 40, 3483.
16. Anslyn, E. V.; Dougherty, D. A.; Modern Physical Organic
Chemistry; University Science Books: Sausalito, 2006. 17. Buchholz, A.; Eseola, A. O.; Plass, W.; C. R. Chim. 2012, 15,
929.
18. Jayabharathi, J.; Thanikachalam, V.; Srinivasan, N.; Jayamorthy, K.; Perumal, M. V.; J. Fluoresc. 2011, 21, 1813.
19. Kalyanasundaram, K.; J. Chem. Soc., Perkin Trans. 2 1986, 82, 2401.
20. Benisvy, L.; Blake, A. J.; Collison, D.; Davies, E. S.; Garner, C. D.; McInnes, E. J. L.; McMaster, J.; Whittaker, G.; Wilson, C.; Chem. Commun. 2001, 1824.
21. Frisch, M. J.; Trucks, G. W.; Schlegel, H. B.; G. E. Scuseria; Robb, M. A.; Cheeseman, J. R.; Scalmani, G.; Barone, V.; Mennucci, B.; Petersson, G. A.; Nakatsuji, H.; Caricato, M.; Li, X.; Hratchian, H. P.; Izmaylov, A. F.; Bloino, J.; Zheng, G.; Sonnenberg, J. L.; Hada, M.; Ehara, M.; Toyota, K.; Fukuda, R.; Hasegawa, J.; Ishida, M.; Nakajima, T.; Honda, Y.; Kitao, O.; Nakai, H.; Vreven, T.; Montgomery, J. A.; Peralta, J. E.; Ogliaro, F.; Bearpark, M.; Heyd, J. J.; Brothers, E.; Kudin, K. N.; Staroverov, V. N.; Kobayashi, R.; Normand, J.; Raghavachari, K.; Rendell, A.; Burant, J. C.; Iyengar, S. S.; Tomasi, J.; Cossi, M.; Rega, N.; Millam, N. J.; Klene, M.; Knox, J. E.; Cross, J. B.; Bakken, V.; Adamo, C.; Jaramillo, J.; Gomperts, R.; Stratmann, R. E.; Yazyev, O.; Austin, A. J.; Cammi, R.; Pomelli, C.; Ochterski, J. W.; Martin, R. L.; Morokuma, K.; Zakrzewski, V. G.; Voth, G. A.; Salvador, P.; Dannenberg, J. J.; Dapprich, S.; Daniels, A. D.; Farkas, Ö.; Foresman, J. B.; Ortiz, J. V.; Cioslowski, J.; Fox, D. J.; Gaussian 09, Revision A.1., 2009. 22. Kim, Y. H.; Roh, S. G.; Jung, S. D.; Chung, M. A.; Kim, H. K.;
Cho, D. W.; Photochem. Photobiol. Sci. 2010, 9, 722. 23. Deshmukh, M. S.; Sekar, N.; Spectrochim. Acta, Part A 2015,
135, 457.
24. Taki, M.; Wolford, J. L.; O’Halloran, T. V.; J. Am. Chem. Soc.
2004, 126, 712.
25. Rodembusch, F. S.; Brand, F. R.; Correa, D. S.; Pocos, J. C.; Martinelli, M.; Stefani, V.; Mater. Chem. Phys. 2005, 92, 389. 26. Weerasinghe, A. J.; Abebe, F. A.; Sinn, E.; Tetrahedron Lett.
2011, 52, 5648.
27. Hsieh, Y. C.; Chir, J. L.; Yang, S. T.; Chen, S. J.; Hu, C. H.; Wu, A. T.; Carbohydr. Res. 2011, 346, 978.
28. Lakowicz, J. R.; Principles of Fluorescence Spectroscopy, 3rd ed.; Springer: New York, 2009.
29. Henary, M. M.; Wu, Y. G.; Fahrni, C. J.; Chem.-Eur. J. 2004,
10, 3015.
Submitted: December 2, 2016