Article
J. Braz. Chem. Soc., Vol. 23, No. 11, 2035-2042, 2012. Printed in Brazil - ©2012 Sociedade Brasileira de Química 0103 - 5053 $6.00+0.00
A
*e-mail: [email protected]
Prediction of Microdialysis Relative Recovery of Flavone Derivatives
Based on Molecular Descriptors
Shuyu Zhan, Jianping Huang, Qing Shao,* Xiaohui Fan and Wenjing Guo
Pharmaceutical Informatics Institute, Zhejiang University, Hangzhou, 310027, P. R. China
Recuperação relativa (Re) é uma das principais preocupações de microdiálise, uma técnica
de amostragem acessível que pode coletar continuamente drogas livres no sangue e na maioria dos tecidos. Para uma determinada sonda de microdiálise, a recuperação de cada composto desta sonda está relacionada às características estruturais e propriedades físico-químicas se as condições experimentais estão estabelecidas. Neste trabalho, modelos de relação quantitativa estrutura-propriedade (QSPR) utilizando os métodos de regressão linear múltipla (MLR) e máquina de vetores de suporte (SVM) foram ajustados com o intuito de destrinchar relações de Re de
microdiálise de compostos e seus descritores moleculares que capturam as características estruturais moleculares para uma série de derivados da flavona. Como resultado, parâmetros estatísticos significativos (modelo MLR: R2 = 0,9268 (coeficiente de correlação), Q2
LOO = 0,8572 (variância
explicada prevista) e Q2
ext = 0,8639 (variância explicada externa), e modelo SVM: R
2 = 0,9383
e Q2
ext = 0,8536) foram obtidos, indicando boa estabilidade e habilidade preditiva dos modelos.
Assim, tornando viável prever as recuperações relativas na microdiálise de alguns compostos a partir de seus descritores moleculares. Este estudo foi uma tentativa inovadora e pode fornecer novos métodos para pesquisar a recuperação de microdiálise dos compostos.
Relative recovery (Re) is one of the major concerns of microdialysis, a valuable sampling
technique which can continuously collect unbound drugs in blood and most tissues. For a given microdialysis probe, the recovery of every compound from the probe is related to its structural characteristics and physicochemical property if the experiment condition is fixed. In this work, quantitative structure-property relationship (QSPR) models using multiple linear regression (MLR) and support vector machine (SVM) methods were setup to excavate the relationships of microdialysis Re of compounds and their molecular descriptors which capture the structural
characteristics of molecules for a series of flavone derivatives. As result, significant statistical parameters (MLR model: R2 = 0.9268 (correlation coefficient), Q2
LOO = 0.8572 (explained variance
in prediction) and Q2
ext = 0.8639 (external explained variance), and SVM model: R
2 = 0.9383 and
Q2
ext = 0.8536) were obtained, indicating good stability and predictive ability of the models.
Therefore, it seems feasible to predict the microdialysis relative recovery of some compounds from their molecular descriptors. This investigation was an innovative trial and can provide new methods for researching the microdialysis recovery of the compounds.
Keywords: quantitative structure-property relationship (QSPR), microdialysis, relative recovery, multiple linear regression, support vector machine, flavone derivatives
Introduction
Microdialysis is a valuable sampling technique which can continuously collect unbound drugs in blood and most tissues. In recent years, it has been widely used in pharmacokinetics, pharmacodynamics, toxicology and clinical disease monitoring.1-3 Comparing with traditional sampling technology, the advantage of microdialysis
individual differences and reduce the number of animals sacrificed, this makes microdialysis a potential tool for pharmacokinetics and pharmacodynamics studies.
The microdialysis technology uses the perfusate fluid to perfuse a microdialysis probe implanted in the tissue of interest, with a dialysis membrane at the probe tip. Due to the concentration gradient, the compounds can diffuse through the membrane between the probe and tissue. As the movement of analytes between the tissue and perfusate occurs under non-equilibrium conditions, only a fraction of analyte concentration can be found in the microdialysate samples. The ratio of the concentration of analyte in microdialysate samples relative to the medium surrounding
the probe is termed the recovery.4 One of the major
concerns of the microdialysis technique is the accurate determination of the recovery of the analyte of interest from the microdialysis probe. In a microdialysis experiment for pharmacokinetics, the recovery of the analyte of interest must be determined before or after the experiment, which is labor exhaustive and time-consuming. The recovery is influenced by many experimental factors such as recovery methods, the probe used (type of membrane, length and diameter of membrane), perfusate flow rate, composition of perfusate fluid, temperature and so on. In fact, for a given probe, it is obvious that the recovery of every compound is determined by its physicochemical property if the experiment condition is also fixed. Bungay et al.5 developed a mathematical framework utilizing the mass transfer resistance to describe the dialysate extraction
fraction (Ed) which was equal to the relative recovery
at steady-state. In the framework, Ed of the analyte was
determined by Qd (describing the perfusate flow rate), the
mass transfer resistance of dialysate (Rd) and membrane
(Rm) in a well stirred solution in vitro. For a given probe, when Qd was fixed, the mass transfer resistances (Rd and Rm) were related to the diffusion coefficient of the analyte in the dialysate (Dd) and in the membrane (Dm). Both the diffusion coefficient (Dd and Dm) can often be estimated through given knowledge of key physical properties, such as molecular weight, shape and charge for the chemical species of interest. Helmy et al.6 determined the relative
recovery for 12 cytokines in vitro and found relative
recovery was related to apparent molecular weight of cytokine and isoelectric point (pI), a surrogate marker
of hydrophilicity. Wang et al.7 studied macromolecules
fluorescein isothiocyanatelabeled dextrans (FITC-dextrans) with molecular weight between 10 and 70 kDa using microdialysis sampling in both well-stirred and quiescent phosphate-buffered saline solutions as well as in a 0.3% agar solution. They found the decrease in the relative recovery was related to the increase in the molecular
weight for each of the FITC-dextrans. Moreover, based on Bungay et al.5 mass transfer model, the main principle for the larger macromolecules was that the membrane provided a significant mass transport resistance most likely caused by hindering diffusion, which resulted in lower recovery values. These researches indicated when the experiment condition was controlled, the microdialysis recovery value of a new compound was mainly determined by its physicochemical property, which is ascribed to its structural feature.
The aim of this study was to setup QSPR (quantitative structure-property relationship) models, indicating the relationship of structural characteristics and physicochemical property with the microdialysis recovery of compounds. Therefore, models that can be used to predict the recovery of the new compound by utilizing its structural characteristics were developed. In this research, recovery values of 24 different flavone derivatives through microdialysis experiments were obtained, and hundreds of the molecular descriptors characterizing molecular structure were calculated by Dragon 5.4 software. Support vector machine (SVM) based on nonlinear classification techniques and multiple linear regression (MLR) based on linear model method were employed to extract relationships between molecular descriptors and recovery respectively. This exploration was an innovative trial and may provide the new methods for researching the microdialysis recovery of compounds.
Experimental
Drugs and reagents
Twenty four different flavone derivatives were purchased from National Institutes for Food and Drug Control (NIFDC, P. R. China). HPLC-grade acetonitrile was from Merck (Darmastadt, Germany). All other reagents and chemicals were of analytical grade. Triple deionized water for all preparations was obtained by the Milli-Q system.
Analytical techniques
Drug concentration in microdialysate samples was determined by HPLC (high performance liquid chromatography). The HPLC system consisted of a quaternary pump, an online vacuum degasser, an autosampler and a thermostated column compartment. A variable-wavelength UV-Vis detector was used for the chromatographic analysis. The separation was performed on a Zorbax XDB C8 analytical column (4.6 × 150 mm, 5 µm; Agilent, USA). The mobile phase consisted of 0.05%
according to the need of chromatographic resolution. The flow rate was maintained at 0.8 ml min-1 and the detection was performed at the specified UV wavelength according to maximum UV absorption of every drug under a constant temperature of 30 °C.
Microdialysis system
The microdialysis system consisted of a syringe infusion pump (CMA/400) with a microlitre syringe that was used to provide the perfusate solution. The syringe was connected to a probe with fused-silica tubes. The sample was collected with 820 microsampler (CMA, Stockholm, Sweden). The probe used in this study was commercially available microdialysis probes (MAB 7 Microdialysis Probes, CMA, Stockholm, Sweden) with the molecular weight cut off of 15 kDa.
Microdialysis experiments
The probe was placed in a 10 ml beaker containing the
drug dissolved in Ringer’s solution (155 mmol L-1 NaCl,
5.5 mmol L-1 KCl and 2.3 mmol L-1 CaCl
2). The dialysis medium in the beaker was magnetically stirred by a stirrer at the stir rate of 200 rpm and the temperature of which was kept at 37 oC by a circulation water bath of constant temperature. After perfusing with the drug-free Ringer’s solution at the flow rate of 2.0 µL min-1 for an equilibration
period of 60 min, six samples of dialysate (Coutlet) were
collected at 15 min intervals, and then the dialysate was directly determined by HPLC. Before and after each collection period, the concentration of solution in the beaker was determined respectively and their mean value was obtained as the concentration of drug in ECF (C∞ECF). The relative recovery (Re) was calculated as follows:
(1)
For 24 flavone derivatives, the experiment condition remained unchanged. Every drug experiment was repeated twice and the mean value of the two recoveries was used as ultimate recovery of the drug. In order to dismiss the individual differences of the probes, the same probe was used for microdialysis sampling of the 24 compounds. The stability of the probe was tested after several times of experiments using an identical drug to guarantee that the probe was stable and the different recovery values of the various drugs was not owing to the probe itself.
Prior to starting the studies, the perfusate fluid Ringer’s solution and the drug Ringer’s solution were all filtered
through 0.45 µm membrane filters and then degassed by vacuum. When a drug sampling was finished, the probe was perfused with Ringer’s solution at a flow rate of 6 µL min-1 for 1 h in order to avoid the interference of previous substance adsorption onto the walls in the final results.
Data grouping
The recovery values of 24 flavone derivatives were all
obtained from our own microdialysis experiments in vitro.
Their chemical structure and microdialysis recovery (Re)
were listed in Table 1. For the data set of 24 compounds, 4 compounds were randomly assigned as test set, and the remaining 20 compounds were used for training set.
Calculation of molecular descriptors
The molecular descriptors of all compounds were calculated with Dragon5.4 software categorized by twenty blocks of molecular descriptors.8 In this research, only 929 descriptors contained in blocks 1-10, 17-20 were calculated, with all 3D descriptors excluded. These descriptors consisted of constitutional descriptors, topological descriptors, walk and path counts, connectivity indices, information indices, 2D autocorrelations, edge adjacency indices, BCUT descriptors, topological charge indices, eigenvalue-based indices, functional group counts, atom-centered fragments, charge descriptors and molecular properties.
Preprocessing of molecular descriptors
In order to delete the noisy, irrelevant and redundant information, the calculated 929 molecular descriptors
were preprocessed by eliminating: (i) those having the
same values for greater than 90% of the compounds, and (ii) those having high correlation coefficients (> 0.90) with other descriptors. After the preprocessing, 148 molecular descriptors remained.
Multiple linear regression (MLR) model approach
MLR, based on linear least square method, is a common multiple statistic method which setup linear model through the statistical study of quantitative relation between input data and output data. The statistical quality
was judged by squared correlation coefficient (R2),
standard error of the estimate (S2) and Fisher statistic
(F values) of the model.
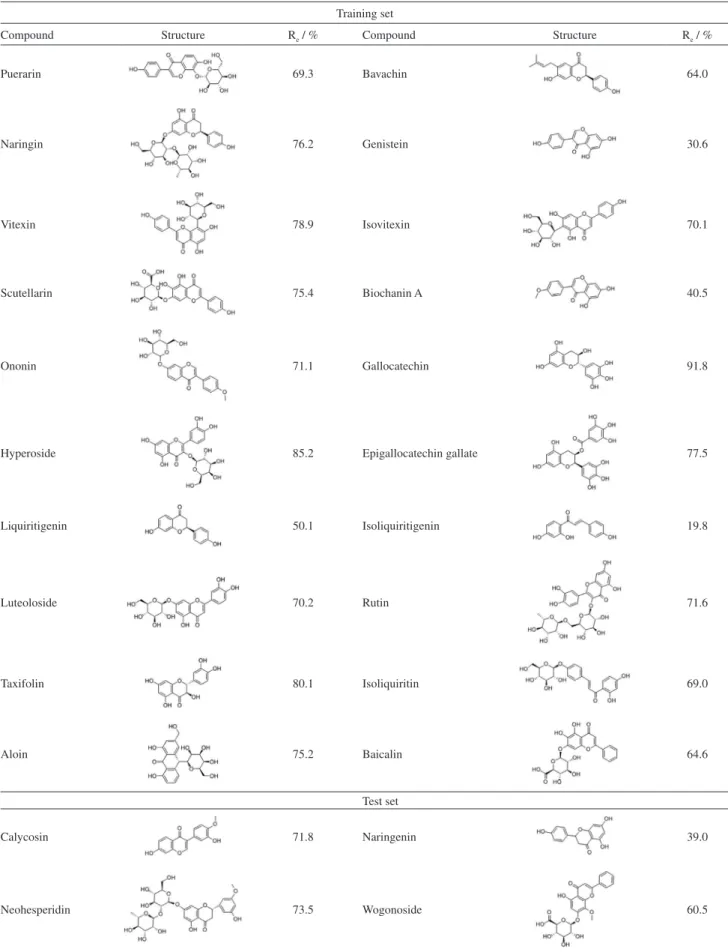
Table 1. Chemical structure and microdialysis recovery (Re, %) of flavone and their derivatives employed in multiple linear regression (MLR) and support vector machine (SVM) model developments
Training set
Compound Structure Re / % Compound Structure Re / %
Puerarin 69.3 Bavachin 64.0
Naringin 76.2 Genistein 30.6
Vitexin 78.9 Isovitexin 70.1
Scutellarin 75.4 Biochanin A 40.5
Ononin 71.1 Gallocatechin 91.8
Hyperoside 85.2 Epigallocatechin gallate 77.5
Liquiritigenin 50.1 Isoliquiritigenin 19.8
Luteoloside 70.2 Rutin 71.6
Taxifolin 80.1 Isoliquiritin 69.0
Aloin 75.2 Baicalin 64.6
Test set
Calycosin 71.8 Naringenin 39.0
Firstly, a non-co-linearity criterion (R2 < 0.6) was used to discard the little correlation descriptors from 148 descriptors. Then single descriptor was gradually added to build the MLR model. The break point technique was used to control the model expansion in the improvement
of the statistical quality of the model.9 The break point
was found by analyzing the relationship of the number of descriptors involved in a generated model versus the value of the correlation coefficient R2 corresponding to the model. The optimum number of descriptors for the MLR model was determined as the number of descriptors corresponding to the break point. If the difference between R2 of the two consequent regression equations was less than or equal to 0.02 after obtaining a certain number of descriptors selected for the model (the break point), then no statistical improvement of the regression model was demonstrated.
Support vector machine (SVM) model approach
SVM is an emerging and powerful machine learning algorithm proposed by Vapnik et al.10 in 1995. It has been extensively applied to various classification problems due to its high accuracy and its lesser proneness to overfitting than other machine learning methods. Instead of traditional empirical risk minimization, SVM achieves structural risk minimization, which results in the good generalization and avoids being trapped in local optima.
In this study, the Java package of LIBSVM (version 2.8), a free support vector machine tool, was used to setup the reasonable nonlinear QSPR model. Meanwhile, radial basis function (RBF) as kernel was adopted, and the cost C and parameter γ were tuned by a grid search on [10-3, 10-2, …, 102] and [10-5, 10-4, …, 10], evaluated using a nested 5-fold cross-validation on the training set. These programs were running under a Java™ SE Runtime Environment (build 1.6.0_11-b03).
Validation of the models
To test the stability and the prediction ability of the MLR model, leave-one-out (LOO) cross validation and test set of 4 compounds for external validation were carried out against the models. The results of model validation
were judged by Q2
LOO (explained variance in prediction)
for LOO cross validation and Q2
ext for external validation. Moreover, two important statistic parameters of root mean square error (RMSE) and mean absolute error (MAE) were used in our research to evaluate estimation and prediction ability of the models (Table 2).
For the SVM model, after the best SVM parameters, C and ã were selected with nested 5-fold cross-validation, they were employed to build the final model using training set. Then, the final model was used to predict the training set and test set respectively. The performance metrics of
R2 was measured by the following formula:
R2 = 1
−∑(Y − Ypred) 2/ ∑(Y
− <Y>)2 (2)
Here, R2 represented the prediction results for the
training set and test set using the final model.
Results
Results of MLR
Through MLR analysis, five out of 148 molecular descriptors (listed in Table 3) were selected for the best model. The quantitative correlation of microdialysis recovery with descriptors generated the following equation (equation 3):
Re = –16.9044 Hypnotic-50 – 63.8568 MATS4m
– 188.2666 PCR – 36.0726 EEig03d
+ 52.99 EEig02x + 225.5174 (3)
n = 20, R2 = 0.9268, F = 35.470, S2 = 5.6984
where n was the number of compounds, R was the correlation coefficient, S was the standard deviation and
F was the Fisher F-statistic. Equation 3 displayed obvious statistical significance. The recovery of compounds was negative correlated with the descriptors of Hypnotic-50, MATS4m, PCR and EEig03d, and was positive correlated with the descriptor of EEig02x.
The predicted Re values for the training set and test set from equation 3 were presented in Table 4 and the
experimental and predicted Re values were plotted in
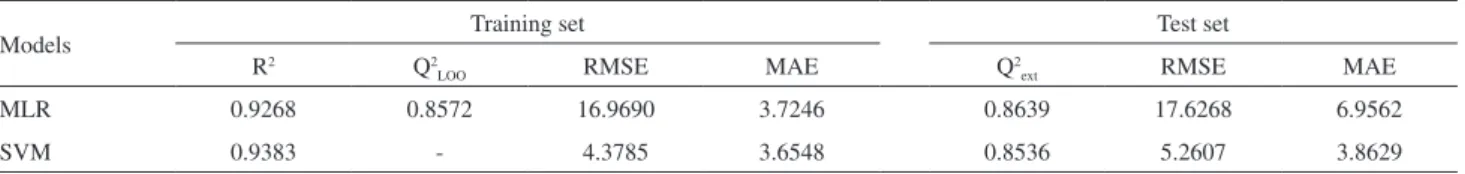
Table 2. Significant statistical parameters obtained by multiple linear regression (MLR) and support vector machine (SVM) models
Models Training set Test set
R2 Q2
LOO RMSE MAE Q2ext RMSE MAE
MLR 0.9268 0.8572 16.9690 3.7246 0.8639 17.6268 6.9562
SVM 0.9383 - 4.3785 3.6548 0.8536 5.2607 3.8629
Figure 1. The main statistic parameters of the model were presented in Table 2. The result of QSPR model based on MLR indicated the model had good stability and predictive ability.
Results of SVM
For the SVM model, RBF kernel was used, and the best parameter C and ã were selected based on the maximum R2 value obtained by the nested 5-fold cross-validation of the training set. Thus, the final SVM model was trained using these best parameters, and was used to predict the
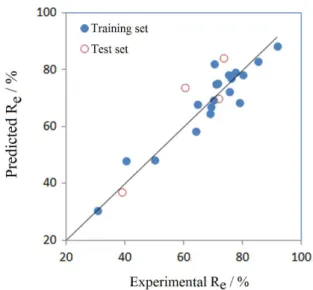
training set and test set. The predicted Re values for the training set and test set from SVM model were presented
in Table 4 and the experimental and predicted Re values
were plotted in Figure 2. The main statistic parameters of the model were presented in Table 2. The result of QSPR
Table 3. Five most important molecular descriptors selected for multiple linear regression (MLR) and support vector machine (SVM) models of the data set
Descriptor symbol Descriptor block Definition
Hypnotic-50 molecular properties Ghose-Viswanadhan-Wendoloski hypnotic-like index at 50%
MATS4m 2D autocorrelations Moran autocorrelation-lag 4/weighted by atomic masses
PCR walk and path counts ratio of multiple path count over path count
EEig03d edge adjacency indices eigenvalue 03 from edge adj. matrix weighted by dipole moments
EEig02x edge adjacency indices eigenvalue 02 from edge adj. matrix weighted by edge degrees
Table 4. The investigated compounds and their experimental and predicted recovery (Re, %) by multiple linear regression (MLR) and support vector machine (SVM) models
No. Compound Re / %
Experimental MLR SVM
1 puerarin 69.32 66.97 72.50
2 naringin 76.17 76.87 72.99
3 vitexin 78.89 68.45 69.19
4 scutellarin 75.41 72.21 73.78
5 ononin 71.07 75.01 71.86
6 hyperoside 85.18 82.90 82.00
7 liquiritigenin 50.05 48.14 46.87
8 luteoloside 70.24 82.07 78.02
9 taxifolin 80.08 78.07 77.71
10 aloin 75.15 78.22 78.33
11 bavachin 64.01 58.22 60.83
12 genistein 30.56 30.35 30.30
13 isovitexin 70.14 69.16 70.38
14 biochanin A 40.45 47.83 43.98
15 gallocatechin 91.76 88.17 84.53 16 epigallocatechin gallate 77.46 78.89 80.64 17 isoliquiritigenin 19.79 21.91 22.97
18 rutin 71.60 75.12 74.78
19 isoliquiritin 69.01 64.52 64.97
20 baicalin 64.63 67.89 71.54
21a calycosin 71.82 69.75 71.59
22a neohesperidin 73.46 83.96 75.84
23a naringenin 39.01 36.86 42.07
24a wogonoside 60.47 73.57 70.25
aCompounds making up of the test set.
Figure 2. The plot of predicted vs. experimental recovery (Re, %) of 24 different flavone derivatives compounds by support vector machine (SVM) model.
model based on SVM indicated the model displayed good stability and predictive ability. The more significant statistic parameters from SVM model than MLR model demonstrated the nonlinear model had better predictive ability than the linear model, which might mean there was more nonlinear relationship between structural characteristics and the microdialysis recovery of compound.
Discussion
The crucial molecular descriptors screened for the QSPR models belonged basically to several blocks of descriptors such as molecular properties, 2D autocorrelations, walk and path counts and edge adjacency indices (seen in Table 3). The main structural information reflected by these descriptors was related to molecular polarity, size and shape. Hypnotic-50 named Ghose-Viswanadhan-Wendoloski hypnotic at 50% belonged to molecular properties. It was drug-like index, as suggested by
Ghose et al.,11 and based on computed physicochemical
property profiles such as log P, molar refractivity and molecular weight. MATS4m was from 2D autocorrelations representing Moran autocorrelation of lag 4 in the graph weighted by atomic masses, which concerned molecular size and might influence the compound diffusion across the membrane. PCR belonged to the descriptors of walk and path counts. It meant ratio of multiple path count over path
count and described the molecular shape.12 The molecular
shape had obvious effect on the diffusion of compound to the semi-permeable membrane. From the MLR model, the negative regression coefficient associated with this descriptor illustrated the lower value of PCR was beneficial for the compound diffusing across the membrane, leading to improvement of recovery. EEig03d and EEig02x were both descriptors related to molecular polarity, which mainly described the electronic effect of molecule and the hydrophobic properties. It was obvious that the molecular polarity influenced the interaction of molecule with membrane and then affected the diffusion. In our MLR model, EEig03d and EEig02x presented negative and positive regression coefficient associated with the recovery respectively, which suggested the two descriptors had opposite effect on the recovery and the recovery might have complex relationship with the molecular polarity.
Both MLR and SVM showed fairly good fitting and predictive performance, suggesting that it is feasible to predict microdialysis relative recovery of compounds from their molecular descriptors. Certainly, there are still points that needed to be addressed. For example, the number of compounds used for training and validation is limited, which may weaken the conclusion. Moreover, the
distribution of the recovery values used to build the model is not even enough (Figures 1 and 2), which may have a negative effect on the prediction power of the models. Therefore, adding more compounds and considering their distribution in chemical space and corresponding recovery values could make the illustration stronger. Although the compounds are not quite evenly distributed in terms of recovery values, the prediction results across all blocks are fairly good and stable. Over all, we do believe this study can convey the idea that microdialysis recovery can be predicted by means of QSPR modeling.
Conclusions
In this study, two classic QSPR modeling methods
of MLR and SVM were applied to in silico prediction of
microdialysis recovery of compounds. The models were validated by leave-one-out or 5-fold cross validation and then by external validation with the test set. The result demonstrated that the prediction models have good stability and predictive ability. Comparing by statistics parameters, the SVM model showed better performance than the MLR model, which meant the microdialysis recovery of the compounds might have more nonlinear relationship with the molecular descriptors. However, because the MLR model could present the relationship in a more simple way, it is more intuitive and more helpful for us to comprehend the contribution of each descriptor to the microdialysis recovery. Therefore, both MLR and SVM models had their advantages and disadvantages.
The successfully established QSPR models for predicting microdialysis relative recovery of compounds illustrated that there was relationship between microdialysis relative recovery and molecular structure characteristics of compounds, such as molecular polarity, size and shape. Thus, it was possible to predict microdialysis relative recovery of some compounds from their molecular descriptors. This research is an innovative trial and provides new ideas for exploring the microdialysis recovery of the compounds. The results and conclusions of this study are also beneficial to researchers attempting to model other interaction of compounds with the semi-permeable membrane.
Acknowledgments
References
1. Plock, N.; Kloft, C.; Eur. J. Pharm. Sci.2005, 25, 1.
2. Joukhadar, C.; Müller, M.; Clin. Pharmacokinet.2005, 44, 895. 3. Wei, Y. H.; Xu, L. Z.; Shen, Q.; Li, F. Z.; Curr. Pharm.
Biotechnol.2009, 10, 631.
4. Elmquist, W. F.; Sawchuk, R. J.; Pharm. Res.1997, 14, 267. 5. Bungay, P. M.; Morrison, P. F.; Dedrick, R. L.; Life. Sci. 1990,
46, 105.
6. Helmy, A.; Carpenter, K. L. H.; Skepper, J. N.; Kirkpatrick, P. J.;
Pickard, J. D.; Hutchinson, P. J.; J. Neurotrauma. 2009, 26, 549. 7. Wang, X. D.; Stenken, J. A.; Anal. Chem. 2006, 78, 6026.
8. Todeschini, R.; Consonni, V.; Mauri, A.; Pavan, M.; Dragon 5.4;
Milano Chemometrics and QSAR Research Group; University
of Milano- Bicocca, Milan, Italy, 2006.
9. Katritzky, A. R.; Pacureanu, L. M.; Slavov, S.; Dobchev, D. A.; Karelson, M. B.; Med. Chem. 2006, 14, 7490.
10. Vapnik, V. N.; The Nature of Statistical Learning Theory; Springer: New York, NY, USA, 1995.
11. Ghose, A. K.; Viswanadhan, V. N.; Wendoloski, J. J.; J. Comb. Chem. 1999, 1, 55.
12. Rücker, G.; Rücker, C.; J. Chem. Inform. Comput. Sci. 1993,
33, 683.
Submitted: June 2, 2012