Article
0103 - 5053 $6.00+0.00
*e-mail: [email protected]
Novel Spectrophotometric Method for the Determination of Azithromycin in
Pharmaceutical Formulations based on its Charge Transfer Reaction with
Quinalizarin
Carlos Eduardo R. de Paula, Vanessa G. K. Almeida and Ricardo J. Cassella*
Departamento de Química Analítica, Universidade Federal Fluminense, 24020-141 Niterói-RJ, Brazil
Neste trabalho é proposto um novo método para a determinação espectrofotométrica simples e rápida de azitromicina em formulações farmacêuticas. O método está baseado na reação de transferência de carga entre a azitromicina e a quinalizarina em meio de metanol. O efeito de diversas variáveis foi avaliado com o intuito de alcançar máxima sensibilidade analítica. A reação de transferência de carga foi caracterizada, sendo determinadas a estequiometria da reação, a absortividade molar aparente e a constante de associação. Melhores resultados foram obtidos em meio de metanol e com uma concentração de quinalizarina de 50 mg L-1. Nestas condições, o ânion
radicalar (produto da reação de transferência de carga) foi formado imediatamente após a mistura dos reagentes, apresentando máxima absorção em 564 nm. O método apresentou um limite de detecção de 0,35 mg L-1 e um limite de quantiicação de 1,2 mg L-1, sendo aplicado com sucesso na
determinação de azitromicina em três amostras de medicamentos comerciais contendo azitromicina.
This paper proposes a new method for simple and fast spectrophotometric determination of azithromycin in pharmaceutical formulations. The method is based on the charge transfer reaction between the azithromycin and quinalizarin in methanol medium. In order to achieve maximum sensitivity the effect of some chemical variables such as the type of solvent, reagent concentration and reaction time were evaluated. The reaction was characterized in terms of stability of the product formed and its stoichiometry, and the apparent molar absorptivity and association constant were derived. Best conditions for the analytical determination of azithromycin were observed in methanol medium with a quinalizarin concentration of 50 mg L-1. At these conditions, the radical
anion (absorbing specie) was formed in the medium immediately after mixing of the reagents and showed maximum absorption at 564 nm. The method presented a limit of detection of 0.35 mg L-1
and a limit of quantiication of 1.2 mg L-1. It was successfully applied in the determination of
azithromycin in three commercial pharmaceutical formulations of azithromycin and no matrix interferences were observed.
Keywords: charge transfer reaction, azithromycin, quinalizarin, spectrophotometry, pharmaceutical formulations
Introduction
Macrolide antibiotics are a class of compounds widely employed in human and veterinary medicine. They interfere in the synthesis of bacterial proteins resulting in a bacteriostatic effect on pathogens.1 In general, the structure of the macrolide antibiotics contains a macrocyclic lactone and a neutral sugar moiety attached to the lactone. Another important structural characteristic is the presence of other sugar moiety containing a dimethylamine group, which
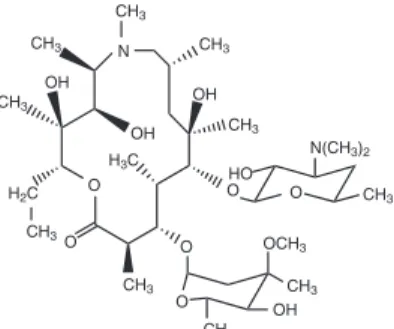
confers to the macrolides a basic behavior2 and makes them a potential n-electron donating substances. One of the most important members of this class is the azithromycin (Figure 1), which has been used as antibiotic in the human medicine for the treatment or prophylaxis of a number of health problems such as ear, lung, skin, and throat infections,3,4 veneral disease,5 pneumonia,6 toxoplasmosis7 and opportunistic diseases in patients with AIDS.8
most employed technique for this purpose. Hence, methods based on HPLC with electrochemical,9,10 luorimetric (with pre-column derivatization)11,12 and mass spectrometric13,14 detection were already reported. On the other hand, the development of HPLC methods with UV detection is not a common subject because of the extremely low absorption capacity of the azithromycin in this spectral range. Nevertheless, Zubata et al.15 proposed a simple and low-sensitivity methodology for the azithromycin determination in pharmaceuticals using this approach.
Other analytical techniques also employed for
azithromycin determination were voltammetry,16
amperometry,17 spectroluorimetry,18 chemiluminescence19 and spectrophotometry.20-24 Although the low cost and simplicity of molecular absorption spectrophotometry only few papers related the use of this technique for azithromycin determination. In this ield, Rachidi et al.20 proposed a method based on the extraction of the ionic-pair formed between azithromycin and Mo(IV)-SCN complex with dichloroethane. The measurements were performed at 469 nm against a blank solution prepared analogously to the standard solutions. The greatest inconvenient of the method was the excessive handling of the samples and the long time required to complete the whole procedure.
Sultana et al.21 studied the degradation of the azithromycin in strong acidic and alkaline media. Applying these treatments, the authors converted the azythomycin in a specie with higher absorbing capacity, making possible to perform its determination in the samples. Maximum absorption of the product was veriied at 482 nm when a concentrated solution of H2SO4 was employed, while maximum absorption at 215 nm was observed for the product obtained in basic medium (0.2 mol L-1 NaOH). In both cases, the samples were heated at 60 oC for 30 min to achieve quantitative conversion of the azithromycin. Again, the excessive handling of samples and standard solutions was necessary to achieve a suitable sensitivity, making the analytical procedure laborious and time-consuming.
The method developed by Walash et al.22 was based on the formation of binary complexes between the macrolide antibiotics and eosin Y in aqueous buffered medium at pH 3.0. At this condition, binary complexes presented strong absorption in the range of 542-544 nm. The procedure was applied in the determination of azithromycin, erythromycin, roxithromycin and clarithromycin in commercial medicines.
In spite of the fact that charge transfer reactions have been extensively employed in the development of spectrophotometric analytical methodologies applied to several drugs,25-32 only two works23,24 demonstrated the usefulness of such reactions in the azithromycin determination. Kelani et al.23 utilized the reagent DDQ
(2,3-dichloro-5,6-dicyano-p-benzoquinone) as acceptor for the determination of various n-electron donating substances (azithromycin among them). Maximum sensitivity was obtained at 588 nm for all drugs tested, indicating that the product formed from the charge transfer reactions, in all cases, was the same. Huang et al.24 employed other two reagents, 7,7,8,8-tetracyanoquinodimethane (TCNQ) and chloranilic acid (CL), for the azithromycin spectrophotometric quantiication in pharmaceuticals. After reacting with the azithromycin, both reagents produced substances (charge transfer complexes) that absorbed radiation at 743 and 842 nm, respectively.
The goal of this work was to develop a simple, low-cost and eficient method for azithromycin determination in pharmaceutical formulations exploring, for the irst time, its charge transfer reaction with quinalizarin. Secondly, this work aimed to evaluate and characterize such reaction, since quinalizarin was never employed for this task.
Experimental
Apparatus
All absorbance spectra were obtained with a Femto 800 XI (São Paulo, Brazil) spectrophotometer with a nominal resolution of 1 nm and a standard glass cuvette of 10 mm optical path. The spectrophotometer was coupled to a PC for data acquisition and treatment.
Infrared spectra were recorded with a Fourier transform spectrometer furnished by ABB (Zurich, Switzerland), model FTLA 2000. All spectra recorded in this work were an average of 16 accumulated scans with a nominal resolution of 4 cm-1.
An AND (Tokyo, Japan), model GR-202, analytical balance with a precision of 0.01 mg was employed in all steps of the work.
Reagents and solutions
All solvents (dimethyl sulfoxide, methanol, ethanol, acetone and acetonitrile) used in this work were of Figure 1. Structure of the azithromycin.
N
O H2C
CH3
CH3
CH3
CH3
CH3
CH3
CH3
O
O H3C
OH OH OH
O
O N(CH3)2
HO
OH CH3
CH3
OCH3
CH3
HPLC grade and were supplied by Tedia (São Paulo, Brazil). Quinalizarin (1,2,3,4-hydroxyantraquinone) was of analytical grade and provided by Acros Organics (St. Louis, USA).
A 1000 mg L-1 standard stock solution of azithromycin was prepared by simple dissolution of 10.48 mg of the pharmaceutical grade drug (di-hydrate form), furnished by Pharma Nostra (Rio de Janeiro, Brazil), in approximately 5.0 mL of methanol and further dilution to 10.00 mL with the same solvent in a volumetric lask. This solution was prepared daily since it was unstable after 24 h even when kept in the refrigerator. Working standard solutions were prepared from suitable dilution of the standard stock solution.
Quinalizarin (1,2,3,4-hydroxyantraquinone) solution
with 500 mg L-1 was prepared by dissolving 25.0 mg of
the reagent, furnished by Vetec (Rio de Janeiro, Brazil), in approximately 25.0 mL of dimethyl sulfoxide (DMSO). After obtaining a solid-free solution, it was transferred to a 50.00 mL volumetric lask and the volume was completed to the mark with DMSO. This solution was stable for one week, at least.
Construction of calibration curves
Aliquots of methanol solutions containing known amounts of the drug were transferred to separated 25.00 mL volumetric lasks. To each lask 2.50 mL of the 500 mg L-1 quinalizarin solution was added. Afterwards, the obtained mixture was shaken in order to promote the reaction and the volume was completed to the mark with methanol. The absorbance of this inal solution was measured at 564 nm against a blank containing only the quinalizarin reagent.
Sample preparation and measurement
After measuring the mass of each tablet individually (approximately 625 mg each one), the whole blister content (three tablets) was weighed and inely powdered using an agate mortar. Then, a 50.0 mg portion of the powdered sample was accurately weighed and exactly 25.0 mL of methanol was added. The mixture obtained was shaken for 5 min and then iltered through a PTFE membrane ilter with 0.2 µm pore diameter. Exactly 250 µL of the iltrate and 2.50 mL of quinalizarin solution were transferred to a 25.00 mL volumetric lask, the volume was completed to the mark with methanol and the absorbance was measured at 564 nm against a reagent blank solution.
In the recovery test, the same procedure was adopted. However, in this experiment, a known mass (100.0 or 200.0 mg) of the solid standard azithromycin was added to the mortar during sample powdering.
The developed procedure was applied to the analysis of three commercial samples of different manufacturers, which were purchased in local markets in packages with three tablets containing a reported amount of 500 mg of azithromicyn per tablet.
Infrared spectra
Infrared spectra of the quinalizarin, azithromycin and reaction product were recorded as potassium bromide pellets. For this purpose, approximately 10 mg of each compound was mixed with 100 mg of KBr and pressurized to obtain a pellet. Then, the pellet was transferred to the spectrometer and the spectra were recorded in the range of 4000-400 cm-1 with a nominal resolution of 4 cm-1.
The reaction product was obtained from a methanol solution containing 200 mg L-1 azithomycin and 50 mg L-1 quinalizarin. After obtaining a clear solution, the solvent (methanol) was evaporated at low pressure and temperature and the remaining solid was used for KBr pellet preparation and posterior infrared spectrum recording.
Results and Discussion
The study and development of the method for the determination of azithromycin in pharmaceutical formulations, exploring its charge transfer reaction with quinalizarin, was performed through two steps: (i) optimization of the experimental conditions in order to achieve both maximum sensitivity and selectivity. This step comprised the evaluation of the effect of the solvent nature, investigation of the influence of the reagent concentration and evaluation of the time required to complete the reaction and; (ii) study and characterization of the reaction, which was carried out by the evaluation of the reaction stoichiometry (Job’s continuous variation method), calculation of the association constant and molar absorptivity in methanol medium and the veriication of the proposed reaction mechanism.
Evaluation of the effect of the solvent nature
would be an excellent solvent for the procedure. However, the poor solubility of the quinalizarin in water did not allow its use in the present case. So, the reaction was tested in ethanol, methanol, acetone, DMSO and acetonitrile media. Although the highest dielectric constant of DMSO and acetonitrile, best sensitivity was achieved with methanol (Figure 2), probably because of the capacity of this solvent to form stable hydrogen bonds with the radical anion. Then, methanol was chosen for further experiments.
Maximum absorbance of the solutions was observed at 564 nm in methanol medium. Thus, this wavelength was chosen for all further measurements in order to obtain highest sensitivity for the method. It is important to point out that the quinalizarin alone, in methanol medium, exhibits maximum absorption at 486 nm. The high difference between maxima of the reagent and the product absorption bands (78 nm) allowed the measurement of the product with only a small contribution of the reagent that was added in excess in the medium.
Effect of the quinalizarin concentration
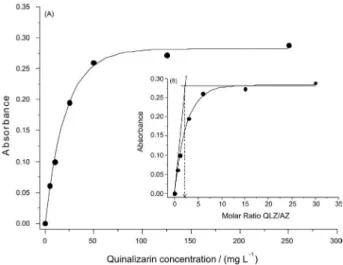
In spectrophotometric analytical methods where maximum sensitivity is desired, the reagent concentration in solution is an important parameter to be studied, since the maximum conversion of the analyte into absorbing specie depends on the amount of the reagent available in the solution for reaction and the equilibrium involved. In order to achieve this objective, an experiment was performed by varying the quinalizarin concentration in the range of 0-250 mg L-1, while the azithromycin concentration was maintained constant at 20 mg L-1. The results are shown in the Figure 3A. As it can be seen, remarkable increase of the absorbance at 564 nm
was veriied up to 50 mg L-1 quinalizarin concentration and, after this point, it only suffered a slight increase. This probably occurred because at 50 mg L-1 there already is a suficient excess of the reagent to consume all azithromycin present in the medium. So, a quinalizarin concentration of 50 mg L-1 was established for the method to attain satisfactory sensitivity besides lower blank values.
It is possible to see in Figure 3B that when the quinalizarin molar concentration is twofold the azithromycin concentration there is a total consumption of the azithromycin, indicating that these reagents should react in a ratio of one mol of azithromycin for two mols of quinalizarin.
Effect of the reaction time
The optimum reaction time was determined by continuous monitoring of the absorbance at 564 nm of a solution containing 20 mg L-1 azithromicyn plus 50 mg L-1 quinalizarin at laboratory ambient temperature (25 °C). Stable absorbance values were observed from the beginning of the experiment up to 105 min. After this time, absorbance suffered a slight increase, reaching values up to 28% higher than those observed in the beginning of the reaction. In view of these results, all measurements were carried out after 5 min of mixing of the reagents in order to make the method faster.
Stoichiometry of the reaction
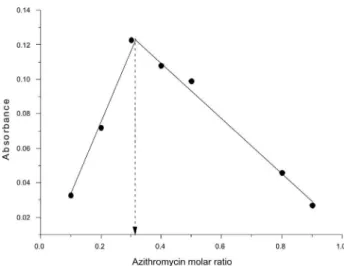
Job’s method of the continuous variation33 was employed to determine the stoichiometry of the charge transfer reaction in methanol medium. Keeping the sum of Figure 2. Spectra of solutions of quinalizarin-azithromycin in different
solvents obtained against quinalizarin solutions also prepared in each solvent. (A) methanol, (B) DMSO, (C) ethanol, (D) acetonitrile and (E) acetone. Quinalizarin concentration = 30 mg L-1 and azithromycin concentration = 20 mg L-1.
the molar concentrations of azithromycin and quinalizarin ixed, the ratio of the concentrations of the two substances in the mixture was varied and the absorbances of the mixtures were recorded at 564 nm against a convenient blank solution prepared for each point of the experiment. As shown in Figure 4, the azithromycin molar ratio which gave maximum absorbance was 0.32, indicating that it reacts with quinalizarin in a proportion of 1:2 and conirming the assumption raised before when the effect of quinalizarin concentration was studied. In view of this result a reaction mechanism was proposed considering the transfer of two free electrons of the two nitrogen atoms (one electron of each nitrogen) present in one molecule of azithromycin (dimethylamine group and nitrogen in the lactone ring) to the charge-deicient center of two molecules of quinalizarin.
Mechanism veriication
Quinalizarin solution in methanol exhibits an absorption band with a well deined maximum at 486 nm while the azithromycin solution in methanol showed no absorption in the 400-700 nm range. The addition of azithromycin to quinalizarin solution in methanol caused an immediate change in the absorption spectrum with the appearance of a new characteristic band with maximum absorption at 564 nm.
According to Ayad et al.34 molecular charge-transfer complexes are formed in non-polar solvents while radical anion species are predominant in polar solvents. Also, it is believed that the addition of basic compounds that contains a lone pair of electrons, such as azithromycin, results in the formation of charge-transfer complexes of n-π type. This kind of complexes can be considered an
intermediate molecular-association compound that forms
a corresponding radical anion in polar solvents. In this case, radical anions results from the total transfer of charge.
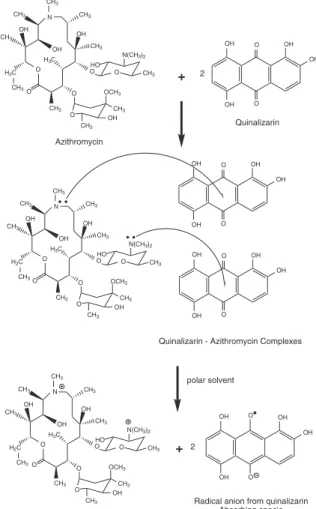
In the present work, the formation of the radical anion of quinalizarin was investigated by infrared spectrometry. According to Foster,35 the decrease of speciic bands in the infrared spectrum can be used to identify the site where, in the molecule, charge-transfer reaction occurs. The spectrum of the quinalizarin alone (Figure 5A) presented some speciic absorption bands at 1604 and 1582 cm-1, which can be assigned to the stretching of the two C=O bonds present in its structure. After reacting quinalizarin with azithromycin, these bands almost disappeared (Figure 5C), showing that the C=O group was not present in the molecule anymore. This change in the spectrum evidenced the formation of a radical anion of quinalizarin from total charge transfer of the azithromycin, according to the scheme presented in the Figure 6. It is important to remark that the band located at 1724 cm-1 in the spectrum of the reaction product is due to the absorption of the C=O group of the azithromycin (Figure 5B), which was added in excess to ensure total consumption of quinalizarin and make possible to record the spectrum of the reaction product in its absence.
Interference study
A study was performed in order to evaluate the effect of possible interferent species on the azithromycin reaction with quinalizarin. Substances usually found in the pharmaceutical formulations of azithromycin such as titanium dioxide, magnesium stearate and sodium dodecylsulfate were tested as possible interferents. Titanium dioxide and magnesium stearate were not appreciably soluble in methanol being separated from the azithromycin during iltration step. So, these substances did not present any interference on the azithromycin determination. On the other hand, SDS showed to be soluble in methanol and was then tested up to 1000 mg L-1 concentration. No signiicant variation of the analytical signal of the azithromycin was veriied up to the value tested. Once this substance is found in a range of 0.5-1.0% m/m in the pharmaceutical formulations and taking into account the dilution of the sample before measurement, it is possible to conclude that the SDS does not cause any remarkable interference on the determination of azithromycin in pharmaceutical formulations using the proposed method.
Method evaluation
Analytical igures of merit
The proposed methodology was critically evaluated Figure 4. Application of Job’s method to the reaction between quinalizarin
with regard to accuracy, precision, limit of detection, limit of quantification and linear dynamic range. Performing azithromycin determination under optimized conditions, a linear dynamic range was derived between 4 and 20 mg L-1, with a typical equation
A = 0.0134 CAZ + 0.001 with a correlation coeficient
r = 0.9995, where A is the absorbance and CAZ is the azithromycin concentration in mg L-1. The limit of detection, estimated as three times the standard deviation of 10 independent measurements of the 4 mg L-1 solution was 0.35 mg L-1. The limit of quantiication, derived from 10 times the standard deviation of the absorbance signal
of the same solution was 1.2 mg L-1. The RSD observed
was 2.95% at the 4 mg L-1 level.
Application of the proposed method
The applicability of the developed method was evaluated by analyzing three samples of commercial drugs containing azithromycin widely commercialized in the Brazilian market. The results obtained in the analysis are summarized in Table 1. As it can be seen, the results obtained using the proposed method agreed with the values indicated by the manufacturers, especially if the range allowed by the Brazilian pharmacopeia is taking into consideration (15% variation). However, once the values expressed in the labels cannot be taken as reference to prove the accuracy of the method, and there are no certiied materials similar to this kind of sample, the accuracy was tested by carrying out Figure 5. Infrared spectra of the quinalizarin (A), azithromycin (B) and the product of the charge transfer reaction (C).
Figure 6. Possible mechanism of radical anion formation from quinalizarin and azithromycin reaction.
OH OH OH OH O O
Radical anion from quinalizarin Absorbing specie
+
Quinalizarin - Azithromycin Complexes N
O H2C
CH3 CH3 CH3 CH3 CH3 CH3 CH3 O O H3C
OH OH OH
O O
N(CH3)2
HO OH CH3 CH3 OCH3 CH3 N O H2C
CH3 CH3 CH3 CH3 CH3 CH3 CH3 O O H3C
OH OH OH
O O
N(CH3)2
HO OH CH3 CH3 OCH3 CH3 O H2C CH3 CH3 CH3 CH3 CH3 CH3 O O H3C
OH OH OH
O O
N(CH3)2
Table 1. Results obtained in the analysis of commercial pharmaceutical formulations containing azithromycin. Values are expressed as a mean ± standard deviation (n = 3). In all cases the reported value of azithromycin is 500 mg per tablet
Sample Azithromycin found (mg per tablet)
Difference / (%)
I 511 ± 7.8 + 2.2
II 494 ± 8.2 −1.7
III 475 ± 7.0 −5.0
Table 2. Results obtained in the recovery test performed with the three samples of commercial pharmaceutical formulations containing azithromycin. Values are expressed as a mean of three independent analysis ± standard deviation
Sample Azithromycin added / mg
Azithromycin recovered / mg
Recovery / (%)
I 100
200
105 ± 1.3 207 ± 1.0
105 104
II 100
200
97.8 ± 1.9 185.6 ± 2.5
97.8 92.8
III 100
200
88.9 ± 2.5 183.9 ± 2.7
88.9 91.9
addition-recovery experiments. Results obtained in these experiments are shown in Table 2.
Recoveries in the range of 88.9-105% were obtained indicating that the developed method is accurate for the determination of azithromycin in commercial drugs without any matrix or spectral interferences.
Conclusions
The method proposed in the present work proved to be an excellent alternative for the azithromycin determination in pharmaceutical formulations. It presented adequate sensitivity and selectivity, allowing the determination of the analyte at levels under those found in the samples. Also, the developed method presented some advantages such as the use of low cost instrumentation (single-beam spectrophotometer) and low operational cost. In the practical point of view, the method required minimum sample treatment, which allowed us to achieve a high analytical productivity.
The charge-transfer reaction between azithromycin and quinalizarin was enhanced in methanol medium. Also, the reaction was very fast in this solvent, which allowed the absorbance measurement only 5 min after reagents mixing. Linear analytical curves were obtained in the range of 4-20 mg L-1 and the limits of detection and quantiication were 0.35 and 1.2 mg L-1, respectively. These characteristics make the method very suitable for routine analysis in quality control laboratories.
Acknowledgments
The authors would like to thank to CNPq (Conselho Nacional de Desenvolvimento Cientíico e Tecnológico) and CAPES (Coordenação de Aperfeiçoamento de Pessoal de Nível Superior) for inancial support, grants and fellowships.
References
1. Mazzei, T.; Mini, E.; Novelli, A.; Periti, P; J. Antimicrob. Chemother.1993, 31, 1.
2. Korolkovas, A.; Dicionário Terapêutico Gunabara, Guanabara Koogan: Rio de Janeiro, Brazil,2006.
3. Guven, M.; Bulut, Y.; Sezer, T.; Aladag, I.; Eyibilen A.; Etikan, I.; Int. J. Pediatr. Otorhinolaringol.2006, 70, 915.
4. Peters, D. H.; Friedel, H. A.; MacTavish, D.; Drugs1992, 44, 750.
5. Drew, R. H.; Gallis, H. A.; Pharmacotherapy 1992, 12, 161. 6. Kinasewitz, G.; Wood, R. G.; Eur. J. Clin. Microbiol. Infect.
Dis.1991, 10, 872.
7. Chang, H. R.; Int. J. STD AIDS1996, 7, 18. 8. McCutchan, J. A.; Int. J. STD AIDS1996, 7, 34.
9. Leal, C.; Codony, R.; Compañó, R.; Granados, M.; Dolors-Prat, M.; J. Chromatogr., A2004, 910, 285.
10. Kees, F.; Spangler, S.; Wellenhofer, M.; J. Chromatogr., A1998,
812, 287.
11. Wilms, E.; Trumpie, H.; Veenendaal, W.; Touw, D.;
J. Chromatogr., B2005, 814, 37.
12. Bahrami, G.; Mohammadia, B.; J. Chromatogr., B.2006, 830, 355.
13. Nirogi, R. V. S.; Kandikere, V. N.; Shukla, M.; Mudigonda, K.; Maurya, S.; Boosi, R.; Yerramilli, A.; Anal. Chim. Acta2005,
553, 1.
14. Abuin, S.; Codony, R.; Compaño, R.; Granados, M.; Dolors-Prat, M.; J. Pharm. Biomed. Anal.2005, 39, 376.
15. Zubata, P.; Ceresole, R.; Rosasco, M. A.; Pizzorno, M. T.;
J. Pharm. Biomed. Anal.2002, 27, 833.
16. Nigovic, B.; Imunic, B.S.; J. Pharm. Biomed. Anal.2003, 32, 197.
17. Palomeque, M. E.; Ortíz, P. I.; Talanta2007, 72, 101. 18. Khashaba, P. Y.; J. Pharm. Biomed. Anal.2002, 27, 923. 19. Song, Z.; Wang, C.; Bioorg. Med. Chem.2003, 11, 5375. 20. Rachidi, M.; Elharti, J.; Digua, K.; Cherrah, Y.; Boukloze, A.;
Anal. Lett.2006, 39, 1917.
21. Sultana, N.; Arayne, M. S.; Hussain, F.; Fatima, A.; Pakistan J. Sci.2006, 19, 94.
22. Walash, M. I.; Rizk, M. S.; Eid, M. I.; Fathy, M. E.; J. AOAC Int.2007, 90, 1579.
23. Kelani, K.; Bebawy, L. I.; Abdel-Fattah, L.; Ahamad, A. S.;
24. Huang, W.; Liu, X. J.; Zhao, F. L.; Spectrosc. Spectral Anal.
2006, 26, 913.
25. Rahman, N.; Anwar, N.; Kashif, M.; Il Farmaco2005, 60, 605. 26. El-Mammli, M. Y.; Spectrochim. Acta, Part A2003, 59, 771. 27. Salem, H.; J. Pharm. Biomed. Anal.2002, 29, 527.
28. Mostafa, S.; El-Sadek, M.; Alla, E. A.; J. Pharm. Biomed. Anal.
2002, 27, 133.
29. Amin, A. S.; Ragab, G. H.; Saleh, H.; J. Pharm. Biomed. Anal.
2002, 30, 1347.
30. El-Mossalamy, E. H.; Spectrochim. Acta, Part A2004, 60, 1161.
31. Ayad, M. M.; Shalaby, A. A.; Abdellatef, E.; Elsaid, H. M.;
J. Pharm. Biomed. Anal.1999, 18, 975.
32. Mostafa, A. A.; Bebawyb, L. I.; Refaat, H. H.; J. Pharm. Biomed. Anal.2002, 27, 889.
33. Job, P.; Ann. Chim.1928, 9, 113.
34. Ayad, M. A.; Belal, S.; El-Adl, S. M.; Al-Kheir, A. A.; Analyst
1984, 109, 1417.
35. Foster, R.; Organic Charge-Transfer Complexes, Academic Press: New York, 1969.