Article
0103 - 5053 $6.00+0.00
*e-mail: [email protected]
Electrochemical Degradation of the Reactive Red 141 Dye on a
β
-PbO
2Anode
Assessed by the Response Surface Methodology
José M. Aquino, Romeu C. Rocha-Filho,* Nerilso Bocchi and Sonia R. Biaggio
Department of Chemistry, São Carlos Federal University, CP 676, 13560-970 São Carlos-SP, Brazil
A degradação eletroquímica do corante Vermelho Reativo 141 foi investigada por meio da aplicação da metodologia de superfície de respostas, utilizando reator iltro-prensa com anodo de β-PbO2. A carga requerida para 90% de descoloração (Q
90) e a remoção da demanda química
de oxigênio após 30 min de eletrólise (COD30) foram utilizadas para modelar o sistema. As
variáveis investigadas foram a densidade de corrente, pH, concentração de NaCl e temperatura. Baixos valores de Q90 (0,2-0,3 A h L-1) foram obtidos em condições ácidas (pH 1-3) e em altas
concentrações de NaCl (1,0-2,0 g L–1), quando as espécies oxidantes Cl
2 e HOCl estão presentes.
Os melhores valores para COD30 foram obtidos com altas densidades de corrente e em condições de
pH ácido a neutro; entretanto, o consumo energético resultante torna o processo economicamente não viável. Para soluções extremamente ácidas foram obtidos valores reduzidos de consumo de energia, relacionado ao Q90, em torno de 0,79 kW h m–3.
The electrochemical degradation of the Reactive Red 141 dye using a ilter-press reactor with a β-PbO2 anode was investigated through the application of the response surface methodology. The charge required for 90% decolorization (Q90) and the chemical oxygen demand removal
percentage after 30 min electrolysis (COD30) were used to model the system. The investigated
independent variables were the current density, pH, NaCl concentration, and temperature. Low values of Q90 (0.2-0.3 A h L–1) were obtained at acidic conditions (pH 1-3) and high concentrations
of NaCl (1.0-2.0 g L–1), when Cl
2 and HOCl are the predominant oxidant species. The best values
of COD30 were obtained at high current densities and acidic to neutral conditions (pH 5-7);
however, the consequent energy consumption makes the process not economically feasible under these conditions. For strongly acidic solutions, speciic energy consumptions associated to Q90 as
low as 0.79 kW h m–3 were attained.
Keywords: electrooxidation, dye degradation, Reactive-Red 141 dye, PbO2 anode, factorial design
Introduction
The contamination of water is one of the greatest current challenges, as it is becoming a scarce natural resource. The textile industry, in particular, stands in a delicate position due to the large volumes of water used and wastewater produced during dyeing process steps.1
Among the dyes used by this industry, the azo (-N=N-) ones are the most produced and consumed.2,3 It should be
noticed that a considerable amount of synthetic dyes are also discharged in the environment during production. The textile efluents are characterized by intense colors originated by un-reacted dyestuff, high organic loads (due to the presence of auxiliary chemicals), and oscillations
in pH and temperature. Those irst two characteristics make necessary the treatment of these efluents before their discharge into the environment. On the other hand, increasingly rigid environmental regulations also contribute to a search for better and more eficient treatment methods.4
The azo dyes, as highlighted by Zidane et al.,5 are a dye
class that is not easily treated by conventional wastewater treatment methods.
As summarized by Martinez-Huitle and Brillas,3
biological, physico-chemical, and chemical methods, among others, are commonly used for the treatment of industrial wastewaters. All these methods have advantages and disadvantages, although no current technology has universal application.3,6,7 The biological treatment is
ineficient and time consuming for most textile efluents since the respective dye molecules are recalcitrant to microbiological degradation;1,6,7 this recalcitrance makes
the method quite ineficient for color removal. Physico-chemical methods for wastewater treatment, such as adsorption, coagulation, or filtration, are efficient for decolorization, but their application is expensive and leads to a high amount of sludge.3 Chemical methods as well as
advanced oxidation processes are also powerful techniques for dye wastewater decolorization, but are associated to high costs as well as operational problems.3
Considering the above, electrochemical methods might be a good option due to their versatility, easiness of implementation and pollutant high removal rates, despite electrical energy consumption. In such methods, electrode materials play an important role on the degradation eficiency, mechanism and in the resulting products. Depending on the electrode material used, the anodic oxidation of organic pollutants can be distinguished as occurring by selective oxidation (with “active” anodes) or by combustion (with “non-active” anodes).3,8 Recently these types of anodes have
been referred to as low and high oxidation power anodes, respectively.9 Low oxidation power anodes are those that
interact strongly with hydroxyl radicals (•OH), resulting in a low chemical reactivity for organics oxidation (low current eficiency for organics oxidation). On the contrary, high oxidation power anodes present a weak interaction with •OH radicals, resulting in a high reactivity for organics oxidation (high current eficiency for organics oxidation).9 Organics
oxidation mediated by other electrogenerated oxidants, like Cl2, ClO– and HClO, is possible in the presence of chloride
ions.3 Concerning these electrogenerated oxidants, several
works have been published on their reaction schemes,3,10,11
speciation diagrams,10 and parameters affecting their
production11-14 (e.g. anode material, temperature and pH),
as well as their role on the dyestuff mineralization.13,15,16
However, the possible formation of undesirable chloro-organic derivatives, as detected in the electrochemical treatment of a tannery wastewater,17 might be the main
disadvantage of these electrogenerated oxidants.
Pure or doped PbO2 is a high O2-overvoltage anode material commonly used in organics electroxidation.4,18-25
According to the criteria discussed by Kapalka et al.,9 PbO 2
anodes could be classiied as medium oxidation power anodes. In some cases, poor performance and problems like scaling and dissolution regarding Ti/PbO2 electrodes were reported,11,26 although these problems seem to be related
to the substrate preparation. Nevertheless, this anode in many instances has presented good performances in the degradation of organics, sometimes similar to that of a boron-doped diamond electrode.4,18-25
Classical and conventional methods of studying the inluence of one variable at a time require a considerable number of experiments and are time consuming. Moreover, not all combinations of variables or all their levels are taken into account. Thus, statistical methodologies, such as the Response Surface Methodology (RSM),27 enable
studying and modeling a system with respect to its variables more eficiently, in order to ind and optimize the best experimental conditions.
Therefore, this work aimed to ind the best experimental conditions, using RSM, for the electrochemical degradation of the Reactive-Red 141 (RR 141) azo dye on a Ti-Pt/β-PbO2 anode.
Experimental
Chemicals
All chemicals, including Pb(NO3)2 (a.r., Acros), sodium lauryl sulfate, SLS (99%, Fisher Scientific), H2PtCl6 (99.9%, Aldrich), HCl (36.5%, Mallinckrodt), H2SO4 (98%, Mallinckrodt), HNO3 (69-70%, Mallinckrodt), Ag2SO4 (a.r., JT Baker), HgSO4 (a.r., JT Baker), NaCl (a.r., JT Baker), Na2SO4 (a.r., Qhemis), and RR 141 (Dyestar), were used as received. Doubly deionized water (Millipore Milli-Q system, ≥ 18.2 MΩ cm) was used for the preparation of all solutions.
b-PbO2 ilm preparation on a Ti-Pt substrate
Firstly, both sides of Ti plates (3.1 cm × 2.7 cm, 99.9% Aldrich) were sandblasted using 60-70 µm glass microspheres, followed by cleaning for 20 min in an ultrasonic bath containing 2-propanol. Then, platinum ilms were electrodeposited (250 mA cm–2 for 10 min) on
these Ti plates, using a conventional one-compartment cell with two Pt foil counter electrodes. The electrodeposition bath consisted of 20 g L–1 H
2PtCl6 in 8.2 mol L
–1 HCl at
65 ºC.28
The β-PbO2 films were electrodeposited on the platinized Ti substrates in a conventional cell, using a calomel reference electrode and two AISI-304 stainless steel plates as counter electrodes. The deposition bath consisted of 0.1 mol L–1 Pb(NO
3)2, 0.5 g L
–1 sodium
lauryl sulfate (SLS), in 0.1 mol L–1 HNO
3 at 65 °C. 25 The
electrolysis (20 mA cm–2) was carried out for the time
necessary to obtain a 50 mg cm–2 PbO
2 ilm, assuming 100%
Electrochemical degradation of RR 141
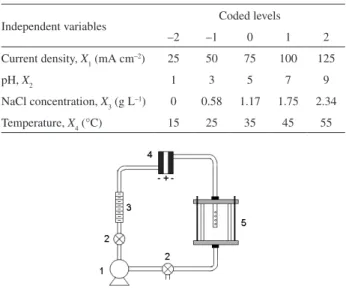
The electrochemical experiments were carried out in a one-compartment ilter-press reactor composed of the Ti-Pt/ β-PbO2 electrode (exposed area: 3.1 cm × 1.9 cm, each face) and two nickel plates as anode and cathodes, respectively. The experimental setup and the electrochemical reactor are schematically shown in Figures 1 and 2, respectively. In order to investigate and ind the best experimental conditions for the RR 141 electrochemical degradation, RSM by a central composite design (CCD) was used. The investigated variables were: current density, pH, NaCl concentration, and temperature. Five different levels (–2, –1, 0, 1, 2) were studied for each variable. Table 1 shows the range and the levels of these variables. Three replications were carried out at the design center in order to evaluate the pure error and, consequently, the lack of it. All the experiments were carried out randomly.
The RR 141 concentration in a 0.1 mol L–1 Na
2SO4
solution was ixed at 100 mg L–1. Other ixed parameters
were the dye solution volume (0.4 L) and the low rate (360 L h–1).
Analyses
The electrochemical performance was analyzed through solution color and COD removals. The decolorization was monitored in situ (at 544 nm) by pumping the dye solution from the electrochemical system reservoir to an UV-Vis spectrophotometer (Ultrospec 2100 pro, from Amersham Pharmacia Biotech), and then back to the reservoir. The charge per unit volume of the electrolyzed solution required for 90% decolorization (Q90) was used to model
the electrochemical system performance.
The COD measurements were carried out after 30 min of electrolysis (COD30) using a 2.5-mL sample of the
electrolyzed dye solution. This sample was oxidized by digestion at 150 °C for 2 h in a H2SO4 solution with K2Cr2O7, Ag2SO4, and HgSO4. The sample absorbance was read at 620 nm in a Hach DR/890 model spectrophotometer. The COD30 values were calculated using a previously
calibrated curve and the modeling was conducted through the percentage of COD removal.
The quadratic equation used to model the RSM responses was Y = β0 + ΣβiXi + ΣβiiXi2 + Σβ
ijXiXj, where
β0,i,ii,ij are model coefficients and Xi,j the independent
variables. Detailed description and discussion of this equation can be found in Montgomery’s book.27
Results and Discussion
The CCD experimental matrix as well as the observed and predicted responses for COD30 removal (%) and Q90 (A h L–1)
are shown in Table 2. The quadratic equations that describe the
COD30 removal and Q90 behaviors are given below. In these
equations, non-signiicant coeficients were excluded based on the results for each model analysis of variance (ANOVA) and the student t test (at 95% conidence level).
Q90 (A h L–1) = 0.545 + 0.003X
1 + 0.134X2 – 0.140X3 +
0.084X4 + 0.006X12 – 0.051X 2
2 + 0.117X 3
2 + 0.053X 4
2 –
0.017X1X2 – 0.019X1X4 + 0.073X2X3 + 0.056X2X4 – 0.006X3X4
COD30 (%) = 90.0 + 11.9X
1 – 5.6X3 – 2.0X4 – 4.2X1
2 –
10.0X22 – 10.4X 3
2 – 5.1X 4
2 – 4.1X
1X2 – 3.4X1X3 + 2.6X1X4 –
5.5X2X3 + 10.6X3X4
According to the F-test, the Q90 modeling presented a
considerable lack of fit (F10,2 (95%) = 170.0). However, the Table 1. Range and codiication of the independent variables (Xi) used
in the experimental design
Independent variables Coded levels
–2 –1 0 1 2
Current density, X1 (mA cm–2) 25 50 75 100 125
pH, X2 1 3 5 7 9
NaCl concentration, X3 (g L–1) 0 0.58 1.17 1.75 2.34
Temperature, X4 (°C) 15 25 35 45 55
Figure 1. Experimental setup for the electrochemical treatment of the Reactive Red 141 dye: (1) magnetic pump; (2) valves; (3) rotameter; (4) ilter-press reactor; (5) reservoir.
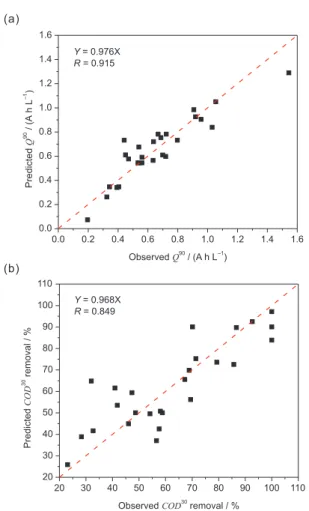
observed and the predicted Q90 values presented a good
correlation as shown in Figure 3a. On the other hand, the
COD30 removal modeling was satisfactorily adjustable
(F10,2 (95%) = 1.1), with a signiicant correlation between the
observed and predicted percentage values (Figure 3b). Figure 4 shows some of the response surfaces for Q90 as
a function of the independent variables: NaCl concentration and pH (Figure 4a), temperature and pH (Figure 4b), and current density and pH (Figure 4c). Among these variables, pH is the most important due to different chloro-species generation. The current density and the NaCl concentration determine the rate and amount of the generated chloro-species, respectively. The temperature determines mainly the oxidants diffusion rate, as well as the chloro-species generation and stabilization.
Figure 4a (data obtained at 35 °C and using 75 mA cm–2)
shows that the best operational conditions (low Q90
values) occur for very low pH values and high NaCl concentrations. According to the literature,3,10,16,22 the
predominant active chlorine species in these conditions are Cl2 and HClO:
2Cl– (aq) Cl
2(aq) + 2e
– (1)
Cl2(aq) + H2O(l) HOCl(aq) + Cl– (aq) + H+ (aq) (2)
As these species have a higher oxidation potential than the OCl– species, which are mainly produced in neutral to
basic conditions (pH ≥ 7), the mediated oxidation of the chromophore double bonds is rapidly accomplished. Table 2. Central composite design matrix for the eletrooxidation of the Reactive Red 141 dye and respective predicted and observed charges (90% decolorization) and COD removal
Exp I pH NaCl Temperature Charge / (A h L
–1) COD removal / %
SEC* / (kW h m–3)
Predicted Observed Predicted Observed
1 –1 –1 –1 –1 0.676 0.539 56.2 69.4 2.83
2 –1 –1 1 1 0.346 0.343 53.5 41.8 1.57
3 –1 1 –1 1 1.051 1.054 45.0 46.0 4.88
4 –1 1 1 –1 0.598 0.719 38.9 28.3 3.68
5 1 –1 –1 1 0.782 0.723 69.8 68.9 4.30
6 1 –1 1 –1 0.341 0.392 61.6 40.9 2.60
7 1 1 –1 –1 0.732 0.797 92.5 92.7 5.61
8 1 1 1 1 0.839 1.030 64.8 32.0 5.95
9 1 –1 –1 –1 0.754 0.687 89.8 86.7 4.78
10 –1 1 –1 –1 0.720 0.637 75.3 71.4 3.31
11 –1 –1 1 –1 0.263 0.325 41.7 32.7 1.66
12 1 1 1 –1 0.610 0.699 42.5 57.6 4.73
13 –1 –1 –1 1 0.782 0.668 25.9 23.1 3.16
14 1 1 –1 1 0.985 0.907 72.6 85.7 5.57
15 1 –1 1 1 0.346 0.405 83.9 100.0 2.43
16 –1 1 1 1 0.905 0.956 50.8 58.1 4.35
17 0 0 0 0 0.545 0.560 90.0 70.1 3.10
18 0 0 0 0 0.545 0.533 90.0 100.0 3.00
19 0 0 0 0 0.545 0.542 90.0 100.0 3.09
20 –2 0 0 0 0.565 0.634 49.6 54.1 2.62
21 2 0 0 0 0.577 0.470 97.1 100.0 3.23
22 0 –2 0 0 0.073 0.196 50.0 48.7 0.78
23 0 2 0 0 0.611 0.450 50.0 58.8 2.46
24 0 0 –2 0 1.290 1.544 59.4 47.3 8.89
25 0 0 2 0 0.732 0.441 37.1 56.6 2.36
26 0 0 0 –2 0.591 0.560 73.6 79.3 3.58
27 0 0 0 2 0.926 0.919 65.6 67.2 4.55
Figure 4b (data obtained using 75 mA cm–2 and
1.17 g L–1 NaCl) shows that Q90 has a region of minimum
at 35 °C and very low pH values. This is consistent with the temperature associated to the results presented in Figure 4a. The increase in Q90 at temperatures lower than 35 °C is
probably due to a decrease in the reaction rate. On the other hand, the increase in Q90 at temperatures higher than 35 °C
is possibly due to a lower Cl2 solubility, as well as increased O2 evolution reaction or waste chemical reactions:3,12,13,20
2HOCl(aq) + OCl– (aq)
ClO3– (aq) + 2Cl– (aq) + 2H+ (aq) (3)
2ClO– (aq) 2Cl– (aq) + O
2(g) (4)
ClO– (aq) + H
2(g) H2O(l) + Cl
– (aq) (5)
Cl2(aq) Cl2(g) (6)
That is why Q90 increases faster at high temperatures
than at low temperatures, as the pH increases.
Figure 4c (data obtained at 35 °C and using 1.17 g L–1
NaCl) also shows the best operation conditions at very low Figure 3. Observed and predicted plot for: (a) charge required for 90% decolorization and (b) COD removal after a 30 min electrolysis.
Figure 4. Response surfaces for the charge required for 90% decolorization, as a function of: (a) pH and NaCl concentration (at 35 °C and using 75 mA cm–2), (b) pH and temperature (using 75 mA cm–2 and
1.17 g L–1 NaCl) and (c) pH and current density (at 35 °C and using
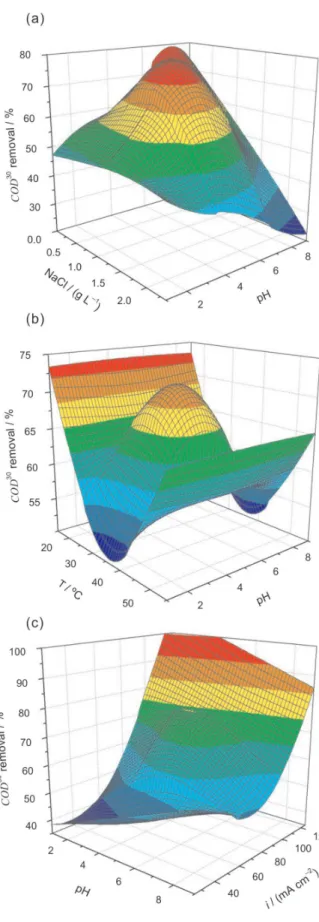
Figure 5. Response surfaces for the COD removal percentage after a 30 min electrolysis, as a function of: (a) pH and NaCl concentration (at 35 °C and using 75 mA cm–2), (b) pH and temperature effects (using
75 mA cm–2 and 1.17 g L–1 NaCl) and (c) pH and current density effects
(at 35 °C and using 1.17 g L–1 NaCl).
pH values, at which, clearly Q90 has a minimum value region
at about 70 mA cm–2. These conditions are related to Cl 2 and
HOCl generation. The high values of Q90 at low and high
current densities (two maxima) are possibly related to the amount of generated oxidants and to their waste chemical reactions, respectively.
The response surfaces for COD30 removal are shown in
Figure 5. In order to compare Q90 and COD30 removal, the
response surfaces of the latter are represented as a function of the same independent variables as in Figure 4. Figure 5a (data obtained at 35 °C and using 75 mA cm–2) shows that
the best pH conditions for COD30 removal are different from
those for Q90. The optimal pH region (5 to 7) corresponds
to slightly acidic to neutral solutions. Additionally, high NaCl concentrations seem to be unnecessary in the electroxidation of solutions containing the RR 141 dye. Different pH conditions for COD and color removals are not new in the literature.3,12,15,16,26 These results indicate
that the dye molecule is slowly mineralized by the Cl2 and HClO species, mainly due to their low solubility in the solution (reaction 6). On the other hand, neutral to basic conditions (pH ≥ 7) favor the production of high amounts of the OCl– species:
HOCl(aq) H+(aq) + OCl– (aq) (7)
As this oxidant concentration increase, a greater COD
removal is more likely to be accomplished despite its lower oxidation potential.
Figure 5b (data obtained using 75 mA cm–2 and
1.17 g L–1 NaCl) shows that the COD30 removal is nearly
independent of the pH at the lowest (< 20 °C) and highest (55 °C) temperatures. The highest COD30 removals were
attained at the lowest temperature because at the highest temperature this removal tends to deteriorate due to the oxidant waste reactions (equations 3 to 6). Hence, the maximum rates of degradation are achieved at around 35 °C and pH 5. It should be recalled that low Q90 values were
also optimized at conditions around 35 °C.
The COD30 removal response surface as a function
of pH and current density is shown in Figure 5c (data obtained at 35 °C and using 1.17 g L–1 NaCl). The value of
COD30 removal increases sharply with the current density
due to the high rates of oxidants electrogeneration. In these conditions the low pH values lead to the best COD30
removal performances owing to the higher concentrations of the Cl2 and HClO species, which have higher oxidation potentials than the OCl– species.
The lowest values of speciic energy consumption attained for Q90 were 0.78 kW h m–3, for strongly acidic
and 35 °C), and about 1.6 kW h m–3, independently of the
temperature (experiments 2 and 11: pH 3, 50 mA cm–2
and 1.75 g L–1 NaCl). These values are much lower than
the ones reported by Rajkumar and Kim,16 who, using
a dimensionally stable anode (36 mA cm–2, 100 ppm
RR 141, initial pH 6.2-6.5, 1.5 g L–1 NaCl and 25 °C),
reported a value of 3.453 kW h m–3 to attain at least 95%
decolorization.
Finally, as it was mentioned before, the possible formation of undesirable chloro-organic derivatives might be a disadvantage of oxidants electrogenerated from chloride ions. This possibility will be investigated in a future work on the electroxidation of the RR 141 dye.
Conclusions
Application of RSM allowed investigating a high number of variables that affect the electrochemical degradation of the RR 141 dye, leading to knowledge of their effects and interactions. The results obtained for the decolorization of the dye solution and its COD removal clearly showed that different experimental conditions are needed in each case. In the presence of chloride ions, the pH was the most signiicant variable affecting these conditions. This fact is strongly related to the nature and amount of oxidant species generated: i) Cl2 and HOCl at acidic conditions (pH 3) for decolorization and ii) OCl– at neutral
or basic conditions (pH ≥ 7) for COD removal. Finally, RSM applied to the RR 141 electrochemical degradation allowed optimizing the experimental conditions to attain low values of the speciic energy consumption, especially when compared to the values reported in the literature.
Acknowledgments
The authors gratefully acknowledge inancial support and scholarships from the Brazilian funding agencies CNPq (141095/2007-5) and FAPESP. Access to several apparatus provided by Prof. Dr. Luis A. M. Ruotolo (DEQ - UFSCar) is also gratefully acknowledged.
References
1. Santos, A. B.; Cervantes, F. J.; Lier, J. B. V.; Bioresour. Technol. 2007, 98, 2369.
2. Fernandes, A.; Morão, A.; Magrinho, M.; Lopes, A.; Gonçalves, I.; Dyes Pigm.2004, 61, 287.
3. Martínez-Huitle, C. A.; Brillas, E.; Appl. Catal. B 2009, 87, 105.
4. Andrade, L. S.; Tasso, T. T.; Silva, D. L.; Rocha-Filho, R. C.; Bocchi, N.; Biaggio, S. R.; Electrochim. Acta2009, 54, 2024. 5. Zidane, F.; Drogui, P.; Lekhlif, B.; Bensaid, J.; Blais, J. F.;
Belcadi, S.; Kacemi, K. E.; J. Hazard. Mater.2008, 155, 153. 6. Mondal, S.; Environ. Eng. Sci.2008, 25, 383.
7. Forgacs, E.; Cserháti, T.; Oros, G.; Environ. Int.2004, 30, 953. 8. Comninellis, C.; Electrochim. Acta1994, 39, 1857.
9. Kapalka, A.; Fóti, G.; Comninellis, C.; J. Appl. Electrochem. 2008, 38, 7.
10. Cheng, C. Y.; Kelsall, G. H.; J. Appl. Electrochem.2007, 37, 1203.
11. Szpyrkowicz, L.; Kaul, S. N.; Neti, R. N.; Satyanarayan, S.;
Water Res.2005, 39, 1601.
12. Bonfatti, F.; De Battisti, A.; Ferro, S.; Lodi, G.; Osti, S.;
Electrochim. Acta2000, 46, 305.
13. Oliveira, F. H.; Osugi, M. E.; Paschoal, F. M. M.; Profeti, D.; Olivi, P.; Zanoni, M. V. B.; J. Appl. Electrochem.2007, 37, 583. 14. Szpyrkowicz, L.; Radaelli, M.; Daniele, S.; Catal. Today2005,
100, 425.
15. Mohan, N.; Balasubramanian, N.; J. Hazard. Mater.2006, B136, 239.
16. Rajkumar, D.; Kim, J. G.; J. Hazard. Mater.2006, B136, 203. 17. Naumczyk, J.; Szpyrkowicz, L.; De Faveri, M. D.; Zilio-Grandi,
F.; Process Saf. Environ. Prot.1996, 74, 59.
18. Andrade, L. S.; Ruotolo, L. A. M.; Rocha-Filho, R. C.; Bocchi, N.; Biaggio, S. R.; Iniesta, J.; García-Garcia, V.; Montiel, V.;
Chemosphere2007, 66, 2035.
19. Awad, H. S.; Abo Galwa, N.; Chemosphere2005, 61, 1327. 20. Bonfatti, F.; Ferro, S.; Lavezzo, M.; Malacarne, M.; Lodi, G.;
De Battisti, A.; J. Electrochem. Soc.2000, 147, 592.
21. Iniesta, J.; González-García, J.; Expósito, E.; Montiel, V.; Aldaz, A.; Water Res.2001, 35, 3291.
22. Panizza, M.; Cerisola, G.; Electrochim. Acta2004, 49, 3221. 23. Shen, Z. M.; Wu, D.; Yang, J.; Yuan, T.; Wang, W. H.; Jia, J. P.;
J. Hazard. Mater.2006, B131, 90.
24. Andrade, L. S.; Laurindo, E. A.; Oliveira, R. V.; Rocha-Filho, R. C.; Cass, Q. B.; J. Braz. Chem. Soc.2006, 17, 369. 25. Andrade, L. S.; Rocha-Filho, R. C.; Bocchi, N.; Biaggio, S.
R.; Iniesta, J.; García-Garcia, V.; Montiel, V.; J. Hazard. Mater. 2008, 153, 252.
26. Panizza, M.; Cerisola, G.; Environ. Sci. Technol.2004, 38, 5470. 27. Montgomery, D. C.; Design and Analysis of Experiments, 6th
ed., John Wiley & Sons: New York, 2005.
28. Andrade, L. S.; Rocha-Filho, R. C.; Bocchi, N.; Biaggio, S. R.;
Quim. Nova2004, 27, 866.
Received: June 13, 2009
Web Release Date: November 26, 2009