Article
0103 - 5053 $6.00+0.00
*e-mail: [email protected]
Drug Release from Microspheres and Nanospheres of Poly(lactide-co-glycolide)
without Sphere Separation from the Release Medium
André R. da Silva,a M. Elisabete D. Zaniquelli,b Mariana O. Barattic and
Renato Atilio Jorge*,d
aFederal Institute of Espírito Santo, Campus Aracruz, 29192-733 Aracruz-ES, Brazil
bDepartment of Chemistry, Faculty of Philosophy, Sciences and Letters of Ribeirão Preto, University
of São Paulo, 14040-901 Ribeirão Preto-SP, Brazil
cDepartment of Clinical Medicine, Faculty of Medical Sciences, University of Campinas,
13083-887 Campinas-SP, Brazil
dDepartment of Physical Chemistry, Institute of Chemistry, University of Campinas,
13083-970 Campinas-SP, Brazil
Foi desenvolvida uma nova técnica que possibilita o monitoramento da liberação de fármacos encapsulados, sem a separação das partículas do meio de liberação, usando espectroscopia de reletância difusa. Foram realizados estudos de liberação do cloro(5,10,15,20-tetrafenilporirinato) de índio(III) (InTPP) a partir de micro e nanoesferas do copolímero do ácido lático-co-glicólico (PLGA). A liberação do InTPP foi bifásica, com uma liberação rápida inicial seguida por uma segunda fase mais lenta de liberação. Modelos matemáticos aplicados aos peris de liberação mostraram que a liberação do InTPP a partir das nanoesferas foi controlada por difusão, o que é esperado para uma substância homogeneamente dispersa dentro da esfera. Contudo, devido a larga distribuição de tamanho das microesferas carregadas com InTPP, os peris de liberação foram irregulares, diicultando o adequado ajuste dos nossos modelos matemáticos. Análise confocal das micropartículas mostrou que o InTPP aparenta ser homogeneamente distribuído dentro das microesferas e nenhuma distribuição preferencial do InTPP foi observada em direção ao interior ou a zona supericial da esfera.
A new technique using diffuse relectance spectroscopy was developed that enables the monitoring of encapsulated drug release without particle separation from the assayed medium. Studies of chloro(5,10,15,20-tetraphenylporphyrinato)indium(III) (InTPP) release from microspheres and nanospheres of poly(lactide-co-glycolide) (PLGA) were performed using this new technique. The release of InTPP was biphasic, with an initial fast release followed by a second slower release. Mathematical models applied to the release proiles showed that the release of InTPP from the nanospheres was controlled by diffusion, which is to be expected for a substance homogeneously dispersed within the spheres. However, due to the large size distribution of the microspheres loaded with InTPP, the release proiles were irregular, hampering an adequate it to mathematical models. Confocal analysis of microparticles showed that the InTPP appeared to be homogenously distributed within the microspheres and no preferential distribution of InTPP towards the interior or towards the surface of the spheres was observed.
Keywords: chloro(5,10,15,20-tetraphenylporphyrinato)indium(III), nanospheres, microspheres, drug release, poly(lactide-co-glycolide)
Introduction
Tetraphenylporphyrins are interesting compounds f o r p h o t o d y n a m i c t h e r a py ( P D T ) , s i n c e t h e i r
photophysical properties favor the production of
singlet oxygen.1-4 The presence of In(III) in the core
of the photosensitizer structure enhances the in vitro
(InTPP) is an interesting photosensitizer for PDT because InTPP was 1.37-1.5 times more effective in
the photooxidation of red blood cells than Photofrin®,1
a commercial photosensitizer. In in vitro studies
InTPP-loaded nanoparticles of poly(lactide-co-glycolide) (PLGA) were more eficient than free InTPP in inducing human prostate carcinoma cell death, predominantly by apoptosis, showing an effective strategy for application of this very hydrophobic photosensitizer in future studies
of PDT.7
Investigations of drug release often provide important information about the internal structure of the carrier and the drug-carrier physicochemical relationships for developing successful formulations. However, an
appropriately designed in vitro release study is often
dificult to conduct because of a number of technical
problems.8 In most techniques the monitoring of the
drug release proile is performed by a physical separation of the colloidal drug carrier from the release medium to discriminate the unreleased and released drug. The results obtained using these methods relect complex kinetics of several simultaneous processes, and therefore
their interpretation may be highly misleading.9 The
objective of the present study was to develop a new technique that enables the monitoring of drug release, without prior separation of the spheres from the assayed
medium, using diffuse relectance spectroscopy.10 The
centrifugation step necessary to separate the spheres from the liquid phase to quantify the release of encapsulated drug at different intervals of time was eliminated by the novel technique.
InTPP was used as a hydrophobic drug model to study drug release from microspheres and nanospheres of PLGA using the new technique. Mechanistic mathematical models were applied to the release proiles to indicate if the encapsulated InTPP was in the polymeric matrix in the form of aggregates or was present as a homogenous molecular dispersion. Since the size and shape of the spheres, the drug loading and the drug distribution inside the polymeric spheres can are affect the rate of drug release, spheres were characterized with respect to size, surface morphology, entrapment efficiency and spatial distribution of InTPP within the spheres using scattering electronic microscopy, a
colorimetric method and confocal microscopy.11 Some
papers have shown that the residual PVA on the particle surface can inluence properties such as particles size
distribution, zeta potential and drug release proile.12,13
Therefore, we decided to quantify the residual emulsiier on the sphere surfaces and to evaluate the inluence of this coating by the zeta potential.
Materials and Methods
Reagents
Chloro(5,10,15,20-tetraphenylporphyrinato)indium(III) (degree of purity > 95%) was purchased from Frontier Scientiic Inc. (Logan, UT, USA). Hydrochloric acid, chloroform, 50:50 poly(lactide-co-glycolide) (average
molar mass (Mw) = 50,000-70,000 g mol-1), poly(vinyl
alcohol) (PVA) (Mw = 13,000-23,000 g mol-1, degree of
hydrolysis = 89%) and sodium hydroxide were purchased from the Sigma Chemical Company (St. Louis, MO, USA). Isobutyl alcohol, tetrahydrofuran (THF) and polystyrene were obtained from Merck (Whitehouse Station, NJ, USA). Iodine, potassium iodide and boric acid were purchased from Acros Organics (New Jersey, NJ, USA). The water used throughout the experiments was irst bi-distilled and then deionized in a Milli-Q ultra-puriication system (Millipore, Bedford, MA, USA). All other chemicals were of analytical grade and were used without further puriication.
Preparation of PLGA spheres
The PLGA spheres were prepared using a modified
emulsion/evaporation technique.7,14 Typically, 50 mg of
PLGA and 0.30 mg of InTPP were dissolved in a mixture of chloroform and ethanol (95:5 v/v, respectively). The organic phase was added slowly to an aqueous solution of PVA (2%, m/v) and ethanol (11%, v/v), which was homogenized for 30 min at 14,000 rpm to obtain nanospheres (UltraTurrax T18, IKA, Wilmington, NC, USA) or at 1200 rpm to obtain microspheres (Model 713D, Fisatom, São Paulo, SP, Brazil). Each resulting emulsion was subjected to magnetic stirring
for a period of 24 h to evaporate the CHCl3. The nanospheres
obtained after the evaporation period were recovered by
centrifugation at 20,400 × g for a period of 20 min at 10 °C
(Beckman J2-21, Beckman Instruments, Fullerton, CA, USA), and washed six times with water to remove the excess PVA and nonincorporated InTPP. The same procedure was performed to recover the microspheres. Use of a single washing step produced spheres containing 2.7 times more residual PVA, on average. Studies have shown that cryoprotectors such as sugars
prevent the aggregation of the particles during lyophilization.15
Particle morphology and mean size
The particle morphologies were analyzed in accordance with Silva et al.7 Typically, approximately 1 to 2 mg of lyophilized spheres were dispersed in deionized water and a droplet of this aqueous suspension was placed directly onto a metallic stub. Samples air dried over the stub were coated with a thin layer of gold with a Bal-Tec coater MED 020 (Balzers, Liechtenstein) using a current of 30 mA and a pressure of 6.7 Pa for a period of 160 min. The images obtained from Scanning Electron Microscopy (SEM) were analyzed using an image analysis software package (UTHSCSA ImageTool 3.0 UTHSCSA, San Antonio, TX, USA) combined with Origin 6.0 (OriginLab Corp., Northampton, MA, USA) to obtain the particle size distribution of the microspheres and nanospheres present in the lyophilized formulations. Five images of each replicate, from different points on the stub, were selected to determinate the particle size. An average was obtained from approximately 700 spheres for each replicate. The values are the mean of three replicate samples.
Zeta potential
The zeta potential of the spheres was measured from their electrophoretic mobility using a Zetasizer 3000 HAS (Malvern Instruments, Worcestershire, UK), employing a quartz capillary cell containing a pair of palladium electrodes, as previously reported by Vandervoort and
Ludwig16 and Zhang and Feng.17 About 3 mg of the
freeze-dried microspheres or nanospheres were dispersed in 10 mL of fresh deionized water without surfactant, followed by sonication for a period of 1 min. We monitored the pH
(5.2 ± 0.4) and the conductivity (0.50 ± 0.03 mS cm-1) of
Milli-Q water and no signiicant variation was observed during the experiment. This dispersion was injected into the capillary of the Zetasizer 3000 and the zeta potential was measured ten times. The mean zeta potential values for three replicates were calculated.
Particle recovery and entrapment eficiency
Determinations of particle recovery and entrapment
eficiency were performed as described previously.7 The
experiments were carried out in triplicate and the particle recovery was calculated using equation (1).
(1)
The InTPP incorporation eficiency was expressed using equations (2) and (3).
(2)
(3)
Typically, an amount of lyophilized spheres (2.0 mg) loaded with InTPP was dissolved in 1.0 mL of chloroform (a common solvent for PLGA and InTPP). The InTPP in the solution was quantiied using UV-vis spectroscopy (Hewlett Packard 8453A-Diode Array Spectrophotometer, Avondale, PA, USA) at 425 nm using an analytical curve obtained from ten different InTPP concentrations. The absorbance measurements established no interference from the PLGA polymer under the same conditions. The following validation parameters were
calculated for this method: linearity = 0.3-2.5 mmol L-1,
intraday variability = 1.4%, interday variability = 2.5%, l i m i t o f d e t e c t i o n = 0 . 0 8 mm o l L- 1, l i m i t o f
quantiication = 0.3 mmol L-1, accuracy = 94.4 ± 3.6%
with signiicance of 99%.
Determination of residual PVA
PVA tends to be adsorbed on the surface of a sphere through the hydrophobic part of vinyl acetate, which tends to anchor the polymer on the aqueous/organic
interface formed during the emulsiication process.12,18
After coacervation of phases the methyl groups of vinyl acetate are localized in the solid matrix of the sphere and the hydroxyl groups of PVA are exposed to aqueous phase. The amount of residual PVA associated with the spheres was determined using a colorimetric method based on the formation of a colored complex between the hydroxyl groups of PVA and iodine
molecules.19 Typically, 3 mg of spheres freeze-dried
without trehalose were treated with 2 mL of 0.5 mol L-1
NaOH for 15 min at 60 °C. Each sample was neutralized
with 900 mL of 1 mol L-1 HCl and the volume was
adjusted to 5 mL with deionized water. To each sample,
3 mL of a 0.65 mol L-1 solution of boric acid, 0.5 mL
of a solution of I2/KI (0.05 mol L-1/0.15 mol L-1),
and 1.5 mL of deionized water were added. Finally, the absorbance of the samples was measured at 664 nm after incubating for 15 min. A standard plot for PVA was prepared under identical conditions. All the determinations were performed in triplicate. The following validation parameters were calculated
for this method: linearity = 1.3-25 mg L-1, intraday
variability = 3.9%, interday variability = 5.2%, limit of
detection = 0.4 mg L-1, limit of quantiication = 0.3 mg L-1,
In situ InTPP release
A mass of 1.2 mg of lyophilized nanospheres or 0.6 mg of lyophilized microspheres was suspended in 2.0 mL of isobutyl alcohol at 27 °C in a closed quartz cuvette. This solvent was chosen because it is a solvent that dissolves InTPP, but not PLGA. The solubility of InTPP in isobutyl
alcohol was determined at 27 °C to be 97 ± 7 mmol L-1 (data
not shown). The total InTPP concentration (2.0 mmol L-1)
found in the lyophilized spheres was 49 times smaller than the solubility of InTPP in isobutyl alcohol, securing sink conditions to the experiment and adherence to Beer’s law. Our experiments were performed in an organic solution to monitor the release of InTPP from spheres due to diffusion of the compound from the spheres without invoking any chemical degradation of the spheres. Therefore, the purpose of these experiments did not simulate drug release in a cellular environment. The cuvette was kept in the dark to avoid photodegradation of the photosensitizer. The particles were maintained dispersed in the release medium by magnetic stirring throughout the experiment. The absorbance spectrum of the suspension at predetermined time intervals was measured at a wavelength of 421 nm using diffuse reflectance spectroscopy (DRS) (Varian Cary-5 UV-Vis-Nir, Palo Alto, CA, USA) without any
prior separation of the spheres from the release medium.10
The InTPP release was monitored until the percentage of release was 70% or greater. The DRS technique allowed us to eliminate centrifugation step before quantifying the drug released at various time intervals to the medium. The conditions that we have used with this technique were: ratio of lyophilized particles per volume of release medium
≤ 0.65 g L-1, photosensitizer solubility in the aqueous
release medium < 0.3 mmol L-1, absorbance wavelength
range from 200 nm to 800 nm and photosensitizer molar
mass from 580 to 680 g mol-1. A patent describing this
procedure has been deposited in Brazil.10 The cuvette was
placed at the front slit of the integrating sphere and a solid standard of poly(tetraluoroethylene) was placed at the back slit. The spectrum obtained from a standard blank of poly(tetraluoroethylene) and a cuvette containing only isobutyl alcohol was used to correct for any nonassigned signals. To identify if the monitored absorbance was due to InTPP released to the isobutyl alcohol or to InTPP dispersed in the spheres, independent experiments were performed at short (1.5 h), medium (78.3 h), and long release times (483.5 h). After these predetermined release times, each
suspension was centrifuged (30 min, 23,708 × g) to separate
the supernatant (released InTPP + isobutyl alcohol) and the microspheres or nanospheres. The absorbance spectrum of the supernatant was measured at 421 nm using DRS, and
the proile and intensity of the supernatant spectrum was compared to the suspension spectrum. The spheres were dissolved in chloroform and the InTPP absorbance was measured at 425 nm. Analytical curves of InTPP in isobutyl alcohol (421 nm) and chloroform (425 nm) were used to quantify the amount of InTPP in the release medium and dispersed in the spheres, respectively. This release study was performed in triplicate. The following validation parameters were calculated for this method of quantification:
linearity = 0.3-1.2 mmol L-1, intraday variability = 1.5%,
interday variability = 2.1%, limit of detection = 0.1 mmol L-1,
limit of quantiication = 0.3 mmol L-1, accuracy = 98.1 ± 1.6%
with signiicance of 99%.
Mathematical models applied to the release proiles
Three mathematical models were applied to the release proiles from the microspheres and the nanospheres loaded with InTPP to evaluate if the encapsulated InTPP was in the polymer matrix as a homogenous molecular dispersion (Jo’s model and Peppas’s model) or as a solid agglomerate (Polakovic’s model). Jo’s model assumes that releases are governed solely by diffusion, a mass transfer process that
can be quantiied using Fick’s second law,20 which has the
following form for spheres:
(4)
where c is the local substance concentration at time, t, at
distance, r, from the sphere’s center, and D is the diffusion
coeficient of the substance in the matrix. Assuming that the substance is uniformly distributed inside the delivery system, a perfect sink condition is maintained for the experiment and also assuming that a standard condition of symmetry from the center of the spherical particle is present, the following analytical solution of Fick’s second
law of diffusion related by Jo et al.20 can be used to describe
the kinetic drug release data:
(5)
where M
t and M∞ are the total amount of InTPP in the
sphere after time t, and after ininite time, respectively,
a = V/(VtKp) represents the equilibrium ratio of released and
retained InTPP , V is the bulk liquid volume, Vt is the total
volume of the spheres, Kp = ci∞/cb∞ is the partition coeficient characterized by the ratio of intraparticle and bulk liquid InTPP concentrations in thermodynamic equilibrium, and
(6)
Since we could not disregard the possible existence
of “nanopores” in the spheres, the term D represents the
apparent diffusivity, taking into account drug transfer through the polymer itself, as well as possible drug transfer through any “nanopores” illed with isobutyl alcohol.
Peppas’s mathematical model is an empirical model of diffusional release:21,22
(7)
where M
t and M are the total amount of InTPP in the
sphere after time t, and after ininite time, respectively, k
is a constant that incorporates the properties of the matrix of the sphere and of the InTPP, and n is the diffusional exponent, which is indicative of the transport mechanism. Equation (7) was used to characterize the irst 60% of the release behavior of InTPP from the polymer spheres. A diffusional exponent equal to 0.50 corresponds to Fickian
diffusion (M
t/M = kt
1/2) from a one-dimensional matrix.22
For spheres, when corrected for the geometry of the device (microparticles or nanoparticles), the diffusional exponent changes to a value of 0.43 and Fickian diffusion occurs in a spherical monolithic matrix.
Polakovic’s mathematical model is a dissolution mathematical model that is expected to it a drug release proile when a solid agglomerate of a drug is present in
the polymer matrix.23 Drug dissolution is not a mechanism
by which a drug is transported out of a polymer matrix, since this occurs by subsequent drug diffusion. However, dissolution would affect the rate of diffusional lux from the polymer spheres. Therefore, the dissolution rate of the drug is often the rate-determining step when absorption rates are faster than dissolution rates (e.g., for steroids). If this situation occurs, then a curative effect of the drug cannot be expected, owing to its limited residence time at
the absorption site. The dissolution model of Polakovic et
al.23 was also applied to the data of InTPP release to evaluate
if the encapsulated InTPP was in the polymer matrix in the form of aggregates:
(8)
where M
b and Mo are the amount of InTPP in the
bulk liquid and the initial amount of intraparticle InTPP,
respectively, kis the apparent dissolution rate constant, and
a and Kp have the same meaning as in the irst diffusion
model. Equations (5), (7) and (8) were itted to the release proile of the InTPP loaded-nanospheres and microspheres
using the software Origin 7.5. The correlation coeficient
for each itted mathematical model and the values of D,
n, and k, respectively, for the equation (5), (7) and (8), provided by the software were analyzed.
Confocal microscopy
The distribution of the InTPP within PLGA microspheres was determined using confocal microscopy. A small amount (2 mg) of lyophilized microspheres was redispersed in 1.0 mL of deionized water and a droplet of this suspension was spread onto a microscope slide. Samples were air-dried and the slide covered with a thin glass plate. The microspheres were visualized using a Zeiss Confocal LSM 510 microscope equipped with an argon-krypton laser
(lex = 488 nm) (Carl Zeiss Microimaging, Inc., Thornwood,
NY, USA). The luorescent emission of InTPP between 505 and 550 nm was selected using a BP505–550 band-pass ilter (Carl Zeiss Microimaging, Inc.). An optical cross section was taken using a gradual depth increase
of 0.6 mm to determine the distribution of the InTPP in
the microspheres. Unloaded PLGA-spheres were also analyzed to conirm that the luorescence observed from the InTPP-loaded microspheres was not emitted by polymer.
Results and Discussion
Characterization of InTPP-loaded nanospheres and microspheres
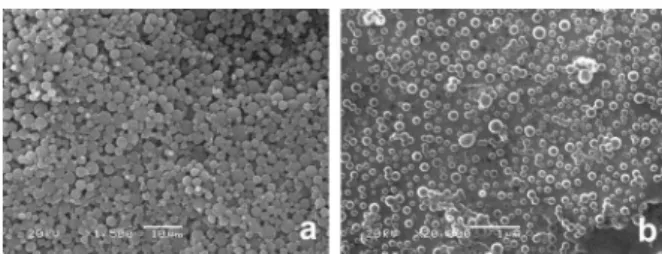
Figure 1 shows SEM images of the microspheres and nanospheres. It can be seen that for both formulations the shape of the particles was spherical with a large size distribution for microspheres (Figure 1a) and with a relatively homogenous size distribution for nanospheres (Figure 1b). No InTPP aggregates were detected in the particle samples.
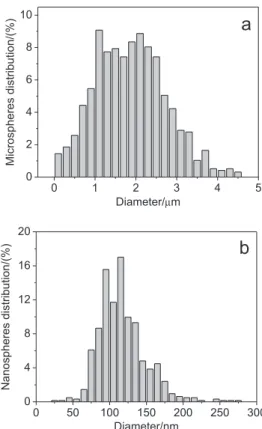
Analysis of the SEM micrographs (Figure 1) by an imaging software showed that the microspheres were
obtained with a mean diameter of 1.9 ± 0.2 mm and with
a size distribution ranging from 0.1 to 4.5 mm (Figure 2a).
Nanospheres were obtained with a mean diameter of
119 ± 9 nm, and a size distribution ranging from 25 to
275 nm (Figure 2b). For the treatment of cancer or for the treatment of non-oncologic diseases the limit of particle size depends on the administration route and/or on the disease localization. For example, in intravenous administration, to circulate through the smallest capillaries the particle size
should be less than 5 mm,24 but regardless of the transport
mechanism, the pore cutoff size of several tumor models
has been reported ranging between 380 and 780 nm.25
Brain cancers are extremely dificult to treat due to a lack of therapeutic strategies capable of overcoming barriers for effective delivery of drugs to the brain. Considering the size of the endothelial gaps (300 nm), fenestrations (5.5 nm maximum width), cytoplasmic vesicles such as caveolae (50-70 nm diameter) and vesicular vacuolar organelles (108 nm diameter), the particle size necessary for brain
treatment is less than 100 nm.26 Another example is for
lung cancer treatment. The drug delivery systems can use the technique of inhaled aerosols but particle sizes in the
1 to 5 mm range are necessary because these sizes allow
particles to reach the lower airways and even the alveoli
by gravitational sedimentation.27 For ocular administration,
researchers have shown that the particle sizes should be in
the 2 to 10 mm range to minimize irritation, to favor the
rate and the extent of penetration into the aqueous humor and to reduce the quick clearance of the suspended particles
from the conjuctival sac.28 Considering these facts, the size
of nanospheres and microspheres obtained in this work is compatible with several models of drug administration that could be used in photodynamic therapy.
The percentage of recovered microspheres (90 ± 4 %)
was 2.1 times higher than that obtained for nanospheres
(43 ± 2%), due to the greater size of microspheres
compared to the size of the nanospheres. The washing steps (experimental section) were repeated six times, always using
centrifugation at 20,400 × g for a period of 20 min. There
was a larger loss of particles (a mean loss of 57%) during this procedure for the formulation of nanospheres compared to the washing process of the formulation of microspheres (a mean loss of 10%). When a higher centrifugation rate and
time were used (37,500 × g for a period of 40 min) to decrease
the loss of particles in the formulation of nanospheres, there was only a small increase in the recovery yield the spheres, from 43% to 51%. Since the sedimentation rate of the particles in a centrifugal ield is proportional to the square of the particle diameter, it should be expected that the recovery of microspheres after the washing process would be higher than the recovery of nanospheres.
There was no signiicant difference in the entrapment
eficiency of InTPP in the PLGA microspheres (91 ± 5%) or
nanospheres (95 ± 3 %). Some researchers have attributed
the low entrapment eficiency of hydrophobic drugs to an interaction between the drug and the surfactant used to stabilize the emulsion, producing a migration of the drug
from the oil to the aqueous phase.29,30 The results from our
work suggest that this problem does not occur for InTPP encapsulation in PLGA microspheres or nanospheres when PVA is used as an emulsiier, since the average entrapment eficiency of InTPP in both spheres was > 90%.
The mean percentage of residual PVA on the surface of the PLGA spheres was five times higher in the
nanospheres (1.40 ± 0.20 %, m/m) than in the microspheres
(0.28 ± 0.04%, m/m). This difference in concentration of
PVA has been attributed by other researchers to differences
in the particle size.12,18 A smaller particle size has a higher
speciic surface area (ratio of the surface area/volume) and therefore, requires a larger amount of PVA to stabilize the droplets in the emulsion. Thus, at the end of the preparation, these spheres retain a larger amount of adsorbed PVA on their surface.
The percentage of residual PVA present depends on the methodology used to prepare the PLGA spheres. Data in the literature indicates a considerable diversity.
For example, Konan et al.31 found a percentage between
15.9% to 38.3% of residual PVA (Mw = 26,000 g mol-1)
adsorbed on the surface of 50:50 PLGA nanospheres with
a size of approximately 100 nm. Sahoo et al.12 found a
lower value of (3.5± 0.3) % for the percentage of residual
PVA (Mw = 30,000 to 70,000 g mol-1) for spheres having
approximately the same size. Comparing these values with our results, it can be seen that the percentage of residual PVA was lower for the formulation prepared in our laboratory. It is likely that this result is associated with the washing procedure, or with the number of washings of the colloidal suspensions used to eliminate residual
PVA.32 Konan et al.31 reported that excess PVA was
eliminated using a iltration process. However, this process is not eficient for the elimination of PVA, and resulted in a higher percentage of residual PVA on the surface of
their nanospheres.31 In the case of the results obtained
by Sahoo et al.,12 the washing process used was similar
to the process used in this work, although the number of washings employed (two) was less than that used in our work (six). Therefore, the increased number of washing
steps decreased the residual PVA on the spheres,32 which
is of particular interest for applications of the PLGA spheres, due to the nonbiodegradability of PVA. Konan et al.31 reported that the percentage of residual PVA on nanospheres loaded with meso-tetra(4-hydroxyphenyl) porphyrin (p-THPP) was related to the afinity between the photosensitizer and the emulsiier molecules, which could induce the adsorption of PVA on the surface of the particle. We prepared nanospheres and microspheres unloaded with InTPP and the percentage of the residual PVA was the same as obtained for the micro and nanospheres loaded with InTPP. Considering this, we concluded that InTPP did not induce the adsorption of PVA on the surface of the particles.
The zeta potential was negative for all spheres, but
the zeta potential of the microspheres (–44.8 ± 1.3 mV)
was 2.2 times more negative than that of the nanospheres
(–20.0 ± 0.2 mV). In general, a highly negative zeta
potential is expected for pure polyester spheres, owing to the presence of carboxyl groups at the extremities of
the polymeric chains.33 Researchers have reported a clear
differentiation of the zeta potential of noncoated PLGA
spheres34 and those coated with PVA,12 with highly negative
zeta potentials for noncoated spheres and less negative zeta potentials for coated spheres. Therefore, since the percentage of residual PVA is higher for nanospheres than for microspheres, it is likely that the degree of coating of the nanosphere surface was higher, and the zeta potential less negative, because of the decrease of uncapped carboxyl groups on the surface of the nanospheres.
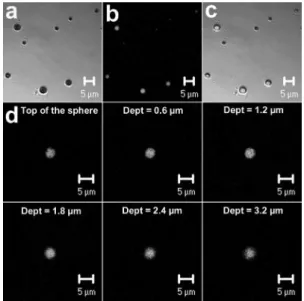
Confocal microscopy
The distribution of the InTPP within PLGA microspheres was determined using confocal microscopy (Figure 3). The micrographs clearly show the luorescence emitted by the InTPP encapsulated in the microspheres on excitation of the photosensitizer with an argon-krypton laser, since the luorescence was derived from the microspheres, and no emission was observed from the regions outside the spheres. Spheres with no PLGA-entrapped InTPP were also analyzed as a control (not shown) and the absence of any emission conirmed that the luorescence observed from the microspheres loaded with InTPP was due solely to the photosensitizer. Due to the magniication limitations of the microscope, it was not possible to observe the luorescence emitted from the InTPP-encapsulated nanospheres. Optical cross sections obtained from the top of the microspheres,
following a gradual increase of depth by 0.6 mm, conirmed
the presence of InTPP inside the polymer matrix (Figure 3). The InTPP appeared to be homogenously distributed within the microspheres and no preferential distribution of InTPP towards the interior or towards the surface of the spheres was observed. In addition, the InTPP seemed to remain inely distributed, showing no evidence of large InTPP particles within the microspheres.
In situ InTPP release
The organic solvent used as the release medium had no effect on the particle morphology. Microspheres maintained
their spherical shape after 1384 h dispersed in isobutyl alcohol and no change was observed in the microsphere size (Figure 4). The same results were observed for nanospheres (data not shown). A diffuse relectance accessory was also used to eliminate the interference of light scattering from spheres in the InTPP spectra as shown in Figure 5.
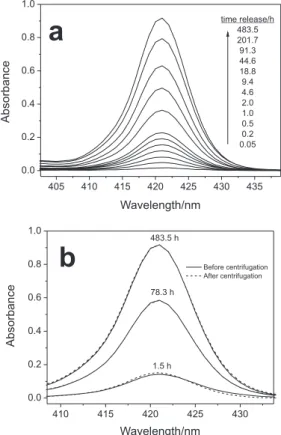
The InTPP absorbance spectra monitored without nanoparticle separation from the assayed medium (Figure 6a) shows that the InTPP absorbance increased during the release experiments, suggesting that the InTPP was released from the PLGA nanospheres. Independent release experiments were carried out, at short, medium, and long times. For each case, the suspension was centrifuged and the absorbance of the supernatant was measured to identify if the InTPP absorbance could be attributed to the InTPP released into the isobutyl alcohol or if it was dispersed in the spheres (Figure 6b). The results showed that there was no difference between the proile or the intensity of the absorbance spectrum of InTPP from a centrifuged sample (supernatant) and a noncentrifuged sample (suspension), suggesting that the InTPP spectra measured without separation of the nanospheres from the release medium belongs to InTPP released into the isobutyl alcohol and not to InTPP dispersed in the nanospheres. This hypothesis was corroborated by quantiication of the released InTPP
in the isobutyl alcohol and of the residual InTPP in the centrifuged nanospheres for each experiment performed at short, medium and long release times. The values obtained
for the released and for the residual InTPP were 0.5 mg
and 3.1 mg for the release time of 1.5 h, 2.0 mg and 1.6 mg
after 78.3 h, and 3.1 mg and 0.3 mg at 483.5 h, respectively.
The amount of InTPP released in the isobutyl alcohol
increased from 0.5 mg to 3.1 mg when the independent
experiments were performed at 1.5 h and 483.5 h and the residual InTPP determined in the spheres decreased from
3.1 mg to 0.3 mg. These results corroborated the capacity
of this new technique to monitor the release of InTPP in the isobutyl alcohol without particles separation from the release medium.
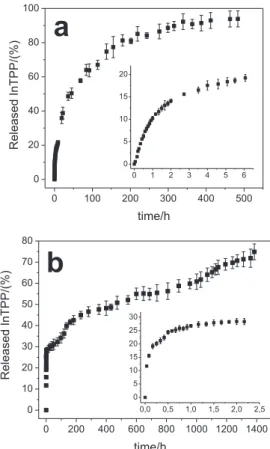
Figure 7 shows the release proiles of InTPP from the PLGA microspheres and nanospheres in the form of the percentage of InTPP released with time. The released InTPP was monitored over a period of about 1400 h for the microspheres and 500 h for the nanospheres. Recent work showed that three different mechanisms govern drug
release from PLGA nanoparticles in an aqueous medium.35
The mechanisms consist of an initial burst release, a degradative relaxation-induced drug dissolution release and
Figure 4. SEM images of microspheres of InTPP-loaded PLGA (a) before and (b) after 1384 h dispersed in isobutyl alcohol at 27 oC.
Figure 5. Absorbance spectra of an InTPP-loaded nanoparticle suspension in isobutyl alcohol at 27 oC obtained ( ) with and (---) without the diffuse
relectance accessory. The total InTPP concentration in the suspension was 2.0 mmol L-1.
inally a diffusional release. In this situation, degradative relaxation plays an important role to create the free volume lacking in the initially glassy PLGA matrix and promotes additional release. Therefore, polymeric matrix degradation accelerates drug release and this is faster than that observed in our results because the isobutyl alcohol did not provoke the polymeric matrix degradation. Literature results have shown that the release of the encapsulated drug into an aqueous medium can reach 60 % to 100 % 24 h after
its administration.36 But our results obtained in isobutyl
alcohol indicate the InTPP released from microspheres and nanospheres reached 30 and 40% after the same release time, respectively. Recently, we showed that only two hours of incubation were suficient for InTPP-loaded PLGA nanospheres to reduce the viability of LNCaP
prostate tumor cells.7
The results shown in Figure 7 indicate that the release of InTPP was characteristically biphasic, with an initial fast release, followed by a second slower release. This biphasic characteristic is an interesting property for clinical application of encapsulated InTPP because it allows the irradiation to be performed after short or longer intervals after administration of photosensitizer without needing a new dose of the drug. Results reported in the literature have shown that short intervals are typical for skin cancer treatment and longer intervals for lung, prostate and brain
cancer treatment.37 In the initial “burst” phase, around 19%
of the InTPP was released from the nanospheres within the initial 6 h, while around 28% of the InTPP was released from the microspheres within the irst 2.2 h. This initial rapid release was attributed to the InTPP in the supericial
zone, i.e., that adsorbed on the particle surface or dispersed
in the particle very close to its surface. The residual percentage of PVA on the surface of the nanospheres was ive times higher than for the surface of the microspheres. Researchers have shown that the large amounts of residual PVA present on the particle surface form a barrier to drug
release.12 Hence, it is possible that the larger amount of PVA
present on the surface of nanospheres hampered the release of InTPP located in the supericial zone of a nanosphere, leading to a decrease in the rate of InTPP release.
The second, slower release phase was attributed to diffusion of dissolved InTPP into the release medium from within the PLGA core of the spheres, since no surface degradation of the particle was observed in SEM analysis, even after long release times (Figure 4). Figure 7 shows that 94% of the InTPP was released from the nanospheres after 484 h, while 75% of the InTPP was released from the microspheres after 1385 h. This difference is expected, because the increased size of the microspheres means that the diffusion path length is increased and, thus, the
concentration gradient and mass transport rate is decreased. Moreover, larger spheres have a smaller speciic surface area (surface area : volume), allowing a more delayed
release of the drug in the second release phase.11 The
release proile from microspheres loaded with InTPP was characterized by multiple increases and decreases in the release rate. The irregular release from microspheres can be explained as a weighted combination of the release proiles, resulting from the various sizes of the microspheres
in the sample (Figure 2a). Berkland et al.11 have also
reported an irregular release proile due to nonuniform microsphere size. The same behavior was not observed for the nanospheres since the smaller distribution of the spheres favors a more regular release rate.
Mathematical model applied to the release proiles
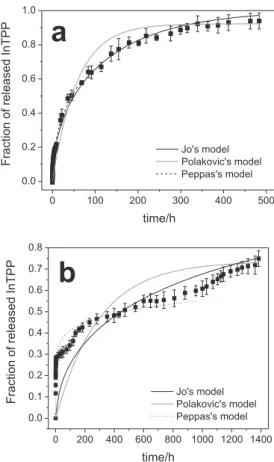
Fitting equation (5) to the experimentally determined InTPP release rate from the InTPP-loaded PLGA nanospheres led to a good agreement between Jo’s diffusion model and the experimental data (Figure 8a, solid curve)
since the correlation coeficient was R2 = 0.9886. However,
the same result was not obtained for InTPP released from
the microspheres (Figure 8b, solid curve) since R2 = 0.5503.
This outcome suggests that the release of InTPP from the
nanospheres was controlled by diffusion, while the release of InTPP from the microspheres was inluenced by both the diffusion from the interior and the nonuniform size of the spheres. The latter contributed to an irregular release proile that hampered the itting of equation (5). It is expected that, for a substance homogeneously dispersed within spheres, any release would occur mainly by diffusion through
the polymer matrix.38 The value of D, obtained from the
nonlinear itting of the curve, was 2.4 × 10⁻²¹ m2 s-1 and
5.3 × 10⁻¹⁴ m2 s-1 for the InTPP released from the nanospheres and the microspheres, respectively. Diffusion coeficients of drugs in organic phases are usually of the order of 10–9 m2 s-1,39 so the observed coeficients were clearly lower than expected. Thus, the low values of the diffusion coeficients for InTPP encapsulated in microspheres and in nanospheres suggest that the InTPP was retained by the matrix of the spheres. This was corroborated by confocal microscopy (Figure 3) since the micrographs of optical cross sections conirmed that the InTPP was inside the polymeric matrix.
On itting curves to the data from this work using equation (7), a somewhat better agreement was obtained between Peppas’s empirical model and the experimental data for
InTPP released from the nanospheres (Figure 8a, dot-dash curve) than for InTPP released from the microspheres
(Figure 8b, dot-dash curve), since R2 = 0.9876 for the InTPP
release from the nanospheres and R2 = 0.9406 for InTPP
release from the microspheres. A value of n = 0.44 ± 0.01,
obtained for the release of InTPP from the nanospheres, indicates that this release was governed by Fickian diffusion. This result is similar to that obtained using Jo’s mathematical
model.20 The value of n = 0.23 ± 0.01 for release from the
microspheres shows that this release is not governed by Fickian diffusion. This conclusion also agrees with the results obtained from Jo’s diffusion model. The undeined release mechanism of the InTPP encapsulated in microspheres was related to the nonuniform size of the spheres that caused an irregular release rate of the InTPP and hampered the it of mathematical models to the release proile.
The experimental data better it Polakovic’s dissolution model for InTPP release from the nanospheres (Figure 8a, dashed curve) than for InTPP release from microspheres
(Figure 8b, dashed curve) since R2 = 0.9495 and 0.1448,
respectively. However, these results suggest that the release of InTPP from either the nanospheres or the microspheres was not controlled by InTPP dissolution, since the its using Jo’s and Peppas’s diffusion models was better than that using Polakovic’s dissolution model. The lack of it to Polakovic’s dissolution model agrees with the confocal micrographs that showed no evidence of large InTPP aggregates within the spheres. The apparent dissolution rate constants for the release of InTPP from the nanospheres or microspheres were 4.5 × 10⁻⁶ s–1 and 6.9 × 10⁻⁷ s–1, respectively. Polakovic et al.23 showed that diffusion through a polymer matrix was the best mathematical model to use to it the release kinetics of lidocaine from PLA nanospheres with low drug loadings (< 10 % w/w), and the dissolution model was more suitable to describe the release from spheres with higher drug loadings (> 10 %). Similar observations
were obtained by Gorner et al.,40 who presumed the
formation of a homogeneous matrix with the drug being randomly distributed throughout the polymer particles at low loading, with a heterogeneous matrix existing at high loadings. These literature data, in association with confocal microscopy and the results of the mathematical models applied to the release proiles, lead us to suggest that the InTPP was distributed homogeneously in the polymer matrix. Since the percentage of InTPP loading
in the PLGA spheres was < 1% (0.56 ± 0.02 %, m/m),
no evidence of large InTPP aggregates within the spheres was observed and both Fickian models (Jo’s and Peppas models) were better itted to the release proiles than was Polakovic’s dissolution model,
Conclusions
The elimination of the interference of light scattering from spheres in the InTPP absorbance spectra, by use of a diffuse relectance accessory allows in situ monitoring of the release of the encapsulated InTPP. This new technique reduces the necessity of centrifugation steps to quantify the InTPP released in deined intervals of time. The release proiles from InTPP-loaded microspheres and nanospheres were characterized by a burst phase complemented by a second slower release phase. The rapid release phase was attributed to InTPP in the supericial zone of the particles. Nanospheres delayed the InTPP release in the burst phase due to the large percentage of PVA on their surface. However, the microspheres presented a slower release rate for the second phase due to the increase of the diffusion path length and the reduced speciic surface area. Mathematical models applied to the release proiles allowed concluding that the release of InTPP from nanospheres was controlled by diffusion, which is to be expected for a substance homogeneously dispersed within the spheres. However, due to the large size distribution of the microspheres loaded with InTPP, the release proiles were irregular, hampering an adequate it to our mathematical models. Confocal microscopy data from different optical cross sections showed that the InTPP distribution was homogeneous in microspheres with no evidence of InTPP aggregation being present.
Acknowledgments
We thank Dr. Sara Teresinha Olalla Saad for technical assistance in the analysis of the confocal microscopy data. This work was supported by grants from the Fundação de Amparo à Pesquisa do Estado de São Paulo, the Conselho Nacional de Desenvolvimento Cientíico e Tecnológico, and the Universidade Estadual de Campinas.
References
1. Silva, A. R.; Pelegrino, A. C.; Tedesco, A. C.; Jorge, R. A.;
J. Braz. Chem. Soc.2008, 19, 491.
2. Gorman, A.; Killoran, J.; O’Shea, C.; Kenna, T.; Gallagher, W. M.; O’Shea, D. F.; J. Am. Chem. Soc.2004, 126, 10619. 3. Bonnett, R.; McGarvey, D. J.; Harriman, A.; Land, E. J.; Truscott,
T. G.; Winield, U. J.; Photochem. Photobiol.1988, 48, 271. 4. Zenkevich, E.; Sagun, E.; Knyukshto, V.; Shulga, A.; Mironov,
A.; Efremova, O.; Bonnett, R.; Songca, S. P.; Kassem, M.;
J. Photochem. Photobiol. B1996, 33, 171.
5. Chen, Y.; Zheng, X.; Dobhal, M. P.; Gryshuk, A.; Morgan, J.; Dougherty, T. J.; Oseroff, A.; Pandey, R. K.; J. Med. Chem. 2005, 48, 3692.
6. Rosenfeld, A.; Morgan, J.; Goswami, L. N.; Ohulchankyy, T.; Zheng, X.; Prasad, P. N.; Oseroff, A.; Pandey, R. K.; Photochem. Photobiol.2006, 82, 626.
7. Silva, A. R.; Inada, N. M.; Rettori, D.; Baratti, M. O.; Vercesi, A. E.; Jorge, R. A.; J. Photochem. Photobiol. B2009, 94, 101. 8. Washington, C.; Yang, S. In Microencapsulation. Methods and Industrial Applications; Benita, S., eds.; Marcel Dekker, Inc.: New York, 2005, ch. 7.
9. Soppimath, K. S.; Aminabhavi, T. M.; Kulkarni, A. R.; Rudzinski, W. E.; J. Control. Release2001, 70, 1; Washington, C.; Int. J. Pharm.1989, 56, 71; Washington, C.; Int. J. Pharm. 1990, 58,1.
10. Silva, A. R; Jorge, R. A.; Br PI 0.703.005-3, 2007.
11. Berkland, C.; Kim, K.; Pack, D. E. W.; Pharm. Res. 2003, 20, 1055.
12. Sahoo, S. K.; Panyam, J.; Prabha, S.; Labhasetwar, V.;
J. Control. Release2002, 82, 105.
13. Galindo-Rodriguez, S.; Allemann, E.; Fessi, H.; Doelker, E.;
Pharm. Res. 2004, 21, 1428; Panyam, J.; Sahoo, S.K.; Prabha, S.; Bargar, T.; Labhasetwar, V.; Int. J. Pharm.2003, 262, 1. 14. Jeffery, H.; Davis, S. S.; O’Hagan, D. T.; Int. J. Pharm.1991,
77, 169.
15. Carpenter, J. F.; Pikal, M. J.; Chang, B. S.; Randolph, T. W.;
Pharm. Res.1997, 14, 969.
16. Vandervoort, J.; Ludwig, A.; Int. J. Pharm.2002, 238, 77. 17. Zhang, Z. P.; Feng, S. S.; Biomacromolecules2006, 7, 1139. 18. Lee, S. C.; Oh, J. T.; Jang, M. H.; Chung, S. I.; J. Control.
Release 1999, 59, 123.
19. Joshi, D. P.; Lan-Chun-Fung, Y. L.; Pritchard, J. W.; Anal. Chim. Acta1979, 104, 152.
20. Jo, Y. S.; Kim, M.; Kim, D. K.; Kim, C.; Jeong, Y.; Kim, K.; Muhammad, M.; Nanotechnology2004, 15, 1186.
21. Ritger, P. L.; Peppas, N. A.; J. Control. Release1987,5, 37. 22. Ritger, P. L.; Peppas, N. A.; J. Control. Release1987, 5, 23. 23. Polakovic, M.; Gorner, T.; Gref, R.; Dellacherie, E.; J. Control.
Release1999, 60, 169.
24. Gref, R.; Domb, A.; Quellec, P.; Blunk, T.; Muller, R.H.; Verbavatz, J.M.; Langer, R.; Adv. Drug Deliver. Rev.1995, 16, 215.
25. Hobbs, S.K.; Monsky, W.L.; Yuan, F.; Roberts, W.G.; Grifith, L.; Torchilin, V.P.; Jain, R.K.; Proc. Natl. Acad. Sci. USA1998,
95, 4607.
26. Murthy, R.S.R.; Reddy, L.H. In Nanotechnology for Cancer Therapy; Amiji, M.M., eds.; CRC Press: Boca Raton, USA, 2006, ch.15.
27. Meisner, D. In Pharmaceutical Particulate Carriers. Therapeutics Applications; Rolland, A., eds.; CRC Press: Boca Raton, USA, 1993, ch. 3.
29. Feng, S. S.; Mu, L.; Win, K. Y.; Huang, G. F.; Curr. Med. Chem. 2004, 11, 413.
30. Rouzes, C.; Leonard, M.; Durand, A.; Dellacherie, E.; Colloids Surf. B: Biointerfaces2003, 32, 125.
31. Konan, Y. N.; Cerny, R.; Favet, J.; Berton, M.; Gurny, R.; Allemann, E.; Eur. J. Pharm. Biopharm.2003, 55, 115. 32. Zambaux, M. F.; Bonneaux, F.; Gref, R.; Maincent, P.;
Dellacherie, E.; Alonso, M. J.; Labrude, P.; Vigneron, C.;
J. Control. Release1998, 50, 31.
33. Govender, T.; Stolnik, S.; Garnett, M. C.; Illum, I.; Davis, S. S.; J. Control. Release1999, 57, 171.
34. Stolnik, S.; Garnett, M. C.; Davies, M. C.; Illum, L.; Bousta, M.; Vert, M.; Davis, S. S.; Colloids Surf. A: Physicochem. Eng. Asp.1995, 97, 235.
35. Lao, L.L.; Venkatraman, S.S.; Eur. J. Pharm. Biopharm.2008,
70, 796.
36. Bechet, D.; Couleaud, P.; Frochot, C.; Viriot, M.; Guillemin, F.; Barberi-Heyob, M.; Trends Biotechnol.2008, 26, 612; Simioni, A.R.; Vaccari, C.; Re, M.I.; Tedesco, A.C.; J. Mater. Sci.2008,
43, 580.
37. Zeisser-Labouèbe, M.; Vargas, A.; Delie, F.; In Nanomaterials
for Cancer Therapy; Kumar, C.; eds.; Wiley-VCH: Weinheim,
2006, ch. 2.
38. Crank, J.; The Mathematics of Diffusion, 2nd ed., Clarendon
Press: Oxford, 1956.
39. Declarer, C.; Orecchioni, A. M.; Depraetere, P.; Osterstock, F.; Nakache, E.; Int. J. Pharm.2003, 253, 133.
40. Gorner, T.; Gref, R.; Michenot, D.; Sommer, F.; Tran, M. N.; Dellacherie, E.; J. Control. Release1999, 57, 259.
Received: March 31, 2009
Web Release Date: November 6, 2009